Int. J. Electrochem. Sci., 7 (2012) 3706 - 3716
International Journal of
ELECTROCHEMICAL
SCIENCE
www.electrochemsci.org
Copper-Selective PVC Membrane Sensor
Mohammad Reza Ganjali, Ali Ghafarloo, Farnoush Faridbod* and Parviz Norouzi
Center of Excellence in Electrochemistry, Faculty of Chemistry, University of Tehran, Tehran, Iran
*
E-mail: [email protected]
Received: 2 March 2012 / Accepted: 19 March 2012 / Published: 1 April 2012
Spectroscopic study in acetonitrile solution shows a selective interaction between 1-(2-hydroxybenzylidene) thiosemicarbazide (L) and copper cation in comparison with other inorganic metal ions. Thus, L was then used as a good sensing material in copper selective PVC membrane sensor. The proposed potentiometric sensor showed a stable potential response to Cu2+ ions with Nernstian slope of 28.6±0.4 mV decade-1
over a wide linear concentration range of 1.0×10⁻⁵-1×10⁻¹ mol L-1. The sensor was found to have a short response time of about 25 s and have an acceptable life time. Application of the proposed sensor in analysis of copper content of some water samples showed good results.
Keywords: Potentiometry, sensor, copper, ion selective electrode, PVC membrane
1. INTRODUCTION
Copper and its alloys have been used for thousands of years. The major applications of copper are in electrical wires (60%), roofing and plumbing (20%) and industrial machinery (15%). Also, copper is one of the essential trace elements for the body and excess amount will be toxic. Concern has increased with enhancement associated toxic exposure by their wide usages and potentially toxic effects on human health specially infants and young children [1,2]. Therefore, determination of copper ion in a wide range of chemical and biological processes in various media such as water, biological, environmental, medical and industrial samples plays a significant role.
technique, low cost, selectivity, accuracy and speed. This has made the methods a candidate for several applications in different fields [3-10].
The important part in designing an ion selective electrode is finding a suitable and selective sensing element. Many ion selective electrodes have been previously reported for various ionic species [11-23]. Their differences are from the ionophore used as sensing element. This organic compound effectively nominate to which ionic species the electrode should respond. A selective complexation of a ligand with an ion always leads to designing an ion-selective electrode.
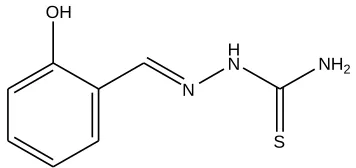
Here, the primary spectroscopic studies for complexation, showed a selective tendency of the synthesized ionophore, 1-(2-hydroxybenzylidene) thiosemicarbazide (L) (Fig. 1), toward selective complexation with Cu2+ ions in comparison with other common metal ions. As a result, L compound was used as selective sensing element in construction of copper selective electrode. The proposed electrode was then successfully used in determination of Cu2+ ion in waste water samples.
OH
N H
N NH2
[image:2.596.209.387.302.386.2]S
Figure 1. Chemical structure of the sensing material
2. EXPERIMENTAL SECTION
2.1. Apparatus
Spectroscopic studies were carried out on a PERKIN-ELMER Lambda 2 UV-Vis. Spectrophotometer with 1 cm pass length quartz cells.
The glass cell, where the copper ion-selective electrode was placed, consisted of two Ag/AgCl reference electrodes (Azar electrode, Iran) as the internal and external reference electrodes. Both electrodes were connected to a Corning ion analyzer with a 250 pH/mV meter with ±0.1 mV precision.
2.2. Reagents
and 2 mmol thiosemicarbazide and 0.5 mmol PTSA was refluxed in 15 ml ethanol for 10 h. The solvent was then removed and the residue was recrystallized in ethyl acetate.
2.3. UV-Vis spectroscopic Measurements
In all measurements, 3 mL of ligand solution (5.0×10⁻⁵ mol L-1) are placed in a quartz cell with 1 cm pass length. Then, a known amount of a metal ion solution (5.0×10⁻³
mol L-1) is added using a calibrated micropipette. The absorbance of the solution is measured after each addition. The ion addition is continued until the desired ionophore-to-ion mole ratio is achieved.
2.4. Electrode preparation
The general procedure to prepare the PVC membrane electrode was as followed: Different amounts of the ionophore along with appropriate amounts of additive were carefully weighed. Then, 30 mg PVC and known amounts of plasticizer were added to the mixture.
The mixture was dissolved in 2 mL of tetrahydrofuran (THF), and the solution was mixed well into a glass dish of 2 cm diameter. The solvent was then evaporated slowly until an oily concentrated mixture was obtained. A pyrex tube (3-5 mm o.d.) was dipped into the mixture for about 10 s to a transparent membrane of about 0.3 mm thickness was formed. The tube was then pulled out from the mixture and kept at room temperature for about 6 h. The tube was then filled with an internal filling solution (1.0×10⁻³
mol L-1 CuCl2). The electrode was finally conditioned for 24 h by soaking in a
1.0×10⁻³
mol L-1 Cu(NO3)2 solution [19-23].
2.5. Emf measurements
The following cell was assembled for measurement of the emf (electromotive force):
Ag–AgCl, KC1 (satd.) | internal solution, 1.0×10⁻³ mol L-1 CuCl2 | PVC membrane | sample solution |
Ag–AgCl, KC1 (satd.)
An ion analyzer 250 pH/mV meter was used for the potential measurements at 25.0 ± 0.1 °C.
3. RESULTS AND DISCUSSIONS
Thus, interaction of L with some cations was studied by spectroscopic method in acetonitrile solutions. The results revealed that L has a selective tendency to Cu2+ ions in comparison to other tested cations. It meant that L can be act as a suitable ion carrier in a Cu2+-selective electrode.
3.1. Spectroscopic studies
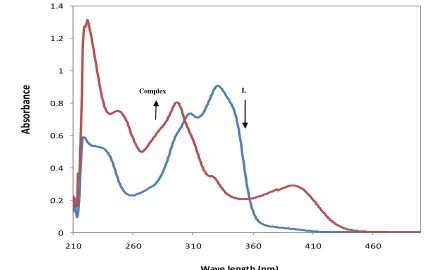
The ligand coordination with the ion can be investigated by UV-Vis. spectroscopy. From the UV-Vis. spectra in Fig. 2, show complexation between L and Cu2+ ion. The substantial decrease in the absorbance at a certain wavelength of the ligand solution, after adding the ion solution stepwise, may give a new adsorption peak at another wavelength, which is related to complex formation. At the same time, the effects of the other ions on the spectrum of the carrier were also investigated. For the evaluation of the formation constant from absorbance-mole ratio data, again the non-linear least-squares curve-fitting program DATAN was used. The formation-constant value (Kf) of the resulting
1:1 complexes of L with copper ion was 6.45×10⁻⁶
[image:4.596.69.495.337.607.2].
Figure 2. UV-Vis. Spectra of the interaction of L with copper ion
3.2. Membrane composition effect on the potential response of the electrode
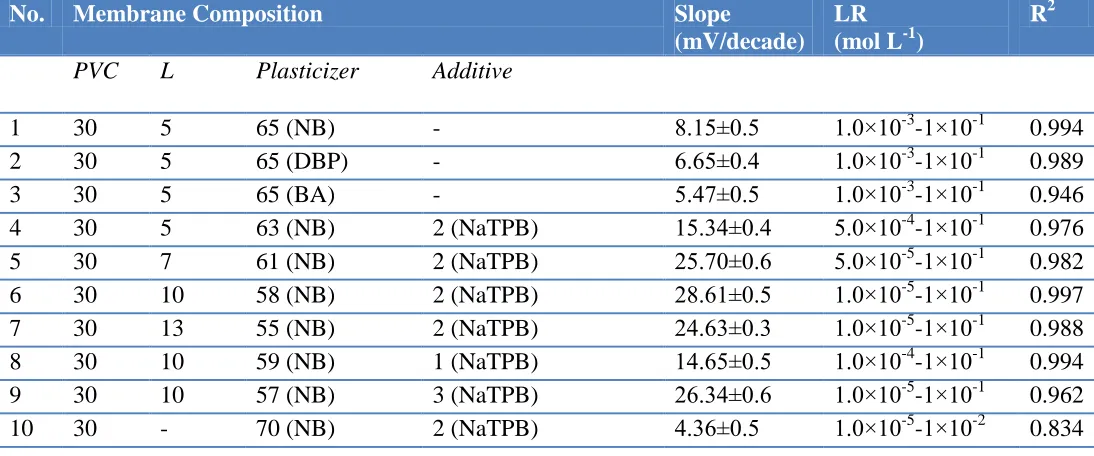
Since the degree of sensitivity and selectivity for a certain ionophore is greatly related to the membrane ingredients [31-40], the influence of the membrane composition on the potential responses of the copper electrode was studied. In this study, different membrane compositions, as shown in Table 1, were tested.
0 0.2 0.4 0.6 0.8 1 1.2 1.4
210 260 310 360 410 460
Ab
so
rb
an
ce
Wave length (nm)
Table 1 .The optimization of the membrane ingredients
No. Membrane Composition Slope
(mV/decade) LR (mol L-1)
R2
PVC L Plasticizer Additive
1 30 5 65 (NB) - 8.15±0.5 1.0×10⁻³-1×10⁻¹ 0.994
2 30 5 65 (DBP) - 6.65±0.4 1.0×10⁻³-1×10⁻¹ 0.989
3 30 5 65 (BA) - 5.47±0.5 1.0×10⁻³-1×10⁻¹ 0.946
4 30 5 63 (NB) 2 (NaTPB) 15.34±0.4 5.0×10⁻⁴-1×10⁻¹ 0.976
5 30 7 61 (NB) 2 (NaTPB) 25.70±0.6 5.0×10⁻⁵-1×10⁻¹ 0.982
6 30 10 58 (NB) 2 (NaTPB) 28.61±0.5 1.0×10⁻⁵-1×10⁻¹ 0.997
7 30 13 55 (NB) 2 (NaTPB) 24.63±0.3 1.0×10⁻⁵-1×10⁻¹ 0.988
8 30 10 59 (NB) 1 (NaTPB) 14.65±0.5 1.0×10⁻⁴-1×10⁻¹ 0.994
9 30 10 57 (NB) 3 (NaTPB) 26.34±0.6 1.0×10⁻⁵-1×10⁻¹ 0.962
10 30 - 70 (NB) 2 (NaTPB) 4.36±0.5 1.0×10⁻⁵-1×10⁻² 0.834
The copper ion extraction into the liquid membrane was a result of the high concentration of the ligand in the membrane. From Table 1, it was obvious that in the absence of sensing element and with the presence of other components (no. 10), the response of the recommended electrode was too low (4.36±0.5 mV/decade).
The second factor which affects the electrode response is the plasticizer. The plasticizer helps the extraction of the ion. After the evaluation of the solvent mediators (NB, BA and DBP), it was observed that NB having the higher dielectric constant results the better responses. Higher dielectric constant values leading to the extraction of the polar ions, like copper ions to the membrane.
The presence of lipophilic anions in a cation-selective membrane was also considered. Actually, the presence of such anions in a cation-selective membrane, which is based on a neutral carrier, decreases the ohmic resistance and improves the response behavior and selectivity. Furthermore, when the extraction capability is poor, it increases the membrane electrode sensitivity [35-38]. Here, addition of 2% NaTPB as an additive led to the slope increase from the sub-Nernstian value to the Nernstian value.
As it can be seen, the membrane with the composition of 30% PVC, 10% L, 2% NaTPB and 58% NB (no. 6) was the optimum one in the development of this sensor.
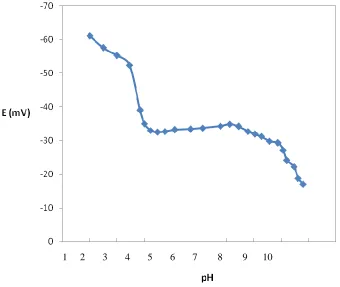
3.3. pH effect on the electrode response
In an approach to understanding the impact of pH on the electrode response, the potential was measured at particular concentrations of the copper ion solution (1.0×10⁻³
Figure 3. pH effect on the response of the copper selective electrode
In agreement with the resulting data, the potential remained constant despite the pH change in the range of 3.5 to 7.5, indicating the applicability of this electrode in this specific pH range. On the contrary, relatively noteworthy fluctuations in the potential vs. pH behavior took place below and above the formerly stated pH limits. In detail, the fluctuations above the pH value of 7.5 might be justified by the formation of the soluble and insoluble copper hydroxy complexes in the solution. On the other hand, the fluctuations below the pH value of 3.5 were attributed to the partial protonation of the employed ionophore. Consequently, the behavior of the membrane electrode towards copper ion concentration was found to be inaccurate in the pH range of 3.5 to 7.5.
3.4. Study of sensor properties
The properties of an ion-selective electrode are characterized by the following parameters [39-48]:
(1) Measuring range (2) Detection limit (3) Response time (4) Selectivity (5) Lifetime
3.4.1. Measuring range
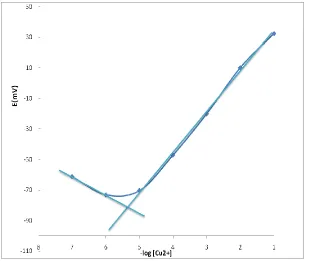
The measuring range of an ion-selective electrode includes the linear part of the calibration graph as shown in Fig. 3. For many electrodes the measuring range can extend from 1 molar down to 10-6 or even 10-7 molar concentrations. The applicable measuring range of the proposed sensor is between 1×10⁻⁵
and 1×10⁻¹ mol L-1.
Figure 4. Calibration curve of the copper selective electrode with composition of membrane No. 6
3.4.2. Detection limit
In practice, detection limits for the most selective electrodes are in the range of 10−5–10−6 mol L-1. However, recent studies have shown that even sub-nM detection limits can be obtained for these devices by different methods such as application of metal buffers to eliminate the contamination of very dilute solutions, using cation-exchange resin in the internal solution of ISEs to keep the primary ion activity at a constant low level, using liphophilic particles such as silica-gel 100 C18-reversed phase into the sensing membrane, using sandwich membranes, and so on. In this work the detection limit of the proposed membrane sensor was 5.4×10⁻⁶
mol L-1 which was calculated by extrapolating the two segments of the calibration curve (Fig. 4).
3.4.3. Response time
[image:7.596.146.455.192.453.2]
test solution, the concentration and composition of the solution to which the electrode was exposed before experiment measurements were performed, any previous usages or preconditioning of the electrode, and the testing temperature have an effort on the experimental response time of a sensor [46-53]. In this work, less than 25 s response time was obtained in different copper solutions from 1.0×10⁻⁵ to 1.0×10⁻¹ mol L-1.
3.4.4. Selectivity
[image:8.596.211.388.309.528.2]The potentiometric selectivity coefficients of the copper electrode were evaluated by the matched potential method (MPM) [54-59].
Table 2. The selectivity coefficients of various interfering cations for the membrane
Ion Log KMPM
K+ -4.3
Mg2+ -4.0
Ca+2 -4.1
Ba2+ -4.0
Pb+2 -3.7
Fe3+ -3.3
Hg2+ -2.6
Cr3+ -3.4
Ni2+ -3.9
Co3+ -4.0
Cd2+ -4.1
La3+ -4.4
Yb3+ -4.3
The resulting values of the selectivity coefficients are given in Table 2. As can be seen from Table 2, for the all mono and bivalent metal ions and trivalent lanthanide ions tested, the selectivity coefficients are less than 2.5×10⁻³
, which seems to indicate negligible interferences in the performance of the electrode assembly. Also, there is a good correspondence between the formation constants and the selectivity coefficients order, because the selectivity of an ion-selective electrode is mainly related to the stability of the complex between ion and ionophore.
3.4.5. Lifetime
per day). The proposed sensors can be used for six weeks. First, there is a slight gradual decrease in the slopes (from 28.61 to 14.3 mV/decade) and, second, an increase in the detection limit (from 5.4×10⁻⁶
mol L-1 to 4.3×10⁻⁴ mol L-1). It is well established that the loss of plasticizer, carrier, or ionic site from the polymeric film due to leaching into the sample is a primary reason for the limited lifetimes of the sensors.
3.5. Analytical application
The copper content of three waste-water of copper electroplating samples (after adjusting the pH of solution to 5.0), was determined by the proposed electrodes using the calibration graph. The results obtained by the proposed copper sensor, together with those obtained by atomic absorption spectrometry (AAS) are in a satisfactory agreement with RSD value of 5.32% and the relative error percent of 3.56%.
4. CONCLUSION
Spectroscopic study in acetonitrile solution shows a selective interaction between 1-(2-hydroxybenzylidene) thiosemicarbazide (L) and copper cation in comparison with other inorganic metal ions. The ion-selective electrode constructed based on L showed a good performance in the linear concentration range, detection limit, and selectivity coefficients. The electrode exhibited a fast response time (25 s), a detection limit of 5.4×10⁻⁶
mol L-1 and pH independent potential responses across the range of 3.5–7.5. The proposed electrode was then successfully used in determination of Cu2+ ion in waste water samples.
References
1. R. K. Mahajan, T. P. S. Walia and K. Sumanjit, J. Health Allied Sci. 4 (2005) 1. 2. U. Celik and J. Oehlenschlager, Food Control, 18 (2007) 258.
3. J. Koryta and K. Stulik, Ion Selective Electrodes, Cambridge University Press, Cambridge (1983). 4. V. K. Gupta, R. N. Goyal, R. A. Sharma, Anal. Chim. Acta, 647 (2009) 66.
5. F. Faridbod, M. R. Ganjali, R. Dinarvand, and P. Norouzi, Sensors, 8 (2008) 2331.
6. M. R. Ganjali, P. Norouzi, M. Rezapour, F. Faridbod, and M. R. Pourjavid, Sensors, 6 (2006) 1018.
7. V. K. Gupta, A. K. Singh, and B. Gupta, Anal. Chim. Acta, 583 (2007) 340. 8. V. K. Gupta, R. N. Goyal, R. A. Sharma, Int. J. Electrochem. Sci., 6 (2009) 156.
9. M. R. Ganjali, M. Rezapour, M. R. Pourjavid, and S. Haghgoo, Anal. Sci., 20 (2004) 1007. 10. E.Y.Z. Frag, A.M.K. Mohamed, G.G. Mohamed, E.E. Alrahmony, Int. J. Electrochem. Sci., 6
(2011) 3508.
11. M. R. Ganjali, P. Norouzi, F. S. Mirnaghi, S. Riahi and F. Faridbod, IEEE Sensors J., 7 (2007) 1138.
15. H. A. Zamani, G. Rajabzadeh and M. R. Ganjali, J. Brazil. Chem. Soc., 17 (2006) 1297. 16. V. K. Gupta, A. K. Singh and B. Gupta, Anal. Chim. Acta, 575 (2006) 198.
17. M. R. Ganjali, R. Nemati, F. Faridbod, P. Norouzi, F. Darviche, Int. J. Electrochem. Sci. 3 (2008) 1288.
18. R. K. Bera, S. K. Sahoo, S. K. Mittal, and S.K.A. Kumar, Int. J. Electrochem. Sci., 5 (2010) 29. 19. M. R. Ganjali, R. Kiani-Anbouhi, M. Shamsipur, T. Poursaberi, M. Salavati-Niasari, Z. Talebpoui,
M. Emami, Electroanalysis 16 (2004) 1002.
20. H. A. Zamani, M. R. Ganjali, P. Norouzi, and S. Meghdadi, J. Appl. Electrochem., 37 (2007) 853. 21. S. K. Mittal, P. Kumar, S. K. Ashok Kumar, and L. F. Lindoy, Int. J. Electrochem. Sci., 5 (2010)
1984.
22. M. R. Ganjali, T. Poursaberi, F. Basiripour, M. Salavati-Niasari, M. Yousefi, and M. Shamsipur, Fresenius J. Anal. Chem., 370 (2001) 1091.
23. M. R. Ganjali, T. Poursaberi, M. Hosseini, M. Salavati-Niasari, M. Yousefi, and M. Shamsipur, Anal. Sci., 18 (2002) 289.
24. M. Javanbakht, M. R. Ganjali, P. Norouzi, A. Badiei, A. Hasheminasab and M. Abdouss, Electroanalysis, 19 (2007) 1307.
25. M. Javanbakht, A. Badiei, M. R. Ganjali, P. Norouzi, A. Hasheminasab and M. Abdouss, Anal. Chim. Acta, 601 (2007) 172.
26. M. R. Ganjali, H. Ganjali, M. Hosseini, and P. Norouzi, Int. J. Electrochem. Sci., 5 (2010) 965. 27. F. Faridbod, M. R. Ganjali, M. Pirali-Hamedan and P. Norouzi, Int. J. Electrochem. Sci., 5 (2010)
1103.
28. M. R. Ganjali, S. Aghabalazadeh, M. Khoobi, A. Ramazani, A. Foroumadi, A. Shafiee and P. Norouzi, Int. J. Electrochem. Sci., 6 (2011) 52.
29. M. R. Ganjali, S. Aghabalazadeh, M. Rezapour, M. Hosseini and P. Norouzi, Int. J. Electrochem. Sci., 5 (2010) 1743.
30. A. Badri, and P. Pouladsaz, Int. J. Electrochem. Sci., 6 (2011) 3178.
31. M.R. Ganjali, H.A. Zamani, P. Norouzi, M. Adib and M. Accedy, Acta Chim. Slov., 52 (2005) 309.
32. A. Prkic, J. Giljanovic, and M. Bralic, Int. J. Electrochem. Sci., 6 (2011) 5388.
33. M.R. Ganjali, M. Tahami, M. Shamsipur, T. Poursaberi, S. Haghgoo, and M. Hosseini, Electroanalysis, 15 (2003) 1038.
34. A. K. Singh, V. K. Gupta and B. Gupta, Anal. Chim. Acta, 1 (2007) 171.
35. H. A. Zamani, G. Rajabzadeh, M. R. Ganjali and P. Norouzi, Anal. Chim. Acta, 598 (2007) 51. 36. M. R. Ganjali, Z. Memari, F. Faridbod, and P. Norouzi, Int. J. Electrochem. Sci., 3 (2008) 1169. 37. V. K. Gupta, R. Jain, M.K. Pal, Int. J. Electrochem. Sci., 5 (2010) 1164.
38. M. R. Ganjali, A. Rouhollahi, A. R. Mardan, M. Hamzeloo, A. Moghimi, and M. Shamsipur, Michrochim. J., 60 (1998) 122.
39. F. Faridbod, M. R. Ganjali, B. Larijani, E. Nasli-Esfahani, S. Riahi, and P. Norouzi, Int. J. Electrochem. Sci., 5 (2010) 653.
40. E. Y. Z. Frag, A. M.K. Mohamed, G. G. Mohamed, and E. E. Alrahmony, Int. J. Electrochem. Sci., 6 (2011) 350.
41. M. R. Ganjali, S. Rasoolipour, M. Rezapour, P. Norouzi, A. Tajarodi, Y. Hanifehpour, Electroanalysis, 17 (2005) 1534.
42. M. H. Fekri, H. Khanmohammadi, M. Darvishpour, Int. J. Electrochem. Sci., 6 (2011) 1679. 43. A. J. Hamdan, Int. J. Eelctrochem. Sci., 5 (2010) 215.
44. M. R. Ganjali, P. Norouzi, M. Adib, A. Ahmadalinezhad, Anal. Lett., 39 (2006) 1075.
45. H. A. Zamani, M. R. Ganjali, P. Norouzi, A. Tadjarodi, and E. Shahsavani, Mater. Sci. Eng. C, 28 (2008) 1489.
48. A. Prkic, J. Giljanovic, and M. Bralic, Int. J. Electrochem. Sci., 6 (2011) 5388.
49. M. R. Ganjali, M. Emami, M. Rezapour, M. Shamsipur, B. Maddah, M. Salavati-Niasari, M. Hosseini, and Z. Talebpour, Anal. Chim. Acta, 495 (2003) 51.
50. M. R. Ganjali, J. Ravanshad, M. Hosseini, M. Salavati-Niasari, M. R. Pourjavid, and M. R. Baezzat, Electroanalysis, 16 (2004) 1771.
51. M. Shamsipur, M. Yousefi, M. Hosseini, M. R. Ganjali, Anal. Lett., 34 (2001) 2249.
52. M. R. Ganjali, M. Rahimi-Nasrabadi, B. Maddah, A. Moghimi, S. Borhany, Anal. Sci., 20 (2004) 1427.
53. F. Faridbod, M. R. Ganjali, B. Larijani, P. Norouzi, S. Riahi, F. S. Mirnaghi, Sensors 7 (2007) 3119.
54. H. A. Zamani, F. Malekzadegan, and M. R. Ganjali, Anal. Chim. Acta, 555 (2006) 336. 55. H. A. Zamani, M. R. Ganjali, and M. Adib, Sensor Lett., 4 (2006) 345.
56. M. R. Ganjali, P. Norouzi, F. Faridbod, S. Riahi, J. Ravanshad, J. Tashkhourian, M. Salavati-Niasari, and M. Javaheri, IEEE Sensors J., 7 (2007) 544.
57. S. Riahi, M. R. Ganjali, P. Norouzi, and F. Jafari, Sens. Actuators B, 132 (2008) 13.
58. M. R. Ganjali, H. A. Zamani, P. Norouzi, M. Adib, M. Rezapour, and M. Aceedy, Bull. Korean Chem. Soc., 26 (2005) 579.
59. P. R. Buck, and E. Lindneri, Pure Appl. Chem. 66 (1994) 2527.