This is a repository copy of An Experimental and Master Equation Study of the Kinetics of OH/D + SO : The Limiting High Pressure Rate Coefficients₂ .
White Rose Research Online URL for this paper: http://eprints.whiterose.ac.uk/114546/
Version: Accepted Version
Article:
Blitz, MA orcid.org/0000-0001-6710-4021, Salter, RJ, Heard, DE
orcid.org/0000-0002-0357-6238 et al. (1 more author) (2017) An Experimental and Master Equation Study of the Kinetics of OH/D + SO : The Limiting High Pressure Rate ₂
Coefficients. Journal of Physical Chemistry A, 121 (17). pp. 3184-3191. ISSN 1089-5639 https://doi.org/10.1021/acs.jpca.7b01295
(c) 2017, American Chemical Society. This document is the Accepted Manuscript version of a Published Work that appeared in final form in the Journal of Physical Chemistry A, copyright (c) American Chemical Society after peer review and technical editing by the publisher. To access the final edited and published work see:
https://doi.org/10.1021/acs.jpca.7b01295
[email protected] https://eprints.whiterose.ac.uk/
Reuse
Unless indicated otherwise, fulltext items are protected by copyright with all rights reserved. The copyright exception in section 29 of the Copyright, Designs and Patents Act 1988 allows the making of a single copy solely for the purpose of non-commercial research or private study within the limits of fair dealing. The publisher or other rights-holder may allow further reproduction and re-use of this version - refer to the White Rose Research Online record for this item. Where records identify the publisher as the copyright holder, users can verify any specific terms of use on the publisher’s website.
Takedown
If you consider content in White Rose Research Online to be in breach of UK law, please notify us by
An Experimental and Master Equation Study of the Kinetics of
OH/OD + SO
2: the Limiting High Pressure Rate Coefficients
Mark A. Blitz,a,b* Robert J. Salter,a,c Dwayne E. Heard a,b and Paul W. Seakins a,b
a School of Chemistry, University of Leeds, Leeds, LS2 9JT, UK
b National Centre for Atmospheric Science, University of Leeds, Leeds, LS2 9JT, UK
c Now at Deloitee MCS, 3 Rivergate, Temple Quay, Bristol, BR1 6GD, UK
Abstract
The kinetics of the reaction OH/OD + SO2 have been studied using a laser flash
photolysis / laser induced fluorescence technique. Evidence for two-photon photolysis
of SO2 at 248 nm is presented and quantified, and which appears to have been evident
to some extent in most previous photolysis studies, potentially leading to values for the
rate coefficient, k1, that are too large. Thekinetics of the reaction OH(v=0) +SO2(T =
295 K, p = 25 – 300 Torr) were measured under conditions where SO2 photolysis was
taken into account. These results, together with literature data, were modelled using a
master equation analysis. This analysis highlighted problems with the literature data:
the rate coefficients derived from flash photolysis data were generally too high and
from the flow tube data too low. Our best estimate of the high-pressure limiting rate
coefficient, k1 was obtained from selected data and gives a value of (7.8 ± 2.2) × 10
-13 cm3 molecule-1 s-1, which is lower than that recommended in the literature. A
parameterized form of k1([N2] ,T) is provided. The OD(v=0) +SO2 (T = 295 K, p = 25
– 300 Torr) data are reported for the first time and master equation analysis reinforces
1. Introduction
.
In our companion paper the limiting high-pressure rate coefficient, k1∞ for the reaction:
OH + SO2 (+ M) HOSO2 (+ M)
R1
was investigated by measuring the removal rate coefficient of vibrationally excited
OH/OD in the presence of SO2 as a function of temperature. This study revealed that
the removal rate coefficient increased with vibrational level, which implies that the
OH/OD(v = 1) + SO2 removal rate coefficient, previously used as an estimate of the
high pressure limit, k1∞1 via the proxy method,2 is an overestimation. Further analysis
of these data was able to identify k1∞, albeit with significant error, (7.2 ± 3.3) × 10-13
cm3 molecule-1 s-1. This value for k1∞is smaller than the recommended literature values
from IUPAC and JPL, (2.012..00) and (1.6 ± 0.4) × 10-12 cm3 molecule-1 s-1, respectively.
3-4 In this paper we report data on k
1 as a function of pressure, coupled with an
extrapolation to the high pressure limit using a master equation analysis, which
reinforces our lower value for k1∞ and highlights the problems in the literature data.
Reaction R1 is pressure dependent and is in its falloff regime at atmospheric
pressure and below. The kinetics of R1 in this pressure regime have been extensively
studied,5-8 and Rice-Ramsperger-Kassel-Markus (RRKM) modelling of these data has
been used to recommend the limiting high-pressure rate coefficient: Wine et al.
recommended a value for k1∞between 260 and 420 K equal to 1.3 × 10⁻¹² (T/300 K)-0.7
cm3 molecule-1 s-1 and Cobos and Troe 9 recommended k1∞= 2.7 × 10⁻¹² exp(-80K/T)
cm3 molecule-1 s-1 (k1∞× 10-12 cm3 molecule-1 s-1). More recently Fulle et
al. 10 measured k1 over an extended pressure range up to 96 bar and their estimate of
activation energy was observed, contrary to the recommendations. The evaluations by
IUPAC 3 and JPL 4 recommended the values: k1∞and 1.6 × 10⁻¹² cm3
molecule-1 s-1 and k
1(1 bar N2, 298 K) = 8.9 and 9.5 × 10⁻¹³ cm3 molecule-1 s-1,
respectively.
In this study the two-photon 248 nm photolysis of SO2 is quantified, and it is
suggested that previous studies have overestimated k1∞as details of this effect (single
or two-photon photolysis) were not taken into account. OH(v =0) + SO2 rate coefficients
were determined under conditions that took two-photon SO2 photolysis into account,
and then master equation analysis (using the Master Equation Solver for Multi
Energy-well Reactions (MESMER) code 11) was used to fit these data and selected literature
data in order to determine k1∞OD(v =0) + SO2 rate coefficients were also determined
and these represent the first such measurements, but no MESMER analysis has been
performed with this data. Both the current and the companion paper returned a
consistent value for k1∞, which is significantly lower than the currently recommended
value.
2. Experimental
Photolysis / Laser Induced Fluorescence
The experimental methods are similar to those described previously,1,12 thus only the
salient features are highlighted. The apparatus used to perform the OH/OD(v = 0) + SO2
study was similar to that used in the vibrationally excited state OH/OD(v = 1,2,3)
kinetics study in the companion paper. An excimer laser (Lambda Physik, LPX 210)
was used as the photolysis laser, with the pulse energy controlled using a combination
(JMAX11, Molectron) was used to measure the output of the excimer laser. The ground
state hydroxyl (OH/OD) radical was monitored by on-resonant laser induced
fluorescence (LIF) at ~ 308 nm using the doubled output from an excimer laser
(Lambda Physik, LPX 100) pumped dye laser (Lambda Physik, FL2002), which
operated with the dye Rhodamine B. The subsequent fluorescence (A2+ 2i) was
passed through a 308 nm interference filter and was detected using a photomultiplier
(Electron Tubes 9813); the resultant signal was integrated and digitized on a LeCroy
(Waverunner LT372) oscilloscope before being transferred for storage on a PC. Over
the region 280-290 nm, the laser excitation wavelength conventionally used for
off-resonant OH detection, fluorescence from other species was detected. Hence,
ground-state OH/OD was detected resonantly at 308 nm; although there was significant
scattered probe laser light, it did not significantly affect the later time hydroxyl
fluorescence signal. A LabVIEW program controlled the delay generator which
scanned the time delay between the photolysis and probe laser, and recorded the
OH/OD signal via the oscilloscope. Typically, the time delays were scanned over 200
- 400 points, with each point being the average of up to ten samples. The lasers were
fired at a pulse repetition frequency of 5 Hz.
The gases were introduced into the reaction cell through a mixing manifold.
Control of the gas flow was regulated by calibrated mass flow controllers. After the
mixing manifold, the gases entered a ten-way cross stainless steel reaction cell. The
pressure in the cell was regulated by throttling the exit valve of the cell and monitored
via a capacitance manometer. The total flow was greater than 10 sccm per Torr total
SO2 and (CH3)3COOH (Sigma Aldrich, 99.9% and 70%, respectively) were
purified by first degassing and then diluted in He. H2 / D2 (Air Products, 99.999%) and
He (BOC, CP grade 99.999%) were used directly from the cylinder.
Master Equation Analysis
Master equation calculations have been carried out using the program MESMER
(Master Equation Solver for Multi Energy-well Reactions),11 where the required input
parameters for the stationary points were obtained from a recent high level ab initio
calculation on HOSO2.13 The application of the master equation to reactions in the gas
phase has been extensively discussed elsewhere.11, 14-17 Here, the main points are
summarized and the manipulations required to accommodate second order systems are
discussed.
The system is set up by dividing the energy of HOSO2 into grains, and the time
evolution of the system is then obtained by solving the energy grained master equation:
dt d
p = Mp (E1)
where p is the population vector containing the population, n(E), of energy grains from
HOSO2 and M is the matrix that describes collisional energy transfer between grains
and reaction from grains, and also includes a bimolecular source term in order to
describe formation of HOSO2 via bimolecular reaction. Eqn (E1) represents a set of
p = UetU-1p(0) (E2)
where p(0) contains the initial conditions for each grain, U is an eigenvector matrix
obtained from the diagonalization of M, and is the diagonal matrix of corresponding
eigenvalues, where the smallest eigenvalues are the chemically significant eigenvalues.
Time-dependent concentrations of different species were obtained by summing the
normalized populations from Eqn (E2) over the appropriate grains. The
phenomenological rate coefficients were extracted from the chemically significant
eigenvalues.11
In the MESMER calculation for the OH + SO2 association reaction, the
microcanonical rate coefficients for dissociation of the HOSO2 adduct, k(E), have been
calculated using the pragmatic approach of taking the Inverse Laplace Transform (ILT)
of the pressure limiting rate coefficient, k1∞(T). This has an exact solution when k∞(T)
can be represented by the form:18
) / exp( ) ( 0 RT E T T A T k a n (E3)
In the present work, T0 was set to 298 K and Ea set to 0 kJ mol-1, so the temperature
dependence is wholly controlled via n. A value of n equal to 0.1 was determined over
the temperature range 295 – 800 K in the companion paper. This approach has the
advantage that the parameters defining the high pressure limiting rate coefficient, a
principal target of the present two papers, are determined directly from the MESMER
fit to the experimental data. The vibrational and rotational constants together with the
HOSO2 adduct zero point energy were fixed to the literature,13 and systematic
Lennard-Jones parameters were chosen. In the SI the input parameters for this MESMER
The rates of reaction from OH + SO2 into a particular grain of HOSO2 were
determined by detailed balance.19 An exponential down model, coupled with detailed
balance, was used for the probabilities of collisional energy transfer between the grains,
based on the parameterization <E>down = <E>down,298(T/298 K)m, where <E>down is
the average transferred in a downward direction.20 All of the available data were fitted
to the master equation model, using the minimization of 2:
N i i i i k k 1 2 2 model , exp , 2 / ) ( (E4)
as the criterion of best fit. Here ki,exp is the ith experimental rate coefficient, ki,model is
the model result under the same conditions of T and p, i is the standard deviation of
the experimental rate coefficient and N is the total number of experimental
measurements. The analysis was conducted, as were the experiments, under pseudo first
order conditions ([OH] << [SO2]). The bimolecular forward rate coefficient, kbim was
used in the fits and [SO2] was given a fixed value of 1015 molecule cm-3. The variable
parameters in the fitting process were A, n, <E>down,298. The best available
experimental data (literature values and the values determined here) were all
simultaneously used in a global fit.
3. Results
SO2 + 2hv O(1D) + SO
The two photon dissociation of SO2 (P1) involves initial promotion of the SO2(X)
SO2 from this B-state to a dissociative state, which rapidly leads to products.
Effenhauser et al.21 studied this process at 248 nm using photofragment translational
spectroscopy and observed 9 distinct processes:
SO2 + 2 h248 nm SO (X3 -), (a1 ), (b1 +) + O (1D), (3P) (P1a)
O2 (X3 -g) + S (3P) (P1b)
O2 (X3 -g) + S (1D) (P1c)
O2 (a1 g) + S (1D) (P1d)
but were unable to quantify the contributions from each channel.
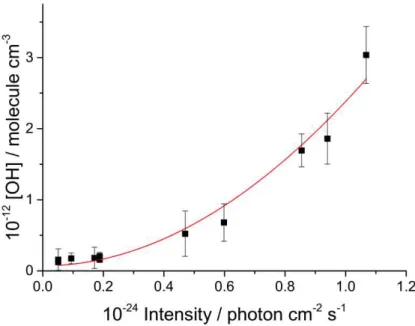
Figure 1. OH production from P1 and R2 as a function of excimer laser intensity. The duration of the excimer laser pulse was 20 ns. The red line is a quadratic function fitted to the data.
The cross-section for P1a to produce O(1D) was determined by measuring the OH signal
as a function of laser energy:
O(1D) + H2 OH (v + H (R2)
where [H2] >> [SO2] to ensure O(1D) is converted to OH, i.e [O(1D)]0 = [OH].22 OH(v
primarily via reaction with SO2 at ~25 Torr total pressure. Hence, the total amount of
OH in the system is readily determined from the OH(v = 0) time trace. Figure 1 shows
that the [OH] concentration increases with a quadratic dependence on laser fluence,
consistent with a two photon process. In our previous paper on two photon dissociation
of benzene,23 we showed this quadratic dependence can be used to assign the second
photon absorption cross-section, if the first photon absorption cross-section and the
absolute radical concentration are known. The first absorption cross-section in SO2 at
248 nm, , is 6 × 10-20 cm2 molecule-1 24 and allows the concentration of excited state
SO2, SO2*, to be calculated:
F
]
SO
[
*]
[SO
2 0
2 0
1 (E5)where F is the laser fluence. The second photon absorption from the SO2* state leads
to OH via, P1a and R2, with a concentration given by:
F
*]
SO
[
]
[OH
0
2 0
2 (E6)where 2 is the second photon absorption cross-section leading to the formation of
O(1D), P1a. Equations 5 and 6 lead to the OH concentration given by:
2 2 1 0 2 0 [SO ]
]
[OH
F (E7)The OH concentration (= [O(1D)]) can be assigned by comparison to a known OH
precursor. In the present study the absolute OH concentration was assigned by
comparison to the OH signal from 248 nm photolysis of known concentrations of
t-(CH3)3COOH:25
t-(CH3)3COOH + h248 nm OH(v=0) + co-products (P2)
Fitting equation E7 to the data in Figure 1 gives 2 = (5.5 ± 2.0) × 10-18 cm2 molecule-1.
This cross-section is smaller than the total absorption cross-section as it is only for the
more readily than the first, and consequently a significant fraction of SO2 absorption
results in photodissociation. In fact, probing OH(v = 0) at 282 nm was not possible as
the OH fluorescence signal was overwhelmed by signal from other species, presumably
from SO. In addition, a small signal, ~ 100 s lifetime, was observed from photolysis
of SO2 alone and was assigned to emission from excited SO. This background signal
was accounted for by recording a kinetic trace without the probe.
OH/OD(v=0) + SO2
Some OH (v =0) + SO2 experiments were carried out using the precursor
t-(CH3)3COOH.25 The OH from this precursor was observed to depend linearly on laser
photolysis energy, and via its 248 nm absorption cross-section, was used to calibrate
the OH concentration in the SO2 two photon photolysis experiments. To counteract the
problem of reaction between OH and photoproducts from SO2 photolysis while
studying OH(v=0) + SO2, it was arranged that the photolysis laser energy was adjusted,
via wire mesh attenuators, so that the amount of SO2 photolysis products were constant
as the SO2 concentration was varied. Hence, the reaction between OH and
photoproducts was present in the intercept of the bimolecular plots and not in the slope.
A few OH(v=0) experiments and all the OD (v=0) were carried out using the
same methods used to generate the vibrationally excited state, i.e. photolysis of
SO2/H2/D2, where the photolysis energy was again suitably adjusted to ensure that the
photolysis products were constant as the SO2 concentration was varied. It is
acknowledged that this photolysis laser adjustment, see Figure 1, was only crudely
achieved by mesh filters. It is estimated the contribution from OH + SO2 photo-products
Figure 2. OH(v=0) + SO2 (2.35 × 10¹⁶ molecule cm-3 ) at 50 Torr total pressure, helium. t-(CH3)3COOH was used to generate ground-state hydroxyl radical. Analysis of these data (E8) yields kobs = (3643 ± 63) s-1, where the error is statistical at the 1 level. The red line is the best fit to the data.
The pressure and temperature dependence of the reaction OH/OD(v=0) + SO2
was studied via experiments using helium buffer gas. Photolysis of t-(CH3)3COOH only
produced OH in its ground vibrational state, so that the decay of [OH(v=0)] in the
presence of SO2 was observed to obey single exponential behaviour (see Figure 2):
OH(
0)
OH(
0)
0exp(kobst) B (E8)where kobs is the pseudo-first-order rate coefficient and is equal to k1[SO2] + k'other; k'other
should be reasonably constant for all experiments as the photolysis energy was suitably
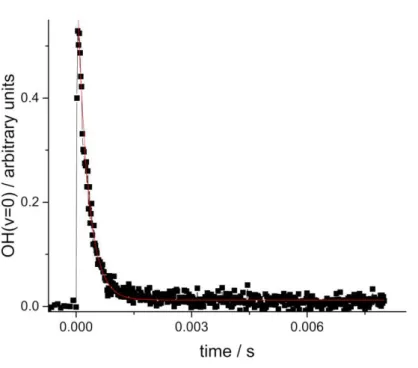
Figure 3. OD(v=0) from the photolysis of SO2 (6.05 × 1015 cm-3) / D2 at a total pressure of 100 Torr, helium buffer. At early times there is growth due to relaxation from higher vibrational states, OD(v>0). Soon after the maximum in the OD signal the decay is described by a single exponential (blue curve), which via Eqn (E8) gives kobs = (2107 ± 60) s-1. The red line is a biexponential fit to the data and gives kobs = (2232 ± 69) s-1.
parameter that accounts for the small amount of background fluorescence from
non-OH species, see Figure 2. The reaction OD(v=0) + SO2 was studied using the photolysis
of SO2/D2 as the radical source. While this method produced vibrationally excited OD
radicals, the analysis of OD(v=0) data was straightforward as the vibrationally excited
radicals relax much faster than OD(v=0) is removed, see companion paper. This can be
seen in Figure 3, where, after only a short time, relaxation is complete and then the data
are described by a single exponential, (E8), yielding kobs. In Figure 3, a biexponential
fit is also shown – see companion paper for this equation and how it accounts for
the biexponential and exponential fits converge. A few experiments on OH(v=0) were
also carried out using photolysis of SO2/H2 as the radical source, and produced similar
results to using t-butylhydroperoxide photolysis. Plots of kobs versus [SO2] were fitted
to a straight-line where the slope is equal to the bimolecular rate coefficient, k1. An
example of such a plot is given in Figure 4. The bimolecular rate coefficients were then
determined over a range of pressures: 25 - 400 Torr and 295 K, see Figure 5. All the
results are summarized in Tables 1 (OH) and 2 (OD).
Figure 5. Literature rate coefficients, k1, for the reaction OH + SO2, at room temperature, where helium is the bath gas. Our results for OD + SO2 are also included. The solid line is a master equation simulation for OH + SO2 using helium and the parameters from the fit to the k1[M] data in Figure 7, the most reliable data set, see text for details.
In general our values for k1 are within a factor of ~2 of Wine et al.8, but as can
be seen from Figure 5 (note that this is log-log plot), the low pressure flow tube data
from Lee et al., Leu and Martin et al.5-6, 26 are in serious disagreement based on
extrapolation from the high-pressure flash photolysis data. It is noted that all the
low-pressure flow tube data are in good internal agreement.5, 26-29 This discrepancy between
the low and high pressure results is further discussed below when full master equation
calculations are applied to the data to determine the best estimate for k1∞(T). Also from
Figure 5, it can be seen that the rate coefficients from Fulle et al.10 increase almost
molecule-1 s-1 was assigned. This result is wholly incompatible with the master equation
analysis - see below - where a much lowerk1∞ is determined from the experimental
data. It is possible that Fulle et al. had not considered SO2 photolysis - see above - and
hence did not account for additional OH removal by radical-radical reactions and
therefore overestimated k1.
5. Discussion
Interpretation of the results for OH(v=0) via master equation analysis
As discussed in the introduction, there is an inconsistency in the experimental values
for k1 for OH(v=0) + SO2 as a function of pressure and temperature, which means there
is a substantial uncertainty in the value of k1 used to model gas-phase SO2 oxidation in
the atmosphere. The analysis of the v = 1, 2, 3 kinetics in the companion paper indicate
a lower value for k1∞(k1∞=(7.2 ± 3.3) × 10-13 cm3 molecule-1 s-1)than is currently
recommended in the literature, ((2.0 12..00
) 3 or (1.6 ± 0.4) 4 × 10-12 cm3 molecule-1 s-1). To
examine k1 in more detail, the measured rate coefficient for OH(v=0) + SO2 from this
study, together with those from the literature, have been used in a master equation
analysis to determine the most consistent values for the system, which should, in turn,
be consistent with the vibrationally excited state data reported in the companion paper.
Using the in-built Marquardt algorithm in MESMER, data fitting to the present
dataset and the literature has been performed, where the adjustable parameters are A, n
multiple gases, with differing values of <Edown> so that kinetic data with different
buffer gases (helium, argon, nitrogen and SF6) have been simultaneously fitted. Figure
5 shows a master equation simulation for helium using the parameters from the fit to
the k1[M] data in Figure 7, the most reliable data, see below. This simulation indicates
the experimental data are within a factor of two of each other, except for the high
pressure values from Fulle et al.,10 and the low-pressure flow tube data. From this
analysis alone it is evident that the low-pressure flow tube data and the high-pressure
flash photolysis data are incompatible with the master equation model of k1[M]. Various
subsets of kinetic data have been analysed using MESMER in order to check for
consistency and to quantify the discrepancy between the data subsets. In the SI the
MESMER input file, which contains all the kinetic data considered in this analysis, is
provided.
The high-pressure flash photolysis experiments can, potentially, result in
photolysis of SO2 to form radicals – see above – which are reactive towards OH and
hence enhance the measured rate coefficients. The low-pressure flow tube experiments
do not have any SO2 photolysis problems, but do generate OH from titration reactions,
either H + NO2/O3, so that there is the possibility that NO2 / O3 can re-generate OH,
which leads to lower rate coefficients.
To examine potential problems with the higher pressure (5 – 700 Torr) flash
photolysis data, the literature and the present results were analysed and a plot of the
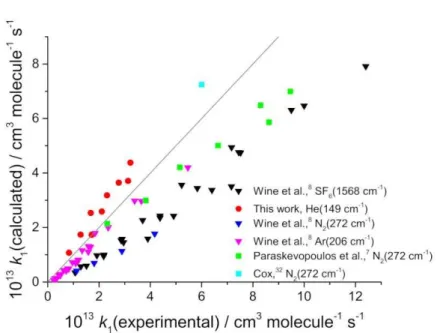
measured and calculated k1 is shown in Figure 6. From this figure it is evident that the
fit to the data is scattered (a good example of such analysis, where from many studies
found in reference 30), especially the SF6 data from Wine et al.8 that indicate the
measured rate coefficients are significantly larger than the calculated. In this calculation
A, n and <E>down were floated freely, where each buffer gas had its own independent
<E>down. The result from this fitting indicates that over this pressure range k1∞ is
defined but fits for each buffer gas lead to different values for k1∞, hence the different
slopes for each gas in Figure 6. If k1∞were not defined then <E>down for each gas
could be adjusted to obtain a near perfect fit, but k1∞is defined and no better fit to the
data in Figure 6 is possible.
Figure 6. A plot of k1(calculated) from the master equation analysis of flash photolysis data versus k1(experimental). It can be seen that the literature k1 experimental data are generally higher than the calculated value, i.e. below the line with a slope equal to one. The fitted energy transfer parameters, <E>down, are given in brackets after the bath gas.
Removal of the SF6, N2 and He data from Wine et al.8 together with the data from
Paraskevopoulos et al. 7 yields a good fit as evidenced in Figure 7. The reason why the
fact that SF6 has small, but significant, absorption cross-sections in the VUV region 30
where H2O was photolysed to produce OH, which leads to additional OH chemistry.
However, the reason why only the Ar data from Wine et al.8 can be fitted well is
unclear. Also included in Figure 7 are the data from Cox, 31 where k1 was determined
from the continuous lamp photolysis of HNO2 in the presence of SO2. The low intensity
of the lamp ensures that there is no SO2 photolysis in the system, which is not the case
in all the laser flash photolysis experiments. The fit to the data in Figure 7 returned k1∞
(295 K) = (7.8 ± 2.2) × 10-13 cm3 molecule-1 s-1, where the temperature dependence was
fixed and equal to (T/298)0.1; this value of n is from our OH/OD(v=1,2,3)+SO2 data,
see the companion paper, and is required as most of the temperature-dependent data
have been removed from the analysis. This is our best determination of k1∞.
The OD + SO2 data, see Figure 5 and Table 2, were also fitted using MESMER.
The input parameters are similar to OH + SO2 except for three vibrations and the zero
point energy adjustment of the well-depth; input parameters are given in the SI. An
excellent fit was obtained, similar to Figure 7, and yielded the parameters: k1,D∞(295 K)
= (8.7 ± 2.6) × 10-13 cm3 molecule-1 s-1 and <E>down = 197 ± 48 cm-1. As the kinetic
isotope in reaction R1 is reasonably expected to be close to zero, k1,D∞ and k1∞ should
be the same. Within error, this is the case and hence provides further evidence of our
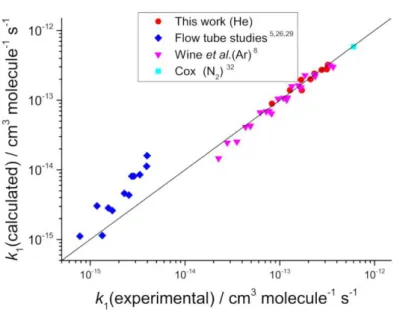
Figure 7. A plot of k1(calculated) versus k1(experimental) from the MESMER fit to selected flash photolysis data, see text. The slope is equal to 0.97 and the returned value k1∞(295 K) = (7.8 ± 2.2) × 10-13 cm3 molecule-1 s-1, 2. The fitted energy transfer parameters, <E>down, are given in brackets after the bath gas.
The low-pressure flow tube data have been examined by combining our dataset from
Figure 7, with the flow tube data (helium bath gas) from Leu and Lee et al.5, 26 and fitted
by MESMER, where k1∞ was fixed to (7.8 ± 2.2) × 10-13 cm3 molecule-1 s-1 and the
Figure 8. A log-log plot of k1(calculated) versus k1(experimental) from the MESMER analysis of the data in Figure 7 and the flow tube data from 5, 26, 29 where helium is the buffer gas and its <E>down parameter is fixed to 165 cm-1. The black line is a slope of 1.0.
The quality of the fit is seen in Figure 8 via a log-log plot, where it can be seen
that the low pressure data are poorly fitted with experimental values up to a factor of 3
below the calculated values. A possible explanation of this observation is that the
products of the reaction recycle back to OH and hence lower the observed k1. Some
evidence to support this explanation is the observation by Lee et al.5 of a factor two
lower rate coefficient when O2 was the buffer gas compared to nitrogen. In general, the
buffer gas efficiency of O2 and N2 are similar. In the study by Leu, 26 attempts to observe
products, HOSO2, SO3 and H2SO4, via mass spectrometry were unsuccessful, and it
was suggested that “these molecules may condense and/or react with H2O on the
surface of the flow tube.”
Overall, it is concluded that the data shown in Figure 7 yield the best kinetic
parameters on the OH + SO2 reaction and k1∞(295 K) = (7.8 ± 2.2) × 10-13 cm3 molecule
-1 s-1. In general, k
has not been taken into account and the flow tube data yields k1 that are too small,
possibly arising from OH recycling. Therefore only a limited dataset has been used to
determine k1(p,T). k1∞(295 K) is reasonably determined but its temperature dependence
is much more uncertain. Hence the temperature dependence has been fixed to (T/298)0.1,
determined from our OH(v=1,2,3)+SO2 data, which was studied between 295 – 810 K,
see companion paper. The current IUPAC and JPL recommended values for k1∞ are
(2.012..00) and (1.6 ± 0.4) × 10-12 cm3 molecule-1 s-1, which are over a factor two larger
than the current determination. But this recommendation is influenced by data that are
affected by SO2 photolysis, see above, and our previous rate coefficient determination
for OH(v=1)+SO2, which was assumed to be a proxy for k1∞ but is actually an
overestimation as it did not account for direct energy transfer, see the companion paper.
Using our optimum parameterisation of k1∞(T) of (7.8 ± 2.2) × 10-13 (T/298)0.1 cm3
molecule-1 s-1, MESMER has been used to generate a dataset that has been
parameterised using a Troe formalism,32 using the same representation in a previous
paper on CH3O2 + NO2.32 This dataset has been produced using an estimated energy
transfer parameter for nitrogen (N2 and O2 are usually similar) equal to
<Edown>(N2)/cm-1 = 600 × (T/298)0.3; the value from data fitting to Figure 7 is based
only on one nitrogen data point from Cox, so has a very large error bar. These
MESMER simulations have been carried out over the temperature range 200 – 600 K
and Table 3 gives the derived Troe parameters for nitrogen. The results are shown in
Figure 9. Troe fit (cross) to the dataset (symbols) generated from the MESMER
simulation of
k
1(T) = (7.8 ± 2.2) × 10-13 (T/298)0.1 cm3 molecule-1 s-1 and <Edown>(N2)/ cm-1 = 600 × (T/298)0.3 over the temperature and pressure range 200 – 600 K and 1015 - 1022 molecule cm-3.
From Figure 9 it can be seen that these Troe fits are an adequate description of
the master equation output. Currently, the IUPAC 3 and JPL 4 recommended rate
coefficient at 298 K and 1 bar N2 are 8.9 and 9.5 × 10⁻¹³ cm3 molecule-1 s-1 , respectively,
while the present study recommends a rate coefficient of 5.8 × 10⁻¹³ cm3 molecule-1 s
-1. This difference translates itself in both the low and high-pressure limiting rate
coefficients: k1∞ = 7.8 × 10⁻¹³ cm3 molecule-1 s-1 (present) versus k1∞ = 2.0 and 1.6 × 10
-12 cm3 molecule-1 s-1 (IUPAC and JPL); k
10(N2,T) = 1.10×10⁻³⁰ × (T/298)-3.62 cm6
molecule-2 s-1 (present) versus k
10(N2,T) = 2.5× (T/300)-2.6 and 3.3 × 10⁻³¹ × (T/298)-4.3
cm6 molecule-2 s-1 (IUPAC and JPL). Both k1∞ and k10(N2) from the current study are
markedly different to the recommended IUPAC and JPL values. The temperature
based on a tuned master equation model the IUPAC and JPL values are based on fits to
the literature.
6. Conclusions and summary
(i) The rate coefficients for the removal OH(v=0) by SO2, k1, has been studied using
laser flash photolysis coupled with laser induced fluorescence. It is evident that
the 248 nm excimer laser fluences used induced two photon dissociation of SO2
to O(1D). The second photon absorption to give O(1D) ,
2, has been determined
(2 = (5.5 ± 2.0) × 10-18 cm2 molecule-1). Other photoproducts from this two
photon photolysis contributed to the decay of OH; this interference was
minimised by reducing the laser energy as [SO2] was increased to generate a
constant photolysis yield of all species.
(ii) Experiments were carried out where the photolysis energy of the laser was
adjusted to keep the amount of SO2 photolysis constant and hence determine a
more accurate value of k1.
(iii) Master equation analysis using MESMER has been used to fit the current dataset
and that from the literature. From this it is apparent that much of the flash
photolysis data are contaminated from SO2 photolysis, and results in k1 values that
are too large. A much reduced dataset was used in the determination k1∞. This k1∞
value was reinforced from the MESMER analysis of the OD + SO2 data.
(iv) The master equation model of k1(p,T) was used to fit to the low pressure flow tube
much smaller than the predicted. It is speculated that this results from an
uncharacterised OH recycling mechanism.
(v) Comparison of k1 from this study and the currently recommended values from
IUPAC and JPL shows poor agreement: our value for k1∞ is over a factor of two
smaller and our value for k10 is over a factor of three larger.
(vi) Using parameters from fitting to our refined dataset, the output from a master
equation simulation for nitrogen buffer gas has been parameterized using a
Troe-formalism to provide an analytical description of k1 over the range T = 200 – 600
K and [N2] = 1015– 1021 molecule cm-3. At 298 K our current estimate and the
recommended values from IUPAC and JPL for k1(1 Bar N2) is equal to 5.8 and
(8.9 and 9.5) × 10-13 cm3 molecule-1 s-1, respectively.
Acknowledgements
We thank Mike Pilling for providing helpful discussions and proof reading this
manuscript, and Diogo Medeiros for performing calculations on OD + SO2. Also, we
are grateful to NERC (NE/K005820/1) and EPSRC (GR/T28560/01) for funding.
Supporting Information Available
The supporting information contains the input file for the MESMER master equation
References
1. Blitz, M. A.; Hughes, K. J.; Pilling, M. J. Determination of the High-Pressure Limiting Rate Coefficient and the Enthalpy of Reaction for OH + SO2. J. Phys. Chem. A 2003, 107, 1971-1978.
2. Jaffer, D. H.; Smith, I. W. M. Time-Resolved Measurements on the Relaxation of OH(v = 1) by NO, NO2 AND O2. Faraday Disc. 1979, 67, 212-220.
3. Atkinson, R.; Baulch, D. L.; Cox, R. A.; Crowley, J. N.; Hampson, R. F.; Hynes, R. G.; Jenkin, M. E.; Rossi, M. J.; Troe, J. Evaluated Kinetic and Photochemical Data for Atmospheric Chemistry: Volume I - Gas Phase Reactions of Ox, HOx, NOx and SOx Species. Atmos. Chem. Phys. 2004, 4, 1461-1738.
4. Burkholder, J. B.; Sander, S. P.; Abbatt, J.; Barker, J. R.; Huie, R. E.; Kolb, C. E.; Kurylo, M. J.; Orkin, V. L.; Wilmouth, D. M.; Wine, P. H. "Chemical Kinetics and Photochemical Data for Use in Atmospheric Studies, Evaluation No. 18," JPL Publication 15-10, Jet Propulsion Laboratory, Pasadena. 2015 http://jpldataeval.jpl.nasa.gov.
5. Lee, Y. Y.; Kao, W. C.; Lee, Y. P. Kinetics of the Reaction Hydroxyl + Sulfur Dioxide in Helium, Nitrogen, and Oxygen at Low Pressure. J. Phys. Chem. 1990, 94, 4535-4540.
6. Martin, D.; Jourdain, J. L.; Laverdet, G.; Le Bras, G. Kinetic Studies of Oxidation Reactions of Sulfur Compounds: Reaction Sulfur Dioxide + Hydroxyl in the presence of Oxygen and Reaction Iodine Oxide (IO) + DMS; CNRS: 1987; pp 212-217. 7. Paraskevopoulos, G.; Singleton, D. L.; Irwin, R. S. Rates of Hydroxyl Radical Reactions. The Reaction Hydroxyl Radical + Sulfur Dioxide + Molecular Nitrogen. Chem. Phys. Lett. 1983, 100, 83-87.
8. Wine, P. H.; Thompson, R. J.; Ravishankara, A. R.; Semmes, D. H.; Gump, C. A.; Torabi, A.; Nicovich, J. M. Kinetics of the Reaction OH + SO2+ M HOSO2 + M. Temperature and Pressure Dependence in the Fall-Off Region. J. Phys. Chem. 1984, 88, 2095-2104.
9. Cobos, C. J.; Troe, J. Theory of Thermal Unimolecular Reactions at High Pressures. II. Analysis of Experimental Results. J. Chem. Phys. 1985, 83, 1010-1015. 10. Fulle, D.; Hamann, H. F.; Hippler, H. The Pressure and Temperature Dependence of the Recombination Reaction HO + SO2 + M HOSO2 + M. Phys. Chem. Chem. Phys. 1999, 1, 2695-2702.
11. Glowacki, D. R.; Liang, C.-H.; Morley, C.; Pilling, M. J.; Robertson, S. H. MESMER: An Open-Source Master Equation Solver for Multi-Energy Well Reactions. J. Phys. Chem. A 2012, 116, 9545-9560.
12. McKee, K. W.; Blitz, M. A.; Cleary, P. A.; Glowacki, D. R.; Pilling, M. J.; Seakins, P. W.; Wang, L. Experimental and Master Equation Study of the Kinetics of OH + C2H2: Temperature Dependence of the Limiting High Pressure and Pressure Dependent Rate Coefficients. J. Phys. Chem. A 2007, 111, 4043-4055.
13. Klopper, W.; Tew, D. P.; Gonzalez-Garcia, N.; Olzmann, M. Heat of Formation of the HOSO2 Radical from Accurate Quantum Chemical Calculations. J. Chem. Phys. 2008, 129, 114308/1-114308/7.
14. Barker, J. R. Multiple-Well, Multiple-Path Unimolecular Reaction Systems. I. MultiWell Computer Program Suite. Int. J. Chem. Kinet. 2001, 33, 232-245.
16. Miller, J. A.; Klippenstein, S. J. Master Equation Methods in Gas Phase Chemical Kinetics. J. Phys. Chem. A 2006, 110, 10528-10544.
17. Pilling, M. J.; Robertson, S. H. Master Equation Models for Chemical Reactions of Importance in Combustion. Annu. Rev. Phys. Chem. 2003, 54, 245-275.
18. Davies, J. W.; Green, N. J. B.; Pilling, M. J. The Testing of Models for Unimolecular Decomposition via Inverse Laplace Transformation of Experimental Recombination Rate Data. Chem. Phys. Lett. 1986, 126, 373-379.
19. Kenneth A. Holbrook; Michael J. Pilling; Robertson, S. H. Unimolecular Reactions, 2nd Edition. John Wiley & Sons: New York, 1996; p 434
20. Blitz, M. A.; Green, N. J. B.; Shannon, R. J.; Pilling, M. J.; Seakins, P. W.; Western, C. M.; Robertson, S. H. Reanalysis of Rate Data for the Reaction CH3 + CH3
C2H6 Using Revised Cross Sections and a Linearized Second-Order Master Equation. J. Phys. Chem. A 2015, 119, 7668-7682.
21. Effenhauser, C. S.; Felder, P.; Huber, J. R. 2-Photon Dissociation of Sulfur-Dioxide at 248 nm and 308 nm. Chem. Phys. 1990, 142, 311-320.
22. Aker, P. M.; Sloan, J. J. The Initial Product Vibrational-Energy Distribution in the Reaction between O(1D) and H2. J. Chem. Phys. 1986, 85, 1412-1417.
23. Kovacs, T.; Blitz, M. A.; Seakins, P. W.; Pilling, M. J. H atom Formation from Benzene and Toluene Photoexcitation at 248 nm. J. Chem. Phys. 2009, 131, 204304/1-204304/12.
24. Hermans, C.; Vandaele, A. C.; Fally, S. Fourier Transform Measurements of SO2 Absorption Cross Sections. J. Quant. Spectrosc. Radiat. Transfer 2009, 110, 756-765.
25. Baasandorj, M.; Papanastasiou, D. K.; Talukdar, R. K.; Hasson, A. S.; Burkholder, J. B. (CH3)3COOH (tert-Butyl Hydroperoxide): OH Reaction Rate Coefficients between 206 and 375 K and the OH Photolysis Quantum Yield at 248 nm. Phys. Chem. Chem. Phys. 2010, 12, 12101-12111.
26. Leu, M. T. Rate Constants for the Reaction of Hydroxyl with Sulfur Dioxide at Low Pressure. J. Phys. Chem. 1982, 86, 4558-62.
27. Castleman, A. W., Jr.; Tang, I. N. Kinetics of the Association Reaction of Sulfur Dioxide with the Hydroxyl Radical. J. Photochem. 1977, 6, 349-354.
28. Harris, G. W.; Wayne, R. P. Reaction of Hydroxyl Radicals with Nitric Oxide, Nitrogen Dioxide, and Sulfur Dioxide. J. Chem. Soc., Faraday Trans. 1 1975, 71, 610-617.
29. Martin, D.; Jourdain, J. L.; G., L. B. Discharge Flow Measurements of the Rate Constants for the Reaction OH + SO2 + He and HOSO2 + O2 in Relation with the Atmospheric Oxidation of Sulfur Dioxide. J. Phys. Chem. 1986, 90, 4143-4147. 30. Pradayrol, C.; Casanovas, A. M.; Deharo, I.; Guelfucci, J. P.; Casanovas, J. Absorption Coefficients of SF6, SF4, SOF2 and SO2F2 in the Vacuum Ultraviolet. J. De Physique Iii 1996, 6, 603-612.
31. Cox, R. A. Photolysis of Gaseous Nitrous Acid. Technique for Obtaining Kinetic Data on Atmospheric Photooxidation Reactions. Int. J. Chem. Kinet. 1975, 7, 379-398.
32. McKee, K.; Blitz, M. A.; Pilling, M. J. Temperature and Pressure Studies of the Reactions of CH3O2, HO2, and 1,2-C4H9O2 with NO2. J. Phys. Chem. A 2016, 120, 1408-1420.
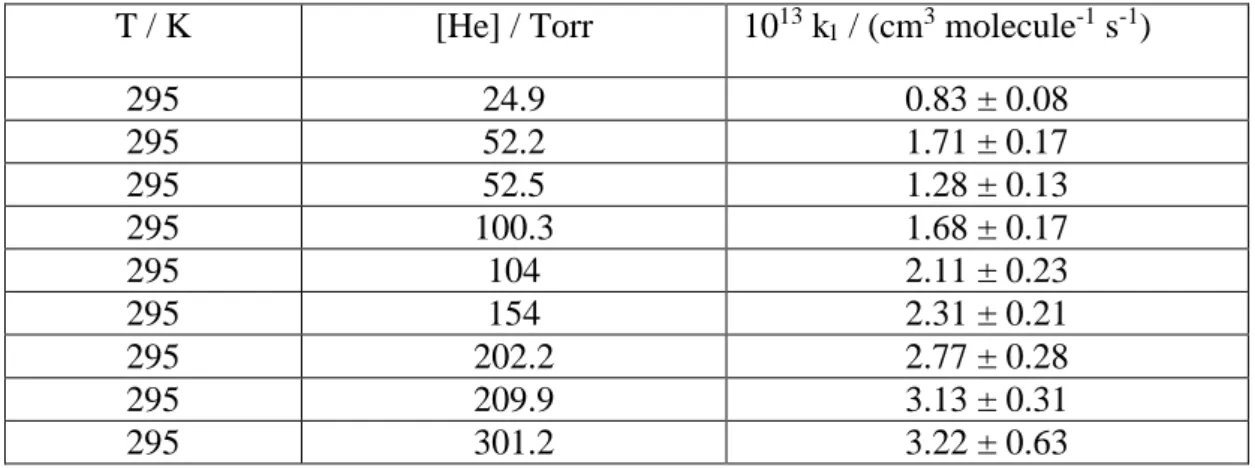
Table 1. Rate coefficients for OH (= 0) + SO2 at various pressures in He. The uncertainties are 1 standard deviations.
T / K [He] / Torr 1013 k
1 / (cm3 molecule-1 s-1)
295 24.9 0.83 ± 0.08
295 52.2 1.71 ± 0.17
295 52.5 1.28 ± 0.13
295 100.3 1.68 ± 0.17
295 104 2.11 ± 0.23
295 154 2.31 ± 0.21
295 202.2 2.77 ± 0.28
295 209.9 3.13 ± 0.31
295 301.2 3.22 ± 0.63
Table 2. Rate coefficients for OD (= 0) + SO2 at various pressures in He. The uncertainties are 1 standard deviations.
T / K [He] / Torr 1013 k1 / (cm3 molecule-1 s-1)
295 27.7 1.17 ± 0.12
295 49.7 1.80 ± 0.18
295 103.1 2.36 ± 0.24
295 154.9 3.13 ± 0.31
295 200.3 3.15 ± 0.32
295 303.4 4.07 ± 0.41
Table 3.
Table 3. OH + SO2 Troe parameters 33 for nitrogen buffer gas.
k1(p,T):
k∞(T) = 7.55×10⁻¹³ × (T/298)0.041 cm3 molecule-1 s-1
k0 (T) = 1.10×10⁻³⁰ × (T/298)-3.62 cm6 molecule-2 s-1
= 0.30
b = 1.30
Figure Captions
Figure 1. OH production from P1 and R2 as a function of excimer laser intensity. The duration of the excimer laser pulse was 20 ns. The red line is a quadratic function fitted to the data.
Figure 2. OH(v=0) + SO2 (2.35 × 10¹⁶ molecule cm-3 ) at 50 Torr total pressure, helium. t-(CH3)3COOH was used to generate ground-state hydroxyl radical. Analysis of these data (E8) yields kobs = (3643 ± 63) s-1, where the error is statistical at the 1 level. The red line is the best fit to the data.
Figure 3. OD(=0) from the photolysis of SO2 (6.05 × 1015 cm-3) / D2 at a total pressure of 100 Torr, helium buffer. At early times there is growth due to relaxation from higher vibrational states, OD(>0). Soon after the maximum in the OD signal the decay is described by a single exponential (blue curve), which via Eqn (E8) gives kobs =2107 ± 60 s-1. The red line is a biexponential fit to the data and yields k
obs= 2232 ± 69 s-1.
Figure 4 Bimolecular plot of kobs vs [SO2] for OH(=0) + SO2 at 50 Torr total pressure, helium buffer; k1 = (1.28 ± 0.03) × 10-13 cm3 molecule-1 s-1.
Figure 5. Literature rate coefficients, k1, for the reaction OH + SO2, at room temperature, where helium is the bath gas. Our results for OD + SO2 are also included. The solid line is a master equation simulation for OH + SO2 using helium and the parameters from the fit to the k1[M] data in Figure 7, the most reliable data set, see text for details.
Figure 6. A plot of k1(calculated) from the master equation analysis of flash photolysis data versus k1(experimental). It can be seen that the literature k1 experimental data are generally lower than the calculated value, i.e. below the line with a slope equal to one. The fitted energy transfer parameters, <E>down, are given in brackets after the bath gas.
Figure 8. A log-log plot of k1(calculated) versus k1(experimental) from the MESMER analysis of the data in Figure 7 and the flow tube data from 5, 26, 29 where helium is the buffer gas and its <E>down parameter is fixed to 165 cm-1. The black line is a slope of 1.0.

![Figure 4 Bimolecular plot of k obs vs [SO 2 ] for OH(v=0) + SO 2 at 50 Torr total](https://thumb-us.123doks.com/thumbv2/123dok_us/7732182.163035/15.892.160.664.446.886/figure-bimolecular-plot-obs-vs-oh-torr-total.webp)