Int. J. Electrochem. Sci., 3 (2008) 1081 - 1091
International Journal of
ELECTROCHEMICAL
SCIENCE
www.electrochemsci.orgApplication of Different Multistep Potential Sequences to the
Ion Transfer at Several Liquid-Liquid Interfaces
A. Molina1,*, C. Serna1 , J.A. Ortuño2 and E. Torralba1
1
Department of Physical Chemistry, Faculty of Sciences, University of Murcia, 30071-Murcia, Spain
2
Department of Analytical Chemistry, Faculty of Sciences, University of Murcia, 30071-Murcia, Spain
*
E-mail: [email protected]
Received: 4 June 2008 / Accepted: 3 July 2008 / Published: 4 August 2008
Simple expressions corresponding to the current-potential-time-curves and to the profiles of a target ion in the organic and aqueous phase when any multipotential pulse is applied to an ITIES, are given and applied to the determination of the diffusion coefficients of both phases. The special situation of solvent polymeric membrane ion sensors, for which it can be considered that the ionic transport is only controlled by diffusion in the organic phase, has also been treated in a very simple and elegant form.
Keywords: ITIES; Ion transfer chronoamperometry; PVC plasticized membrane; solvent polymeric membrane ion sensors
1. INTRODUCTION
Electrochemistry at the Interface between Two Immiscible Electrolyte Solutions (ITIES), also known as Liquid-Liquid Electrochemistry, has emerged as a new branch of Electrochemistry [1, 2]. Ion transfer at ITIES is probably the main topic within this branch and constitutes the basis for innovative applications in several fields. The applications of ion transfer across ITIES are limited by the mechanical instability of the liquid/liquid interface, a drawback that is especially important in the performance characteristics of sensors based on ion transfer across the sample/sensor membrane interface.
previous considerations it was concluded that the plasticized PVC is in a liquid-like state, forming a true solution in which ionophores and salts are dissolved. The mobilities of ions in these membranes are very sensitive to the level of PVC in the membrane. Thus, in going from 33% PVC, which is the typical PVC content, to 40% PVC, the diffusivities are decreased by a factor of about 10.
For theoretical and practical purposes is important to determine the thermodynamics and transport parameters of solvent polymeric membrane ion sensors, standard ion transfer potential and ion diffusion coefficients in the aqueous and in the organic phase, [1]. Differential pulse techniques have been applied for the accurate determination of standard ion transfer potential of different ions [10]. With regard to the determination on the diffusion coefficient values, chronoamperometry is an excellent electrochemical technique for the determination of diffusion coefficients of ions in the aqueous phase [11].
In this paper we use a very simple and general theoretical model [12] which permits us to obtain the concentration profiles of the target ion in the organic and aqueous phases and which also provides easy general explicit analytical equations for the response corresponding to any single, double or multipotential step technique which can be applied to analyse the ion transfer in these systems. These equations have been applied in this work to study the double and multipulse potential chronoamperometry in ITIES, operating in such a way that the applied potential is alternated between an uptake potential at which the target ion is transferred into the membrane, and a stripping potential which, if maintained during a sufficient time, permits all previously extracted ions to be transferred back to the sample. These studies give interesting conclusions regarding the calculation of diffusion coefficients of the ion in both phases. Indeed, for values of uptake and stripping potentials which are respectively much greater and much smaller than the formal ion transfer potential, the chronoamperograms corresponding to the stripping stage does not depend on the diffusion coefficient in the organic phase, contrary to some expectations. In contrast, if the stripping potential lies close to the formal potential, the corresponding chronoamperogram depends on the coefficient mentioned.
Worthy of special interest is the case of solvent polymeric membrane ion sensors operating under voltametric or amperometric transduction [7]. Bakker et al [13] developed a mathematical model from a pulsed amperometric ion sensor. They considered that the concentration profiles of the target ion in the aqueous phase is flat (i.e, the diffusion in the aqueous phase can be neglected), a condition which is favoured by fast stirring of the aqueous phase.
In order to exploit the possibilities of the voltammperometric and amperometric solvent polymeric membrane ion sensors, we have obtained general expressions that are valid for any type of potential steps sequence and which are in addition simpler than that reported above [13].
2. THEORY
Let us consider the reversible transfer of ion Xz through the interface between an aqueous electrolyte solution (w phase) and an organic one (o phase), which takes place by polarising the interface,
aqueous phase
(
w
)
organic phase
(
o
)
( )
z
X
w
X
z( )
o
x
→ − ∞
x
=
0
x
→ ∞
aqueous phase
(
w
)
organic phase
(
o
)
( )
z
X
z( )
w
X
z( )
o
X
w
X
z( )
o
x
→ − ∞
x
=
0
x
→ ∞
where z is the charge number, positive or negative.
Under the appropriate conditions, the mass transport can be mathematically modelled as a linear diffusion problem into the spatial domains shown in scheme I,
Scheme I. Spatial domains for the diffusion of Xz ion in the aqueous and organic phases
2.1. General case: considering the diffusion transport in both phases
When j successive potential pulses (E1, E2,…, Ej) are applied, the mass transport during the j-th potential pulse in the presence of sufficient amounts of supporting electrolyte in both phases is described by the following differential equations system,
2
2 0 ∂
− =
∂
o o
j j
o
c c
D
t x
δ
δ (1)
2
2 0
w w
j j
w
c c
D
t x
δ δ
∂
− =
∂ (2)
with cpj( , )x t and Dp being the concentration and the diffusion coefficient, respectively of ion Xz in the p phase (p = w, o).
The total time elapsed from the application of the first potential step is given by
1 2 ... 1 0
−
= + + + +
≤ ≤
j j
j j
t t
t
τ τ τ
τ (3)
For any step prior to j, tj =0, while for any step after j, tj is constant
(
=τj)
. For j≥2, the linearity of the equations system (1) allows us to write in general1
1
( , ) ( , ) ( , ) ( , ) ( , ) ( , )
o o o
j j j j
w w w
j j j j
c x t c x t c x t
c x t c x t c x t
−
−
= +
= +
%
where coj−1( , )x t and cwj−1( , )x t are the solutions already known for the previous step, (j-1)th step, and which have the form
1 1 1 2 1 1 1 2 ( , ) ( , ) ( , ) ( , ) ( , ) ( , ) − − = − − = = + = +
∑
∑
% % jo o o
j m
m j
w w w
j m
m
c x t c x t c x t
c x t c x t c x t
(5)
By taking into account the boundary value problem indicated in reference [12] and following the procedure shown therein, we find that the profiles corresponding to the j-th potential step take the following simple form
( )
1 1 ,* 1 1( , ) (0) (0) ( )
( , ) (0) (0)
− = ′ − = = − = + −
∑
∑
jo o o o
j m m m
m j
w w w w w
j m m m
m
c x t c c erfc s
c x t c c c erfc s
1 j≥ (6)
with ,* ,* (0) 1 (0) 1 = + = + w j o j j w w j j c J c J c c J γ γ 1 j≥ (7)
and 0 ,* 0 (0) 0 (0) = = o w w c
c c (8)
where w,*
c is the initial concentration of the target ion. In equation (6),
1 2 2 ; ; o m o mj w m w mj j
mj i j jj j
i j x s D t x s D t
t t t t t t
(
0)
0
exp ; 1
0
′
=
= − ≥
=
o w
j j
D D
zF
J E E j
RT J
γ
(10)
where 0
E ′ is the formal ion transfer potential and F, R and T have their usual meaning. The expression for the current corresponding to any j-th pulse is given by
(
)
,*1
1 1 1
1 1 1 1
( ) (0) (0)
1 1
−
= = −
= − = −
+ +
∑
j w w w∑
jw w
j m m
m mj m mj m m
D D
I t zFA c c zFAc
J J
t t
π π γ γ (11)
2.2. Particular case: transport controlled by the diffusion in the organic phase.
When the ratio between the diffusion coefficients in the aqueous and organic phase is large enough (as is the case of solvent polymeric membranes ion sensors) only differential equation (1) for the concentration in organic phase could be considered, since the concentration in aqueous phase could be considered as constant, i. e.:
,*
( , ) , 0
w w
j
c x t =c ∀t x≤ (12) This condition can also be favoured by rapid stirring of the aqueous phase. As a result, the interfacial nernstian condition for any jth pulse is expressed by
,* (0)
o w
j j
c =c J
(13)
The expressions for the concentration profiles and for the current deduced in these conditions are:
(
)
,*
1 1
( , ) ( )
j
o w o
j m m m
m
c x t c J J − erfc s
=
=
∑
− (14),*
1 1
1
( ) ( )
j
w o
j m m
m mj
D
I t zFA c J J
t
π = −
=
∑
− (15)
(
)
( )
1 ,*
1 1 2
2 1 1
( )
1 m j
w o
j
m D
I t zFAc J J J
j j m
πτ
+
=
−
= + −
− +
∑
(16)
and finally, for a potential at which the organic phase can be regenerated
(
0)
2E <<E ′ , equation below simplifies to:
( )
1 ,*1 1
1 ( )
1 m j
w o
j
m D
I t zFAc J
j m
πτ
+
=
−
=
− +
∑
(17)
which only depends on the diffusion coefficient of the organic phase.
3. RESULTS AND DISCUSSION 3.1. Concentration profiles
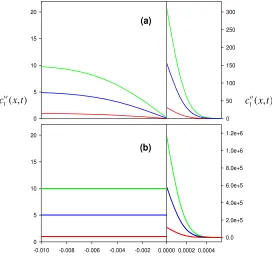
For purposes of comparison Figure 1 shows the concentration profiles for the application of a single potential step corresponding to limiting uptake current, i.e. 0
1
E >>E ′, for three different values of the initial concentration in the aqueous phase, in the two cases considered in sections 2.1 and 2.2, respectively.
0 50 100 150 200 250 300
x 0
5 10 15 20
1( , ) w
c x t c x t1o( , )
0.0000 0.0002 0.0004 0.0 2.0e+5 4.0e+5 6.0e+5 8.0e+5 1.0e+6 1.2e+6
-0.010 -0.008 -0.006 -0.004 -0.002 0
5 10 15 20
(a)
(b)
Figure 1. Concentration profiles when only a potential step, E1→ ∞ , is applied, for values of the initial concentration 1, 5 and 10 mM. The transport takes place: (a) by diffusion in both phases (Equation (6)); (b) only by diffusion in organic phase (Equation (15)). τ =1 s, Dw=10−5cm2/s,
8 2
10 /
[image:6.612.170.442.388.651.2]
As can be observed from both figures, whereas the diffusion layer thickness in the organic phase is scarcely influenced by the initial concentration value, the surface concentration of the target ion in this phase is strongly sensitive to this value, becoming much greater than it due to the fact that the diffusivity of the ion in the organic phase is smaller than in the aqueous one.
The increase of surface concentration in the organic phase is much higher when the transport is controlled only by diffusion in this phase (see Fig.2 and note that the y-scale of the figure covers a much wider range) since Eq. (13) is satisfied, whereas when the transport is controlled by diffusion in both phases (Fig 1) the following is fulfilled:
,* (0)
o w w
o
D
c c
D
= (18)
3.2. Multipotential step at ITIES
3.2.1. Diffusion transport in both phases
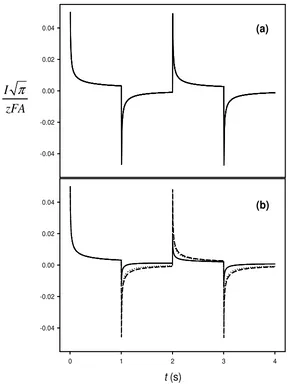
When a sequence of four successive potentials steps, E1, E2,E3 and E4, with the same duration,τ , and opposite direction, beingE1=E3 and E2 =E4, is applied, in order to calculate the diffusion coefficients of the ion in both phases, two different situations are of special interest regarding the applied potential:
a) The values of both uptake and stripping potential correspond to diffusion controlled conditions, i.e. E1=E3>>E0'and E2=E4<<E0'.
In this case, Eq. (11) becomes the following for the uptake and striping potential steps:
,* 1
,* 3
3 2
1
3 2
w w
w w
D I zFA c
uptake steps D
I zFAc
πτ
πτ
=
= − +
(19)
and
,* 2
,* 4
2 1 2
3 2 1
3 2 2
w w
w w D
I zFA c
stripping steps D
I zFA c
πτ
πτ
= −
= − + −
(20)
t(s)
-0.04 -0.02 0.00 0.02 0.04
I
zFA
π
t (s)
0 1 2 3 4
-0.04 -0.02 0.00 0.02 0.04
(a)
(b)
Figure 2. Current-time curves corresponding to four potential steps when transport takes place by diffusion in both phases, for values of the diffusion coefficient of the organic phase,Do: () 10−6, (L L)10−8 and (---) 10 10 2/
cm s
− ; 10 5 2/
Dw= − cm s, τ =1 s, 0
0.00 V ′ =
E , E1=E3→ ∞ and: (a) 2 4
E =E → −∞,.(b) E2=E4 =0.05 V
As can be observed in figure 2a, the current due to the stripping of the target ion from the organic phase, and somewhat contrary to expectations, depends only on the diffusion coefficient in the aqueous phase, Dw, as occurs in the uptake chronoamperograms and, therefore, it is clear that the diffusion coefficient of the organic phase, Do, cannot be estimated from anycurve.
b) Only the uptake pulse value corresponds to diffusion controlled conditions, i.e. 0'
1 3
[image:8.612.157.445.87.472.2]
When these potentials are used, the expressions for the uptake and stripping current-time curves become:
(
)
,* 1 ,* 31 1 2
1 1 2 3 w w w w D I zFAc uptake steps D I zFAc πτ πτ γ = = − − + (21)
(
)
(
)
,* 2 ,* 4 1 1 1 21 1 3 2
1
2 1 3 2
w w
w w
D I zFA c
stripping steps D
I zFA c
πτ γ πτ γ = − + = − − + + (22)
In other words, when the potential to regenerate the membrane is near to the formal potential of the system, the ion transfer from organic to aqueous phase also depends on Do through γ , as can be seen in figure 2b. Furthermore, the only curve that does not depend on Do in this conditions is the first uptake curve. The two diffusion coefficients can be calculated from these curves. Indeed, once Dw is known from the analysis of the first uptake current-time curve (Eq. (21)), Do can be easily determined, for example from the second chronoamperogram by:
2 2 2 1 1 n
o w n
I D D I + = −
(23)
where 2 2 ,* 2 n w w I I zFAc D πτ = (24)
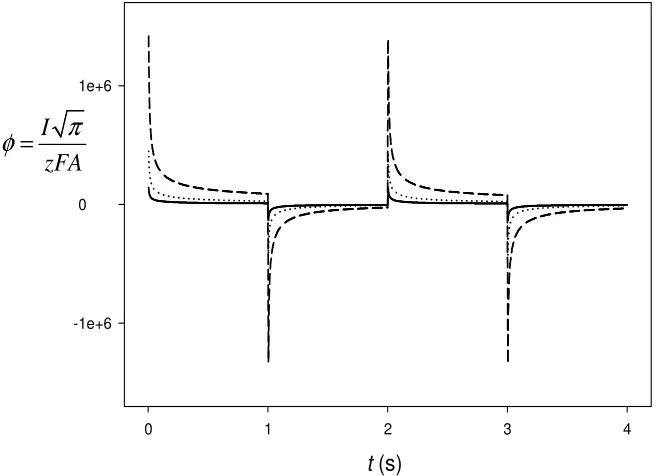
3.2.2. Transport controlled by the diffusion in the organic phase.
When the same sequence of pulses is applied to the particular case of diffusion in only the organic phase (see figure 3) it is easy to determine the diffusion coefficient in this phase from any
/ j j
I t chronoamperogram, by means of the logarithmic analysis (i.e by plotting lnIj vs
( )
1
t (s)
0 1 2 3 4
-1e+6 0 1e+6
=
I
zFA
[image:10.612.137.466.67.305.2]π
φ
Figure 3. Current-time curves corresponding to four potential steps when transport takes place only by diffusion in organic phase, for values of the diffusion coefficient of the organic phase,Do: (---) 10−7, (L L)10−8 and () 10−9cm2/s; τ =1 s, E0′ =0.00 V, E1=E3→ ∞, E2=E4 → −∞.
As any of these Ij/tj curves depends on the product D co w,* we can determinate either Do or ,*
w
c from the ordinate at the origin of the plot mentioned.
Note that in these conditions the absolute value of the currents obtained is much greater than in the above case (section 3.2.1).
ACKNOWLEDGEMENTS
We gratefully acknowledge the Ministerio de Educación y Ciencia, Spain (Projects CTQ 2005-06977 / BQU and CTQ 2006-12552 / BQU), FEDER (Fondo Europeo de Desarrollo Regional) and Fundación Séneca (Expediente No. 03079/PI/05) for the financial support of this work.
References
1. Z. Samec, Pure Appl. Chem., 76 (2004) 2147.
2. F. Reymond, D. Fermín; H.J. Lee, H.H. Girault, Electrochim. Acta, 45 (2000) 2647. 3. H. Katano, M. Senda, J. Electroanal. Chem., 496 (2001) 103.
4. A. Malkia, P. Liljeroth, K. Kontturi, Electrochem. Comm., 5 (2003) 473.
5. A. Berduque, A. Sherburn, M. Ghita, R.A.W. Dryfe, D.W.M. Arrigan, Anal. Chem,. 77 (2005) 7310.
6. H.J Lee, C.M. Pereira, A.F. Silva, H.H. Girault, Anal. Chem., 72 (2000) 5562. 7. S. Jadhav, E. Bakker, Anal. Chem., 71 (1999) 3657.
10.J. A. Ortuño, C. Serna, A. Molina, A. Gil, Anal. Chem., 78 (2006) 8129. 11.T. Kakutani, T. Osakai, M. Senda, Bull. Chem. Soc. Jpn., 56(1983)991. 12.A. Molina, C. Serna, L. Camacho, J. Electroanal. Chem., 394 (1995 1. 13.E. Bakker, A. J. Meir, SIAM Review, 45 (2003) 327.