Int. J. Electrochem. Sci., 4 43 - 59
International Journal of
ELECTROCHEMICAL
SCIENCE
www.electrochemsci.org
Study of Electrical Resistance on the Surface of Nafion 115
®Membrane Used as Electrolyte in PEMFC Technology
Part I: Statistical Inference
C. Moisés Bautista-Rodríguez1,*, Araceli Rosas-Paleta2, J. Antonio Rivera-Márquez1, Omar Solorza-Feria3
1 Alter Energías Grupo. Tepetitlán No. 63, Col. Lomas del Sur, CP 72470 Puebla, Pue. México
2 BUAP. Facultad de Ingeniería Química. Av. San Claudio y 18 Sur - CU-, 72590 Puebla, Pue. México 3 Cinvestav-IPN. Depto de Química. Av. IPN 2508, Col. San Pedro Zacatenco. C.P. 07360 México
DF, México
* Actual address: UHDE de México S.A. Av. Paseo de las Palmas 405. CP 11000 Lomas de
Chapultepec, DF. México,E-mail: [email protected]
Received: 11 September 2008 / Accepted: 1 December 2008 / Published: 20 December 2008
The proton conductive Nafion® type membranes with perfluorosulfonic acid as basis are compounds of
a polymer belonging to the family of the ionomers. The properties of these materials with respect to those of normal polymers are focused on the interaction ion-polymer in the ionomers allowing among others; conductive characteristics, hence its applications are diverse. The membrane Nafion® is commonly used as an electrolyte in the proton exchanging membrane fuel cell (PEMFC). Different kinetic and transport phenomena (mass, electrons and charges) are producing in this electrochemical device during its operation. Particularly, the electrical resistance on the Nafion surface contributes significantly in the phenomena associated with the transport of electrons between the interfaces carbon - catalyst - electrolyte developing a significant effect on the PEMFC performance. This paper presents the statistical analyses results of an experimental design 23 type with central compound for the records of Superficial Electrical Resistance (SER) measured on both sides of a Nafion 115 (N115) activated and other similar non activated. The statistical results show at 95% confiability, the evidence that process activation produce some modifications in the electrical resistance characteristics on the surface of N115, this includes; decrease in the SER average value in 10 times approximately, the formation of areas with different values SER and a randomization of these regions. Finally, the zones with different levels in ohmic losses may affect the PEMFC performance by non homogeneous conversion of chemical energy in electrical energy and increase of the thermal energy generated in the fuel cell.
1. INTRODUCTION
In the year 1970, the perfluorosulfonic membranes named Nafion® have been developed by Dupont de Nemours Company. These materials are generated by copolymerization of a perfluorinated vinyl ether co-monomer with tetrafluoroethylene (TFE), resulting in the chemical structure given in Figure 1. Nafion membrane belonging to the family of ionomers i.e. constitutes a cluster ion reaching form a matrix of low dielectric constant causing aggregation of charges in the form of clusters, their existence experimental and theoretical are due to F.C. Wilson in 1968 and Eisenberg in 1970, respectively. Its molecular formula is: C7HF13O5S . C2F4, the molecular weight of this polymer has
been difficult to determine with precision, with different values reported over time by different authors, but an estimate has been accepted a molecular weight between 105 and 106 Da [1-4]. Several molecular models have been published [4, 5]: Yeager, Seko, Pineri, Perusich, Hashimoto, Gierke, Fujimura, Litt Dreyfus, Haubold and Rubatat. However, the generally accepted model is that of Yeager, developed from an analysis of diffusion coefficients for cesium and sodium ions in a Nafion membrane hydrated with a weight equivalent to 1200 [6]. The source of debate on the morphology of Nafion stems from the fact that this ionomer has a unique chemical structure random, being capable of organizing a complex formation of ionic and crystalline regions with significant distribution in size with a wide range of length scales [3, 4]. The Yeager model propose three regions in its structural chain for Nafion membrane (Figure 1): The first of these regions is a structure that contains chains of poly-tetrafluoetileno (PTFE), inert material in any environment or oxidation reduction with a characteristic hydrophobic and large chemical and mechanical stability [3]. The second region named 'intermediary' is amorphous and hydrophobic, this contains chains hanging, a minimum quantity of water and some radical anions; The third region constitutes briquettes, ionic coexists where most ions sulphonated, cations and water molecules absorbed, giving a absorbing character to the membrane [5]. The sulfate ion present in the structure of Nafion allows the conductive properties in the terms of hydrated membrane state, being an active site where some cations as H+, Li+, Na+ among others,
[image:2.612.223.377.554.691.2]spreading by electro-absorption (portering) into the membrane [3]. In particular, water molecule can also spread (mass transit) per share of bipolarity electrical by his hydrogen bridge. Different categories of Nafion membranes have been developed according to their thickness: 118 µm for Nafion 117 (N117), about 100 µm for Nafion 115 (N115) and approximately 50 µm for Nafion 112 (N112) [7].
Figure 2. Cluster-Network model for the morphology of hydrated Nafion [3].
During the 70's years of last century, Gierke and collaborators, based on analysis Small Angle X-ray Scattering (SAXS) and Wide-Angle X-ray Diffraction (WAXD) considered the highest prevalence of three models so far determine the morphology of ionomer, including a model of polycrystalline spherical clusters in a lattice, a model of core-shell and a model type lamellar, the authors concluded that the water-swollen morphology of Nafion was best described by a model of ionic clusters that were approximately spherical in shape with an inverted micellar structure. The Gierke's model has allowed predict the number of ions attracted by groups of sulphonated Nafion, as well as the increase in water content [9]. In consideration of the high permeability-ion selectivity and the need for a way to the leaking of ion transport in Nafion membranes, this group later proposed a model of ionic spherical agglomerates; these briquettes are interconnected by narrow channels with certain ionic properties for transport and water, this morphology has a networks briquettes type (Figure 2). The water content in these networks and channels is of great importance to the properties of transport and ionic conductivity of the membrane Nafion [3, 4], given that the vast majority of applications involve a Nafion membranes hydrated or dilated state by a solvent presence.
In a later decades, several research groups [11-15] have reported analysis by ASAXS, SAXS, TEM (Transmission Electron Microscopy) and SANS (Small Angle X-ray Scattering) on Nafion to determine the dimensions of the spatial characteristics of networks briquettes ionic. In general, has been accepted a diameter of 40 Å for briquettes with an average distance from center to center while 50 Å space channels is estimated at 10 Å to conditions completely hydrated, the authors had reported a values minors at this for partially hydrated conditions [3, 4]. Kumar and Pineri reported by mean a study of intermolecular -OH correlations between water and sulphonated groups, a concentration of water in the Nafion equivalent to 21 molecules per -SO3- group [16]. Other studies report increases in
[image:4.612.201.405.337.483.2]
provides information related to the size, shape and spatial distribution of aggregates, while the very small (the small rebound angle) can be attributed to packages largest aggregates with a broad range of heterogeneous distribution. The water absorption allows kernels lengthening forming pools of water surrounded by groups in an ionic polymer-water interface in order to minimize energy interface. As the water content increases the values of the parameters mentioned are increased to approximately 0.3 and 0.5 respectively. At values greater than 0.5 develops a reversal of the structure in such a way that generated the structure resembles a network connected by rods. Lastly, the membrane appears as "dissolve" in solution, the structures are separated bar to get a colloidal dispersion of isolated rods (Figure 3). While this model provided an adequate mechanism for the evolution in the structure with wide acceptance of the concept of isolated groups of the membranes that contain relatively low water content, does not provide justification thermodynamics on the stage of investment. In 2000, Gebel proposed a conceptual description for the process of dissolution for dilation and Nafion membrane [19]. The proposed Gebel is based in SANS results on Nafion in a wide range of water content combined with energy considerations, in this model is considered dry membrane containing ionic isolated groups within an area with a diameter spherical and a distance of downtown center to approximately 1.5 nm to 2.7 nm, respectively.
Figure 3. Schematic representation of an entangled network of elongated rodlike aggregates in Nafion [3].
Nguy [26] have reported conductivity of 3x10⁻² S cm-1 to 100% relative humidity. Pourcelli and other
authors reported 6x10⁻² S cm-1 for this property [27, 28], while Tazi and co. reported an ionic
conductivity of the membrane N117 equivalent to 1.23 x 10⁻²Ω-1 cm-1 in H
2SO4 1 M a 25oC [29].
Fontanella and co [30] has reported measurements of electrical conductivity from impedance diagrams with values between 0 and 0.10 S cm-1 fro N117 and N120 with water content between 3 and 30 wt%
respectively.
Hydrogen decomposition takes place in the anodic electrode at the PEMFC into protons and electrons, the protons are driven by the Nafion membrane to the cathode while the electrons are rejected by the polymer electrolyte membrane and driven by an external circuit where their energy can be harnessed in some services. In the cathode, the molecular oxygen decomposes to form water with protons from the membrane and the electrons in the external circuit; the peculiarity is that electrons must overcome the electrical resistance of Nafion to reach at the active sites where the overall reaction is completed. This study proposes a statistical analysis on the electrical resistance measurements at the surface (SER) on the Nafion membranes, in order to know the surface characteristics of this property and the possible effects on the PEMFC functionality. Measurements are made on a membrane N115 without activation and other membrane of the same type and lot previously activated. The statistical tools proposed in this study [31, 32] are; i) descriptive statistics which meet the general characterization to the variable being studied, ii) statistical inference offers insight into the differences between membrane treatments and between its different regions. Finally, a deduction on their effects during the operation of the PEMFC will be discussed.
2. EXPERIMENTAL PART
Two pieces of N115 membrane to the same lot with an area defined in both cases at 112.33 cm2 (10.5 x 10.7 cm), have been used for this study, one of them has been activated in the following manner: a dip in a 3% Vol, H2O2 solution at 80oC for an hour, then the membrane is immersed in
deionized water to 80 °C for one hour, after receiving a bath at the same temperature for two hours in a HNO3 -1 N solution, finally apply three bathrooms in deionized water [17]. Both membranes were
geometrically divided into 4 quadrants with equivalent area to 5 x 5 cm for measurement of SER. An experimental design 23 type central compound has been applied for measuring and recording of SER on the membrane N115. Based on the statistical model proposed for this work was designed a matrix with five points (Figure 4) in the Cartesian coordinates (0,0) and the number of entries per quadrant is 13 measurements with a repetition by point to generate statistical report recital 26 entries per quadrant.
[image:6.612.222.388.253.387.2]
Figure 4. Matrix applied for electrical resistance measurements on Nafion 115 membrane surface.
Figure 5. Sketch for matrix unit applied in electrical resistance measurements.
3. RESULTS AND DISCUSSION
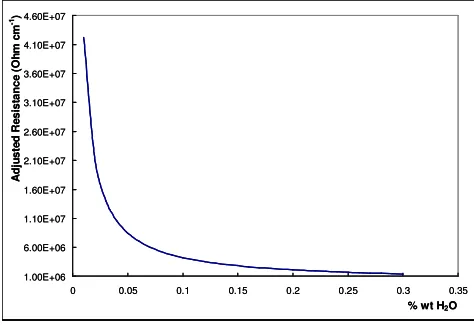
Figure 6 shows the membranes N115 used in this study (activated and not). Table 1 shows the increase in volume in the membrane during each stage of activation process. The second piece of N115 has not received any prior preparation. Moreover, a partial reproduction of the measurements of Fontanella and Co. [26] has been adjusted by an exponential function with a correlation coefficient (R2) of 0.9996 to compare the results in terms of electrical resistance and relative humidity (Figure 7),
allowing to locate these conditions in the membranes used.
Table 1. Volume increased after each activation stage process for Nafion 115 membrane.
Nafion 115 Non Activated H2O2 3%V H2NO3 1 M H2O Deionised
Area, (cm2) 112.33 133.28 133.4 141.36
Volume increased (%) --- 15.7 16.4 20.5
The values presented in Table 1 shows an increase in the volume set after each activation stage, the first phase being the most far-reaching. The oxidation process caused by H2O2 undoubtedly
the membrane causing the increase in volume, 15% for this case in the N115 membrane. However the activation processes for sulphonated sites with HNO3 not have the same effect on the Nafion 115
structure (only 0.7%V increasing) but it’s important for the -SO3+ sites activation. Finally, N115
membrane increases significantly in volume (4%) during the third activation stage, using only deionized water at 80oC. The total increase in volume after treatment for activation of the N115
[image:7.612.199.411.204.363.2](20.52%) shown in the table above contrasts with the increase reported for the N117 (> 30%) [17], attributed to the absorption capacity depending on the thickness the membrane as we mentioned Kumar and Pineri among others [4, 16].
Figure 6. Nafion 115 membranes; activated (translucent) and not activated (dark)
Figure 7. Fontanella’s data curve for adjusted electrical resistance in function of water content in Nafion membrane.
3.1. Descriptive Statistics
First, the principles of normality and independence are verified for surface electrical resistance data, confirmation of these principles is important to validate the application of statistical tools in the analysis.
1.00E+06 6.00E+06 1.10E+07 1.60E+07 2.10E+07 2.60E+07 3.10E+07 3.60E+07 4.10E+07 4.60E+07
0 0.05 0.1 0.15 0.2 0.25 0.3 0.35
% wt H2O
A
d
ju
s
te
d
R
e
s
is
ta
n
c
e
(
O
h
m
c
m
-1)
1.00E+06 6.00E+06 1.10E+07 1.60E+07 2.10E+07 2.60E+07 3.10E+07 3.60E+07 4.10E+07 4.60E+07
0 0.05 0.1 0.15 0.2 0.25 0.3 0.35
% wt H2O
A
d
ju
s
te
d
R
e
s
is
ta
n
c
e
(
O
h
m
c
m
[image:7.612.190.427.413.576.2][image:8.612.100.521.75.227.2]
a) b)
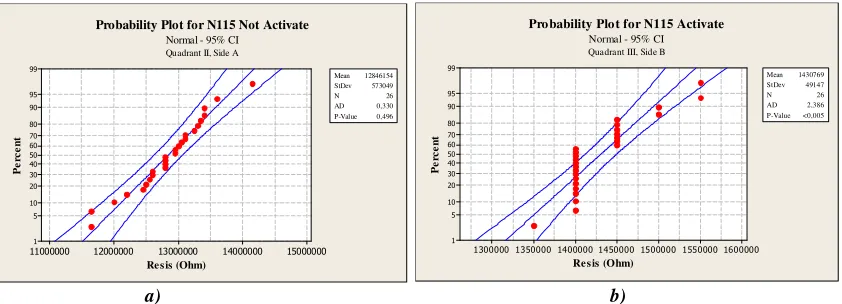
Figure 8. Normality Data Test for (a) the first quadrant side A of not activate membrane and (b) third quadrant side B of activated membrane.
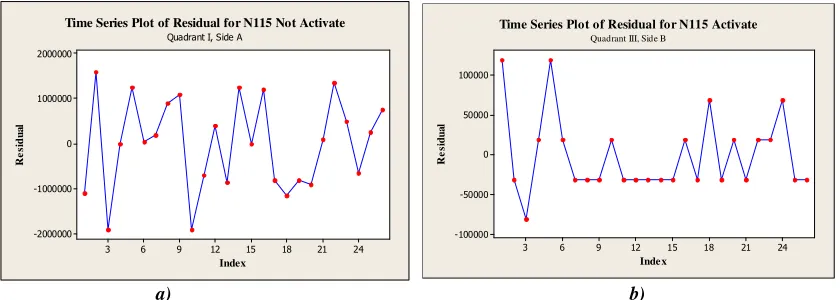
Figure 8.a shows the normality test for the second quadrant side A from N115 dehydrated, not violation for the normally principle is observed on the figure, this behavior being a constant in all cases of the not activated membrane, therefore the reliability of results is robust. In contrast, Figure 8.b shows the normality test for the third quadrant side B in the membrane N115 activated. In this case, there are significant deviations from the normality principle in the SER data; therefore the statistical results should be analyzed with caution. It’s important to note the difference between statistical data of both treatments SER membrane N115 (activated and not). Figure 9 shows the independence test for statistical data in the study, the first (a) corresponds to the first quadrant side A of the membrane N115 not activated, no significant deviation is observed in all cases of the dehydrated membrane. Moreover, the picture 9.b shows the same test for the third quadrant side B of activated N115 membrane, slight correlation data is observable on the figure. It should be noted that this behavior occurs in all cases of the membrane activated, indicating a light deviations on the independence principle for SER data for each case. The correlation of data can be attributed to wet conditions and measurement on the surface of the membrane during data record.
Figure 10 shows the histograms of frequency with normality curves for SER data for the first quadrant side A (Figure 10.a) and the fourth quadrant side B (Figure 10.b) for not activate membrane. In both cases, a normal distribution trend is observed, these features were observed in all cases for not activate N115 membrane.
Figure 11 shows the frequency histograms with normality curves for electrical resistance surface data for the first quadrant side A (Figure 11.a) and the third quadrant side B (Figure 11.b) in the membrane N115 activated. Contrary to the characteristics observed for the membrane not activated, in this case is observed an among distant categories (columns) for SER data, i.e., the distribution of data in this case are not continuous, introducing the formation of well-defined groups. It is obvious that the activation process in the membrane N115 alter the structure of the polymer and thus its conductive properties, particularly the electrical resistance surface. These results suggesting the areas formation with different characteristics and properties on the surface for Nafion 115 membrane based on their morphology, in accordance with those reported by Rubatat and colleagues (Figure 3).
15000000 14000000 13000000 12000000 11000000 99 95 90 80 70 60 50 40 30 20 10 5 1
Res is (Ohm)
P e rc e n t Mean 12846154 StDev 573049 N 26 AD 0,330 P-Value 0,496
Normal - 95% CI
Probability Plot for N115 Not Activate
Quadrant II, Side A
1600000 1550000 1500000 1450000 1400000 1350000 1300000 99 95 90 80 70 60 50 40 30 20 10 5 1
Res is (Ohm)
P e rc e n t Mean 1430769 StDev 49147 N 26 AD 2,386 P-Value <0,005
Normal - 95% CI
Probability Plot for N115 Activate
[image:9.612.96.516.76.226.2]
a) b)
Figure 9. Independence data test for a) the first quadrant side A and b) third-hand quadrant B of the activated membrane.
a) b)
Figure 10. Histogram frequency with normal curve for a) the first quadrant side A and b) third quadrant side B (b) of activated membrane.
a) b)
Figure 11. Histogram frequency with normal curve for a) the first quadrant side A and b) third quadrant side B of activated membrane.
24 21 18 15 12 9 6 3 2000000 1000000 0 -1000000 -2000000 Index R e si d u al
Time Series Plot of Residual for N115 Not Activate
Quadrant I, Side A
24 21 18 15 12 9 6 3 100000 50000 0 -50000 -100000 Inde x R e si d u al
Time Series Plot of Residual for N115 Activate
Quadrant III, Side B
14000000 13000000 12000000 11000000 6 5 4 3 2 1 0 Resis (Ohm) F r e q u e n c y Mean 12505769 StDev 1010577 N 26
Histogram (with Normal Curve) for N115 Not Activate
Quadrant I, Side A
14000000 13500000 13000000 12500000 12000000 9 8 7 6 5 4 3 2 1 0 Resis (Ohm) F r e q u e n c y Mean 12892308 StDev 439703 N 26
Histogram (with Normal Curve) for N115 Not Activate
Quadrant IV, Side B
1400000 1380000 1360000 1340000 1320000 1300000 1280000 16 14 12 10 8 6 4 2 0 Resis (Ohm) F r e q u e n c y Mean 1336538 StDev 30192 N 26
Histogram (with Normal Curve) for N115 Activate
Quadrant I, Side A
1550000 1500000 1450000 1400000 1350000 14 12 10 8 6 4 2 0 Resis (Ohm) F r e q u e n c y Mean 1430769 StDev 49147 N 26
Histogram (with Normal Curve) for N115 Activate
[image:9.612.98.515.297.447.2] [image:9.612.98.517.520.670.2]
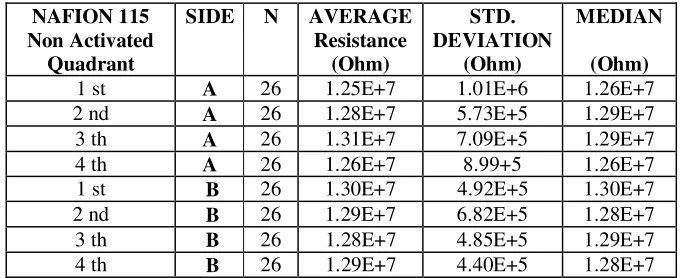
Table 2 shows the descriptive statistics obtained with the software MINITAB for not activated Nafion 115 membrane. In general, average values for SER on the surface for N115 not activate are 1.275 E7Ω cm-1 for side A and 1.29 E7Ω cm-1 for side B, also there are a significant dispersion values
presented to the average of standard deviation 7.97 E5 Ω cm-1 and 5.27 E5Ω cm-1 for sides A and B
respectively. Moreover, there are values of the median 1.275 E7 Ω cm-1 and 1.285 E7 Ω cm-1
respectively which indicate a displacement in the average values to higher values. Comparing the average value of SER with the curve in Figure 7, the not activated Nafion 115 membrane used in this study have around 0.035 wt% of H2O. This result has no application for PEMFC in working
[image:10.612.135.475.270.409.2]conditions; however the values and averages presented here represent a benchmark for fuel cells and stacks not operated by long time.
Table 2. Descriptive statistics for SER data on N115membrane for both sides and treatments
NAFION 115 Non Activated
Quadrant
SIDE N AVERAGE
Resistance (Ohm)
STD. DEVIATION
(Ohm)
MEDIAN
(Ohm)
1 st A 26 1.25E+7 1.01E+6 1.26E+7
2 nd A 26 1.28E+7 5.73E+5 1.29E+7
3 th A 26 1.31E+7 7.09E+5 1.29E+7
4 th A 26 1.26E+7 8.99+5 1.26E+7
1 st B 26 1.30E+7 4.92E+5 1.30E+7
2 nd B 26 1.29E+7 6.82E+5 1.28E+7
3 th B 26 1.28E+7 4.85E+5 1.29E+7
4 th B 26 1.29E+7 4.40E+5 1.28E+7
Table 3 shows the descriptive statistics obtained by the MINITAB software for the activated N115 membrane used in this study. The activated membrane shows a SER average to 1.54 E6Ω cm-1
for side A and 4.44 E6Ω cm-1 for side B. These values show a reduction in the electrical resistance on
activated N115 membrane by 10 times in comparation with not activated membrane. The average values for the standard deviation are 3.03 E5Ω cm-1 and 1.18 E5Ω cm-1 for A and B sides respectively,
noting also a reduction equivalent to 10 times compare with the values present in the dehydrated membrane. Moreover, the values of the median in this case are curtailed in the same order with securities equivalent to 1.48 E6Ω cm-1 and 1.37 E6Ω cm-1 for A and B sides respectively. In other
way, different average values for superficial electrical resistance suggests an effect on the functionality of the PEMFC depending on the side in contact with cathodic or anodic electrode, however the median value does not determine any significant difference but the high values in standard deviation suggest areas with different SER values, in consequence an effect on the PEMFC performance is possible.
The water weight differences at both sides in the not activated membrane are negligible and then both sides are estimated to be worth 0,035 wt% H2O in Figure 7. In accordance with the literature,
the SER is reduced during activation process in the membrane due to the water spread and chemical activation to sites -SO3+ inside the Nafion membrane. The difference in the average values for SER at
contrast, considering the average values for SER and locating these values in the curve on Figure 7 are worth 0,285 and 0,095% wt% of H2O for the sides A and B respectively in activated Nafion 115
[image:11.612.130.470.228.380.2]membrane used in this study. This increase is attributed to chemical activation process in membrane where it favors the water spread inside to the membrane. It is surprising to note a significant difference in water absorption by N115 membrane at each of its sides, which can be attributed to different morphological characteristics in each of its sides depending on the content in PTFE type structures at both sides on the Nafion membrane.
Table 3. Descriptive statistics for SER on N115 membrane for both sides and treatments.
NAFION 115 Activated Quadrant
SIDE N AVERAGE
Resistance (Ohm)
STD. DEVIATION
(Ohm)
MEDIAN
(Ohm)
1 st A 26 1.34E+6 3.02E+4 1.35E+6
2 nd A 26 1.31E+6 2.26E+4 1.30E+6
3 th A 26 1.37E+6 2.93E+5 1.30E+6
4 th A 26 2.15E+6 8.67E+5 1.97E+6
1 st B 26 1.45E+6 3.28E+5 1.40E+6
2 nd B 26 1.35E+7 2.64E+4 1.35E+6
3 th B 26 1.43E+6 4.92E+4 1.40E+6
4 th B 26 1.39E+6 6.88E+4 1.35E+6
3.2. Statistical Inference: averages analyses.
Table 4 shows the statistical inference results concerning averages on both sides of the membranes N115 (activated and not). The criterion for evaluating inference mean considered is as follows:
Null Hypotheses Alternative Hypotheses Reject Null Hypotheses if:
µ 1 = µ 2 µ 1 ≠ µ 2 P < 0.05
[image:11.612.136.481.520.550.2]
be produced by the activation process on the Nafion surface and each area may be affected in function as dominant type structure on the Nafion surface. En consequence, the difference between SER values at both sides on N115 suggests a probably significant effect on the PEMFC functionality in according to the side in contact with electrodes. Moreover, it’s expected a different PEMFC performance by each one quadrant applied in the fuel cell.
Table 4. Statistical inferences about averages for SER on N115 membrane for both sides and treatments (activated and not).
Nafion 115 Quadrant Condition
SIDE COMPARATION
N AVERAGE
Resistance (Ohm)
STD. DEVIATION
(Ohm)
P VALUE
IQ-A A-B 26 1.34E+6
1.45E+6 3.02E+4 3.28E+5 0,092
IIQ- A A-B 26 1.31E+6
1.35E+6 2.26E+4 2.64E+4 0,000
IIIQ-A A-B 26 1.37E+6
1.43E+6 2.93E+5 4.91E+4 0,272
IVQ-A A-B 26 2.01E+6
1.40E+6 8.65E+5 6.88E+4 0,003
IQ- N/A A-B 26 1.25E+7
1.30E+7 1.01E+6 4.92E+5 0,045
IIQ- N/A A-B 26 1.28E+7
1.29E+7 5.73E+5 6.82E+5 0,852
IIIQ- N/A A-B 26 1.31E+7
1.28E+7 7.09E+5 4.85E+5 0,133
IVQ- N/A A-B 26 1.26E+7
1.29E+7 8.99E+5 4.40E+5 0,115
Q = Quadrant ; (N/A) = Not activated membrane ; (A) = Activated membrane
3.3. Statistical Inference: variance analysis
Table 5 presents the statistical inference concerning to variance analysis for both sides and two treatments at the Nafion® 115 membrane (activated and not). The criterion for statistical validation in
this case is as follows:
Null Hypotheses Alternative Hypotheses Reject Null Hypotheses if:
σ12 = σ22 σ12≠σ22 P < 0.05
[image:12.612.114.496.203.440.2][image:13.612.165.446.201.442.2]
activated membrane is similar only in the second quadrant. The results in table 5 suggest in first time a most common levels for SER variance values at both sides on the surface of Nafion 115 membrane and in second time is probably the modifications on the SER variance in all regions (quadrants) for the N115 during the activation process as a result of the morphological characteristics in the membrane, the diffusion of water and chemical activation in -SO3+ sites inside the membrane.
Table 5. Statistical Inferences about the standard deviation for SER on N115 membrane for both sides and treatments (activated and not).
Nafion 115 Quadrant Condition
SIDE COMPARATION
N STD.
DEVIATION (Ohm)
P VALUE
IQ-A A-B 26 3.02E+4
3.28E+5 0.000
IIQ- A A-B 26 2.26E+4
2.64E+4 0.447
IIIQ-A A-B 26 2.93E+5
4.91E+4 0.000
IVQ-A A-B 26 8.65E+5
6.88E+4 0.000
IQ- N/A A-B 26 1.01E+6
4.92E+5 0,001
IIQ- N/A A-B 26 5.73E+5
6.82E+5 0,390
IIIQ- N/A A-B 26 7.09E+5
4.85E+5 0,063
IVQ- N/A A-B 26 8.99E+5
4.40E+5 0,001
Q= Quadrant; (N/A) = Not Activated ; (A) = Activated
and whiskers) in side B is displaced at smallest values. The variance test for 4th quadrant for both sides
is shows in Figure 12.d; their observations are very similar with those for 1st quadrant, therefore a real
similarity in SER is supposed for both quadrants in their sides respectively.
a) b)
[image:14.612.90.518.144.460.2]d) c)
Figure 12. Test for equal variances for SER on N115 not activated in the a) first, b) second, c) Third and fourth quadrants by both sides.
The variance tests for all quadrants studied in the N115 membrane activated are shown in Figure 13. It is possible to observe significant differences between the variances by side in quadrants I, III and IV (Figure 13.a, c and d) in the membrane, where they appreciate different magnitude intervals and total independence (without overlapping). However, there is a significant difference on the first quadrant regarding other cases, the characteristics of the variance are invested on both sides, i.e.; the variance on the side A is smaller and tends to lower values in contrast with others cases. The second quadrant (Figure 13.b) however, shows variances similar in magnitude, with an overlap between the intervals. Moreover, the box and whiskers graphs show inconsistency in the distribution of data variance, therefore any comment has a sufficient level of reliability for some discussion for this case.
In principle, a statistical analysis on the membrane of SER N115 not activate has no practical interest because presents very low ionic conductivity, but the knowledge that provides statistical analysis on this membrane is a very interesting baseline on the results analysis in an activated N115 membrane. Thus the results presented here to demonstrate the presence of different areas of response
Resis B Resis A 1500000 1250000 1000000 750000 500000
95% Bonfe rroni Confidence Intervals for S tDevs
Resis B Resis A 14000000 13500000 13000000 12500000 12000000 11500000 11000000 10500000 Data
Test S tatistic 4,21 P-Valu e 0,001 Test S tatistic 11,69 P-Valu e 0,001
F-Test
Lev ene's Test
Test fo r Equal Variances for Resistance fo r N115 Not Activate
Quadrant I, Side A and B
Resis B Resis A 1000000 900000 800000 700000 600000 500000 400000
95% Bonferroni Confidence Intervals for S tDevs
Resis B Resis A 14500000 14000000 13500000 13000000 12500000 12000000 11500000 11000000 Data
Test Statistic 0,71 P-Value 0,390 Test Statistic 1,21 P-Value 0,276
F-Test
Lev ene's Test
Test for Equal Variances for Resistance for N115 Not Activate
Quadrant II, Side A and B
Resis B Resis A 1400000 1200000 1000000 800000 600000 400000 200000
95% Bonferroni Confi dence Intervals for S tDevs
Resis B Resis A 14000000 13000000 12000000 11000000 10000000 Data
Test S tatistic 4,18 P-Valu e 0,001 Test S tatistic 8,28 P-Valu e 0,006
F -Test
Lev ene's Test
Test fo r Equal Variances fo r Resistance for N115 No t Activate
Quadrant IV, Side A and B
Resis B Resis A 1100000 1000000 900000 800000 700000 600000 500000 400000
95% Bonferroni Confidence Intervals for S tDevs
Resis B Resis A 14500000 14000000 13500000 13000000 12500000 12000000 Data
Test Statistic 2,14 P-Value 0,063 Test Statistic 4,72 P-Value 0,035
F-Test
Lev ene's Test
Test for Equal Variances for Resistance N115 Not Activate
to the processes involved in the operation of a PEMFC, i.e.; areas with greater areas of SER generate energy losses for the electrons having contact with the Nafion membrane. These regions submit a higher temperature (hot spots) compared with areas of minor SER. Areas of hot spots could affect the speed of reaction by dehydration membrane and ionic conductivity of the electrolyte, therefore increase ohmic losses and low efficiency of the PEMFC.
a) b)
[image:15.612.81.539.167.483.2]d) c)
Figure 13. Test for equal variances for SER on N115 activated in the a) first, b) second, c) Third and fourth quadrants by both sides.
4. CONCLUSIONS
The results show the heterogeneity of electrical resistance on the surface of the membrane Nafion 115 membrane for both treatments (activated and not). There is evidence to 95% of superficial changes in the reliability of the variable response after the chemical treatment in the N115 membrane, particularly the SER decreases by 10% during the activation process forming zones with different values and SER distant one another. The activation stages affect the increase in volume and water absorption at different magnitude on the N115 membrane. The statistical inference results show in general, a non homogeneous surface for electrical resistance presenting divers average values for resistance in those areas other than the N115 membrane and even on both sides of the membrane, this behavior being attributable to the structural random diversity in the Nafion membrane as expressed in
Resis B R esis A
500000 400000 300000 200000 100000 0
95% Bon fe rron i C onfi de nce Inte rvals for S tD e vs
Resis B R esis A
3000000 2500000
2000000 1500000
D ata
Test S tatistic 0,01 P - Valu e 0,000 Test S tatistic 1,14 P - Valu e 0,290
F - Test
Lev en e's Test
Test fo r Equal Variances fo r Resistance fo r N115 Activate
Quadrant I, Side A and B
Resis B R esis A
40000 35000 30000 25000 20000
95 % Bon fe rron i C on fi de n ce Inte rvals fo r S tD e vs
Resis B R esis A
1350000 1340000 1330000 1320000 1310000 1300000 D ata
Test S tatistic 0,73 P - Valu e 0,447 Test S tatistic 0,34 P - Valu e 0,560
F -Test
L ev en e's Test
Test fo r Equal V ariances fo r R esistance fo r N 115 Activate
Quadrant II, Side A and B
Res is B Resis A 1400000 1200000 1000000 800000 600000 400000 200000 0
95% Bonfe rron i Con fide n ce In te rval s for S tD e vs
Res is B Resis A 4000000 3500000 3000000 2500000 2000000 1500000 1000000 D ata
Test Statistic 157,99 P -Valu e 0,000 Test Statistic 13,65 P -Valu e 0,001
F - Test
Lev en e's Test
Test fo r Equal V ariances fo r Resistance fo r N 115 Activate
Quadrant IV , Side A and B
Resis B R esis A
400000 300000
200000 100000
0
95% B onfe rroni C on fi de n ce Inte rval s for S tD e vs
Resis B R esis A
1550000 1500000 1450000 1400000 1350000 1300000 D ata
Test S tatistic 35,59 P -Valu e 0,000 Test S tatistic 0,28 P -Valu e 0,599
F - Test
Lev en e's Test
Test fo r Equal Variances fo r R esistance fo r N 115 A ctivat
the literature. Particularly, the total statistical inference results (average and variance) show a zoning of the area regarding its electrical resistance surface, these areas are also a random structure as proposed by Rubatat and colleagues [18]. The superficial diversity in electrical resistance suggest an important effect on the functionality of the PEMFC directly on increasing ohmic lost in the interfaces electrolyte - catalyst – carbon at the electrode – membrane assembly.
References
1. F.C. Wilson, R. Longworth and D. J. Vaughan. Polymer 9 (1968) 21 2. A. Eisenberg. Macromolecules 3 (1970)147
3. C. Heitner-Wirguin. Journal of Membrane Science 120 (1996) 1 4. K. A. Mauritz, R. B. Moore. Chemical Review 104(2004) 4535
5. R. Mosdale R. « Etude et développement d’une pile à combustible hydrogène / oxygène en technologie électrolyte polymère solide », Thèse Doctorale de l’INPG 1992.
6. H. L. Yeager and A. Steck. J. Electrochem. Soc. 128 (1981) 1880 7. P. Costamagna and S. Srinivasan. J. of Power Sources 102 (2001) 242
8. T. D. Gierke, G. E. Munn, F. C. Wilson. J. Polymer Sci.: Polymer Phys 19 (1981) 1687 9. W. Y. Hsu and T. D. Gierke. Macromolecules 15 (1982) 101.
10.W. Y. Hsu and T. D. Gierke. J. Membrane Sci., 13 (1983) 307. 11.R. A. Register and S. L. Cooper. Macromolecules, 25 (1990) 318.
12.E. M. Lee, R. K. Thomas, A. N. Burgess, D. Y. Barnes, A. K. Soper, and A. R. Rennil. Macromolecules 25 (1992) 3106.
13.G. Xu. Polymer, 25 (1993) 397.
14.T. Xue. Y. S. Trent and K. Osseo-Asare. J. Membrane Sci., 45 (1989) 261. 15.S. Rieberger and K. H. Norian. Ultramicroscopie 41 (1992) 225.
16.S. Kumar, M. Pineri. J. Mol. Sci. : Polymer Phys 24 (1986) 1767
17.M. Bautista. “Etude des phénomènes de transfert et transport dans une pile à combustible PEMFC en fonctionnement”, Thèse de l’INPG 2004.
18.L. Rubatat, A – L. Rollet, G. Gebel and O. Diat. Macromolecules 35 (2002) 4050 19.G. Gebel. Polymer 41(2000) 5829
20.P. Costamagna, S. Srinivasan. J. of Power Sources 102 (2001) 242. 21.P. Costamagna. Chemical engineering science 56 (2001) 323 22.F. R. Kalhammer. Solid State Ionics 135 (2000) 315
23.C. Moisés Bautista-Rodríguez, Araceli Rosas-Paleta, Andrés Rodríguez-Castellanos, J. Antonio Rivera-Márquez, Omar Solorza-Feria, J. Antonio Guevara-Garcia, J. Ignacio Castillo-Velázquez., Int. J. Electrochem. Sci., 2 (2007) 820
24. D. L. WOOD III, S. Y. Jung and T. V. Nguyen. Electrochimica Acta, 43 (1998) 3795. 25. A. V. Anantaraman, G. L. Gardner. J. Electroanal. Chem 414(1996) 115-120.
26.C. K. Nguy. « Elaboration des membranes composites alternatives au Nafion pour piles à combustible H2-O2», DEA de l’INPG (1996)
27. K. B. Prater. J. Power Sources 51(1994) 129.
28.G. Pourcelli, A. Oikonomen., C. Gavach and H. D. Hurwitz. J. Electroanal. Chem. 259 (1989) 113
29.B. Tazi, O. Savadogo. Electrochimica Acta 45 (2000) 4329.
31.D. C. Montgomery and G. C. Runder. Applied statistics and probability for engineers, 2nd edition, Ed. Limusa & Wiley, 2007, USA.
32.D. C. Montgomery and G. C. Runder. Design and Analysis of Experiments, 2nd edition, Ed. Limusa & Wiley, 2007, USA.
![Figure 1. Structural model of Nafion membrane [5].](https://thumb-us.123doks.com/thumbv2/123dok_us/1943419.154443/2.612.223.377.554.691/figure-structural-model-of-nafion-membrane.webp)
![Figure 2. Cluster-Network model for the morphology of hydrated Nafion [3].](https://thumb-us.123doks.com/thumbv2/123dok_us/1943419.154443/3.612.178.418.70.205/figure-cluster-network-model-morphology-hydrated-nafion.webp)
![Figure 3. Schematic representation of an entangled network of elongated rodlike aggregates in Nafion [3]](https://thumb-us.123doks.com/thumbv2/123dok_us/1943419.154443/4.612.201.405.337.483/figure-schematic-representation-entangled-network-elongated-rodlike-aggregates.webp)