R E S E A R C H A R T I C L E
Open Access
Practical utility of general practice data
capture and spatial analysis for
understanding COPD and asthma
T. Niyonsenga
1,4*, N. T. Coffee
1,4†, P. Del Fante
2,4†, S. B. Høj
3,4†and M. Daniel
1,4,5†Abstract
Background:General practice-based (GP) healthcare data have promise, when systematically collected, to support estimating local rates of chronic obstructive pulmonary disease (COPD) and asthma, variations in burden of disease, risk factors and comorbid conditions, and disease management and quality of care. The use of GP information systems for health improvement has been limited, however, in the scope and quality of data. This study assessed the practical utility of de-identified clinical databases for estimating local rates of COPD and asthma. We compared COPD and asthma rates to national benchmarks, examined health related risk factors and co-morbidities as correlates of COPD and asthma, and assessed spatial patterns in prevalence estimates at the small-area level.
Methods:Data were extracted from five GP databases in western Adelaide, South Australia, for active patients residing in the region between 2012 and 2014. Prevalence estimates were computed at the statistical area 1 (SA1) spatial unit level using the empirical Bayes estimation approach. Descriptive analyses included summary statistics, spatial indices and mapping of geographic patterns. Bivariate associations were assessed, and disease profiles investigated to ascertain multi-morbidities. Multilevel logistic regression models were fitted, accounting for individual covariates including the number of comorbid conditions to assess the influence of area-level socio-economic status (SES).
Results:For 33,725 active patients, prevalence estimates were 3.4% for COPD and 10.3% for asthma, 0.8% higher and 0.5% lower for COPD and asthma, respectively, against 2014–15 National Health Survey (NHS) benchmarks. Age-specific
comparisons showed discrepancies for COPD in the‘64 years or less’and‘age 65 and up’age groups, and for asthma in the ‘15–25 years’and‘75 years and up’age groups. Analyses confirmed associations with individual-level factors, co-morbid conditions, and area-level SES. Geographic aggregation was seen for COPD and asthma, with clustering around GP clinics and health care centres. Spatial patterns were inversely related to area-level SES.
Conclusion:GP-based data capture and analysis has a clear potential to support research for improved patient outcomes for COPD and asthma via knowledge of geographic variability and its correlates, and how local prevalence estimates differ from NHS benchmarks for vulnerable age-groups.
Keywords:COPD and asthma, General practice capture data, Chronic disease management, Improved research quality data, Spatial analysis
* Correspondence:[email protected]
†N. T. Coffee, P. Del Fante, S. B. Høj and M. Daniel contributed equally to this
work.
1Centre for Research and Action in Public Health, Health Research Institute, Faculty of Health, University of Canberra, Canberra, Australian Capital Territory, Australia
4Centre for Population Health Research, School of Health Sciences, University of South Australia, Adelaide, South Australia, Australia
Full list of author information is available at the end of the article
Background
Chronic Obstructive Pulmonary Disease (COPD) is a pro-gressive condition that affects the respiratory and circula-tory systems, and is most often caused by the inhalation of noxious particulates or gases which in turn stimulate an ab-normal inflammatory response from the airways and the lungs [1–4]. Asthma, on the other hand, is a common chronic disorder of the airways which is complex with variable and recurring symptoms of airflow obstruction, bronchial hyper-responsiveness, and an underlying inflam-mation [5]. It is characterised by reversible (or partly revers-ible) intermittent or chronic airway inflammation and respiratory symptoms such as wheezing, shortness of breath, chest tightness, and coughing which vary over time and in intensity [1–4]. Both COPD and asthma can co-exist in the same patient posing diagnostic and therapeutic chal-lenges. This correspondence has been recognized by a joint committee of the Global Initiative for Chronic Obstructive Lung Disease (GOLD) and the Global Initiative for Asthma (GINA) as the “asthma-COPD overlap” (ACO) syndrome. While there remains controversy as to whether this overlap constitutes a syndrome [2–4,6], important features distin-guish typical COPD from typical asthma. For example, people with COPD continue to lose lung function despite taking medication, not a common feature of asthma [7]. People with COPD and/or asthma rate their health worse than people without these conditions [7, 8]. In the later stages of COPD, the inflammatory response interferes with normal breathing patterns and exercise tolerance, resulting in poor quality of life and dependence on community and carer support [8, 9]. Disease management is difficult and hospitalisation for episodes of acute illness is common, with longer duration of admissions compared to other chronic conditions [10]. Despite declining mortality rates for asthma and COPD in Australia [11], the asthma death rate remains high compared with many other countries while COPD is a leading cause of death both domestically and internationally [12]. Both COPD and asthma are potentially preventable hospitalisation conditions, with COPD the sec-ond leading cause of avoidable hospital admissions [13].
Geographically varying socio-economic correlates and risk factors exist for COPD and asthma, including genetic disposition, behavioural and environmental factors [1, 14,
15]. Most of the people develop COPD through environ-mental exposures to air pollutants and deleterious gases, particularly, the exposure to tobacco smoke including sec-ond hand smoke. Other significant and spatially varying en-vironmental sources include emissions from local industries, proximity to major roads and heavy traffic, occu-pational exposures to dust, particularly among workers in coal mining or livestock farming [1, 14]. Early diagnosis and secondary prevention can be achieved through screen-ing and close monitorscreen-ing by general practitioners (GPs) [16–18]. But GPs often do not have the capacity to screen
for patients at risk and, consequently, most of cases are de-tected in the latter stages of the disease when symptoms be-come pronounced and/or begin to impair patient’s quality of life [19, 20]. This situation presents an opportunity for improvement as, in Australia, 75% of all medical consulta-tions take place in GP’s offices, and more than 85% of the population access a GP each year [21]. Providing GPs with the knowledge of what the rates of COPD and asthma are in their local area, the levels of risk in the local community, and the characteristics of patient catchment areas could en-able GPs to provide improved patient care [22–25].
COPD and asthma are exemplar conditions by which to illustrate how GP data capture and analysis can aid in un-derstanding the local features of important diseases and pertinent care. GP-based data can offer an important source of real-world information on the populations acces-sing practices, and local-area living conditions. Spatial ana-lyses of GP-based data can assist to better understand geographic distributions of patients’health status and out-comes, and inform local health services improvements. Thus far, however, the use of GP-based clinical information systems for data collection and health improvement has been limited in both extent and quality. Models such as the Practice Health Atlas (PHA) have been used to develop a professional culture around quality health data [26] and platforms such as the Bettering the Evaluation and Care of Health (BEACH) and the Melbourne East Monash General Practice Database (MAGNET) have been developed to pro-vide unique and high-quality GP research databases [27,
28]. These models should be extended to the entire Austra-lian GP body to unlock the potential of high-quality GP data for high-quality research contributing to improved local and global patients’health outcomes [24,26–28].
Methods Source of data
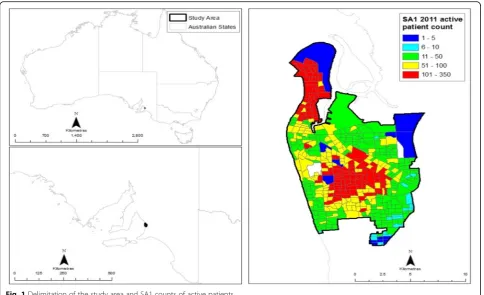
Data were extracted from five “sentinel” GP practices participating in the Medicare Local GP-based data im-provement program in the western area of Adelaide, South Australia, including the LeFevre Peninsula and its closest surrounding areas. Figure1displays the study re-gion according to the Australian Bureau of Statistics (ABS) census unit, statistical area 1 (SA1) [30]. “ Senti-nel” GP practices were chosen for the availability of higher-quality GP data and the need to understand population factors related to chronic disease. Analyses were restricted to “active” patients living within the study area and seen by their GP between 2012 and 2014. An“active”patient was defined per the Royal Australian College of General Practitioners (RACGP) criterion as one who attended the practice three times or more within the past two years [31].
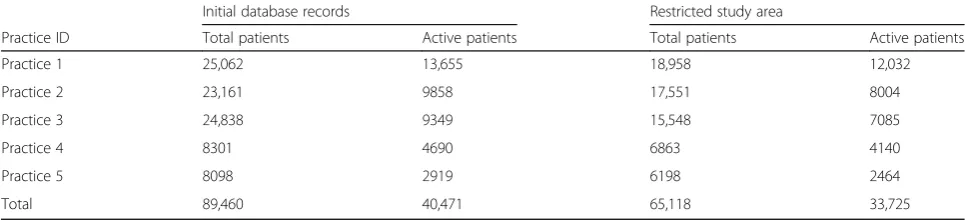
GP clinical data from this region have previously been used to examine spatial variation of cardiovascular disease at small geographic area levels and to estimate community level prevalence of undiagnosed diabetes [32, 33]. There were 486 SA1s in the study area. Table 1 below presents the five practices included in the analysis and their respect-ive records of total and actrespect-ive patients within the study area. There were 33,725 active patients who visited GP practices with 3 progress notes recorded. The de-identified
GP clinical records included the risk factors age, sex, smok-ing status, Aboriginal or Torres Strait Islander status (ATSI), and marital status. Respiratory health conditions under study (outcome variables) were COPD, asthma, and ACO. Recorded comorbidities included type 2 diabetes, heart failure, stroke, peripheral vascular disease, mental dis-order, dementia and osteoarthritis/osteoporosis. Variables relating to respiratory health conditions, risk factors and comorbidities were coded in accordance with value domain attributes listed on the Australian Institute of Health and Welfare (AIHW) Metadata Online Registry (Meteor). Re-spiratory health conditions were classified as“active”if ac-tive at the time of the extract; “inactive” and “never diagnosed”conditions were combined and classified as the absence of a condition. The classification of active COPD was satisfied by a record of either active respiratory COPD or active chronic obstructive airways disease. Finally, the 2011 census index of relative socio-economic disadvantage (IRSD), one of the socio-economic index of areas (SEIFA) variants, was obtained from the Australian Bureau of Statis-tics (ABS) [34].
The 2014–15 National Health Survey (NHS), the most recent in a series of Australia-wide health surveys con-ducted by the ABS, provided information on national prevalence estimates of chronic respiratory conditions by pre-defined age groups [7]. The NHS was designed to col-lect a range of information about the health of Australians,
[image:3.595.57.542.87.382.2]including: prevalence of long-term health conditions; health risk factors such as smoking, overweight and obesity, alco-hol consumption and exercise; use of health services such as consultations with health practitioners and actions people have recently taken for their health; and demo-graphic and socio-economic characteristics.
Both prevalence rates and standardised prevalence ratios (SPR) of COPD and asthma were calculated by SA1 geo-graphic areas. Prevalence estimates were adjusted for the number of active patients in each SA1 using the empirical Bayes estimation approach [35]. SPRs were computed as the ratio of observed to expected number of cases in each area, where the expected number of cases was determined ac-cording to the age distribution of patients within each SA1. Specifically, expected levels of risk were attributed to pa-tients based on their age groups: 0–14, 15–24, 25–34, 35– 44, 45–54, 55–64, 65–74, 75–84 and 85+, and associated na-tionwide estimates of asthma and COPD risks for these age groups from 2014 to 15 NHS data [7]. Expected risk was then summed across all patients in the SA1 to determine the expected number of cases. These SPRs were purposively calculated to highlight under- or over-diagnosed areas. Area-level prevalence and SPRs estimates were mapped to highlight the geographic variation of COPD and asthma.
Descriptive and inferential analyses
Descriptive analyses consisted of summary statistics, spatial indices (for spatial clustering) and mapping of geo-graphical patterns. Summary statistics included descriptive statistics pertaining to: (1) the prevalence of diagnosed re-spiratory health conditions (COPD, asthma, and ACO) among active patients in the study area; and (2) the preva-lence of these diagnosed respiratory conditions across dis-tinct age groups, benchmarked against NHS data for the years 2014–15 [7]. Bivariate associations between these di-agnosed respiratory conditions and individual risk factors and comorbidities were assessed, and between-group dif-ferences tested for statistical significance using Pearson’s chi-square test or Fisher’s exact test where observed cell numbers were small. Chronic disease profiles were investi-gated for multi-morbidities and a multi-morbidity matrix
that reflected the number and percentage of patients with co-occurring conditions was calculated.
To assess whether area-level SES, measured by SEIFA-IRSD, was related to COPD and asthma preva-lence rates, multilevel logistic regression models of ac-tive COPD and asthma among patients nested within SA1s were performed (for inferential analysis [36]), ac-counting for basic individual socio-demographic covari-ates (age, sex, smoking status, marital status and ATSI) and the number of comorbid conditions. All covariates were categorical, except age which was modelled as a standardized continuous variable. Linear and quadratic age terms were incorporated in the models.
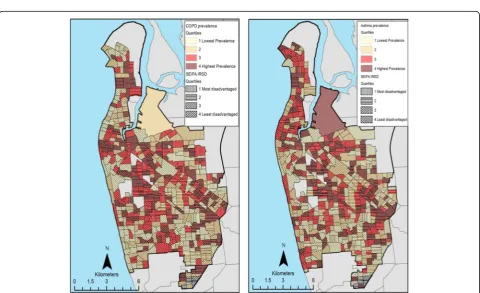
Distributions of COPD and asthma cases were mapped and the degree to which cases were clustered spatially (spatial autocorrelation,‘Hot’and‘cold’spots) was assessed using indices of spatial associations. Global Moran’s I (for spatial autocorrelation) and local Getis-Ord’s Gi* (for hot or cold spots) indices were computed [37, 38]. Bivariate choropleth maps of COPD and asthma prevalence against SEIFA-IRSD were created to visualise the extent of geo-graphic overlap in spatial clustering patterns of each measure at the SA1 level. SEIFA-IRSD and estimated prevalence values were, for each variable, split into quartiles, and then the variables were overlayed to indicate regions of high prevalence/high disadvantage, low preva-lence/low disadvantage, etc.
Results
Descriptive analysis
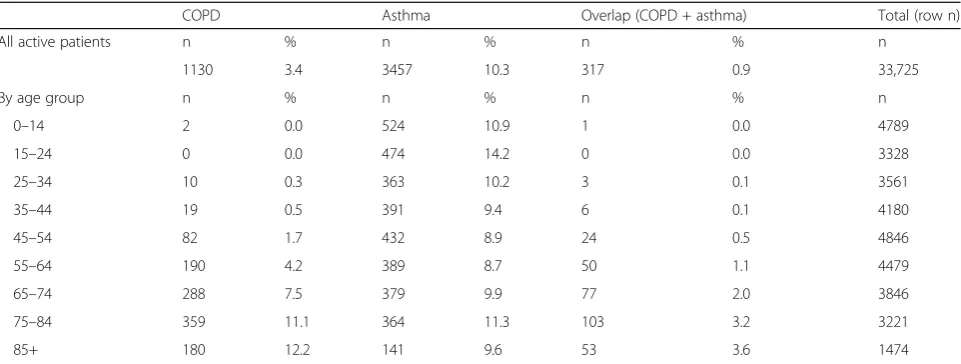
[image:4.595.56.539.111.221.2]Overall observed prevalence estimates were 3.4, 10.3 and 0.9% for COPD, asthma and ACO respectively (Table 2). As expected, COPD was more prevalent in the 55 years and over group (7.8%) while asthma was more prevalent in the up to 34 years group (11.7%). At the practice level, overall prevalence estimates for COPD and asthma were less than national self-reported prevalence benchmarks (2.6 and 10.8% for COPD and asthma respectively) at one (COPD) and three (asthma) of the five practices analysed (Tables 3 and 4). Con-versely, more COPD cases than expected were observed
Table 1Counts of total patients and active patients recorded by each practice in the initial database and restricted to residents of the study area
Initial database records Restricted study area
Practice ID Total patients Active patients Total patients Active patients
Practice 1 25,062 13,655 18,958 12,032
Practice 2 23,161 9858 17,551 8004
Practice 3 24,838 9349 15,548 7085
Practice 4 8301 4690 6863 4140
Practice 5 8098 2919 6198 2464
at one of the five practices analysed, and more asthma cases than expected at two of the five (Tables 3and4). Overall SPR values were 0.92 and 0.96 for COPD and asthma respectively, indicating both COPD and asthma under-diagnosis from GP data.
Although data from these “sentinel” GP practices indi-cated a 0.8% higher overall rate of COPD and a 0.5% lower overall rate of asthma (compared to national benchmarks), prevalence estimates were lower than the benchmark be-fore age 65 (0.6% lower for those aged 15–24, and 1.0% lower for those aged 35–44) but higher than the bench-mark for age 65 years and over (0.5, 2.2 and 2.1% higher for the age groups 65–74, 75–84 and 85+) for COPD (Fig.2a). For asthma, prevalence estimates in those aged 15–24 and 85+ were 3.4 and 2.5% higher, respectively, than the bench-mark. On the other hand, asthma under-diagnosis was ap-parent between age 25 and 74 years, up to 3.7% lower for those aged 55–64 years (Fig.2b).
COPD, asthma, risk and/or comorbid conditions
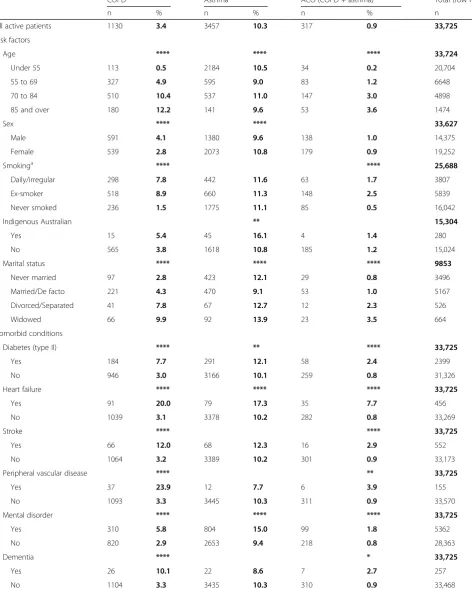
Differences in prevalence estimates for active respira-tory conditions for patients defined according to their status on a given risk factor, or the presence/absence of another health condition, highlight the magnitude of association between COPD and asthma with risk factors and comorbid conditions (Table 5). Analyses
of COPD generally yielded strong statistically signifi-cant associations with known individual-level factors and comorbid conditions (all p-values < 0.0001), ex-cept for ATSI status. For asthma, prevalence rates were statistically significantly different across levels of individual-level characteristics, except smoking status. Asthma prevalence rates also differed significantly in relation to examined comorbid conditions, except for peripheral vascular disease, stroke and dementia for which associations were statistically non-significant.
Within the five GP practices, 50.7% of patients had at least one chronic condition, and 21.1% at least two conditions. For patients with COPD, 83.7% had at least two additional chronic conditions including asthma. For patients with asthma, 59.8% had at least two additional chronic conditions including COPD. As shown in Table 6, prevalent co-occurring chronic conditions among patients with COPD included osteoarthritis/osteoporosis (48.7%), asthma (28.1%) and mental health disorder (27.4%). For co-occurring chronic conditions with asthma, besides COPD-asthma, the most frequent condition was mental health disorder (23.3%) followed by osteoarthritis/osteoporosis (22.4%).
[image:5.595.58.539.98.280.2]Among patients aged 55 years and over (of whom 7.8% were diagnosed with COPD, and 9.8% with asthma), 72.2% had at least one other chronic condition and, 84.5% of COPD patients and 86.3% of asthma patients
Table 2Prevalence of active COPD, asthma, and combined asthma-COPD overlap among active patients in the study area
COPD Asthma Overlap (COPD + asthma) Total (row n)
All active patients n % n % n % n
1130 3.4 3457 10.3 317 0.9 33,725
By age group n % n % n % n
0–14 2 0.0 524 10.9 1 0.0 4789
15–24 0 0.0 474 14.2 0 0.0 3328
25–34 10 0.3 363 10.2 3 0.1 3561
35–44 19 0.5 391 9.4 6 0.1 4180
45–54 82 1.7 432 8.9 24 0.5 4846
55–64 190 4.2 389 8.7 50 1.1 4479
65–74 288 7.5 379 9.9 77 2.0 3846
75–84 359 11.1 364 11.3 103 3.2 3221
[image:5.595.58.540.626.725.2]85+ 180 12.2 141 9.6 53 3.6 1474
Table 3Prevalence and standardised prevalence ratios of COPD by medical practice
Active patients Observed cases Expected cases Prevalence (=O/A*100%) SPR (=O/E)
Practice 1 12,032 374 409 3.1 0.91
Practice 2 8004 345 290 4.3 1.19
Practice 3 7085 243 269 3.4 0.90
Practice 4 4140 103 154 2.5 0.67
Practice 5 2464 65 77 2.6 0.84
Total 33,725 1130 1228 3.4 0.92
had at least two additional conditions. Prevalent pairs of co-occurrence conditions were asthma-osteoarthritis/ osteoporosis (53.7%) and COPD-osteoarthritis/osteopor-osis (51.9%), followed by asthma-mental health disorder (29.3%) and COPD-asthma (29.3%) (Table7).
COPD, asthma and SEIFA - index of relative social disadvantage
Results of multilevel models to assess the effects of area-level SES (SEIFA-IRSD) on COPD and asthma
[image:6.595.57.539.99.197.2]prevalence rates, adjusting for patient characteristics, are presented in Tables 8 and 9. The unadjusted model of COPD and area-level SES relationships exhibited a sig-nificant negative gradient from the least (Q4) to the most (Q1) disadvantaged quartile groups. This gradient was also observed in the adjusted model, where the esti-mated risk of COPD among patients residing in the most disadvantaged SA1s (Q1) was 1.67 times greater than that of patients in least disadvantaged SA1s (OR = 1.670; 95% CI: 1.168–2.387). These patients (from SA1s
Table 4Prevalence and standardised prevalence ratios of asthma by medical practice
Active patients Observed cases Expected cases Prevalence (=O/A*100%) SPR(=O/E)
Practice 1 12,032 1320 1297 11.0 1.02
Practice 2 8004 815 855 10.2 0.95
Practice 3 7085 828 753 11.7 1.10
Practice 4 4140 332 440 8.0 0.76
Practice 5 2464 162 266 6.6 0.61
Total 33,725 3457 3605 10.3 0.96
Note:SPRStandardised prevalence ratio
A
B
[image:6.595.59.539.353.703.2]Table 5Respiratory conditions within risk factors/comorbidities groups (count & prevalence)
COPD Asthma ACO (COPD + asthma) Total (row n)
n % n % n % n
All active patients 1130 3.4 3457 10.3 317 0.9 33,725
Risk factors
Age **** **** **** 33,724
Under 55 113 0.5 2184 10.5 34 0.2 20,704
55 to 69 327 4.9 595 9.0 83 1.2 6648
70 to 84 510 10.4 537 11.0 147 3.0 4898
85 and over 180 12.2 141 9.6 53 3.6 1474
Sex **** **** 33,627
Male 591 4.1 1380 9.6 138 1.0 14,375
Female 539 2.8 2073 10.8 179 0.9 19,252
Smokinga **** **** 25,688
Daily/irregular 298 7.8 442 11.6 63 1.7 3807
Ex-smoker 518 8.9 660 11.3 148 2.5 5839
Never smoked 236 1.5 1775 11.1 85 0.5 16,042
Indigenous Australian ** 15,304
Yes 15 5.4 45 16.1 4 1.4 280
No 565 3.8 1618 10.8 185 1.2 15,024
Marital status **** **** **** 9853
Never married 97 2.8 423 12.1 29 0.8 3496
Married/De facto 221 4.3 470 9.1 53 1.0 5167
Divorced/Separated 41 7.8 67 12.7 12 2.3 526
Widowed 66 9.9 92 13.9 23 3.5 664
Comorbid conditions
Diabetes (type II) **** ** **** 33,725
Yes 184 7.7 291 12.1 58 2.4 2399
No 946 3.0 3166 10.1 259 0.8 31,326
Heart failure **** **** **** 33,725
Yes 91 20.0 79 17.3 35 7.7 456
No 1039 3.1 3378 10.2 282 0.8 33,269
Stroke **** **** 33,725
Yes 66 12.0 68 12.3 16 2.9 552
No 1064 3.2 3389 10.2 301 0.9 33,173
Peripheral vascular disease **** ** 33,725
Yes 37 23.9 12 7.7 6 3.9 155
No 1093 3.3 3445 10.3 311 0.9 33,570
Mental disorder **** **** **** 33,725
Yes 310 5.8 804 15.0 99 1.8 5362
No 820 2.9 2653 9.4 218 0.8 28,363
Dementia **** * 33,725
Yes 26 10.1 22 8.6 7 2.7 257
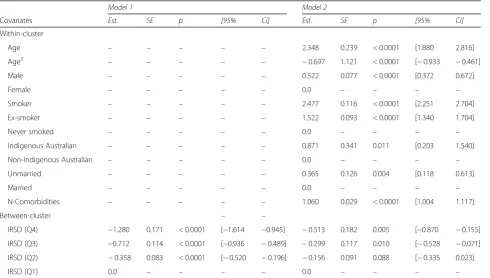
in Q1) faced also a risk of COPD 1.169 times greater than patients from SA1s in Q2 (OR = 1.169; 95% CI: 0.977–1.398), although this association was at the bor-derline of statistical significance (Table 8). The adjusted model additionally confirmed the importance of individual-level covariates on the prevalence of COPD, especially the number of comorbid conditions as well as age, sex and smoking status.
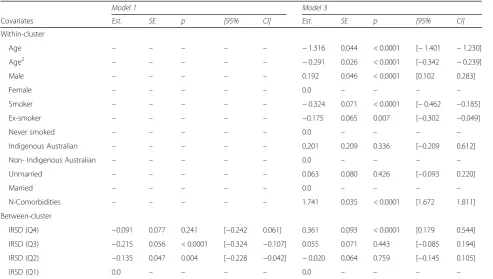
For asthma and area-level SES relationships, the un-adjusted model resulted in a non-linear negative trend, whereby the comparison of the least (Q4) to the most (Q1) disadvantaged quartile groups was not statistically significant as might be expected from pre-vious studies (Table 9). As shown in the model adjusting for individual-level covariates and numbers of comorbid conditions, this negative trend was re-versed when comparing the fourth and third quartile groups (Q4, Q3) to the most disadvantaged (Q1) group. Only the comparison of the least (Q4) to the most (Q1) disadvantaged quartile groups was statisti-cally significant, with the prevalence of asthma 1.44 times greater in the least disadvantaged SA1s (Q4) compared to the most disadvantaged SA1s (OR = 1.435; 95% CI: 1.196–1.723) (Table 9). The adjusted model confirmed the importance of individual-level covariates other than ATSI and marital status,
particularly the number of comorbid conditions which exerted a strong influence and was responsible for the shift from the negative non-linear trend observed in the non-adjusted model.
Spatial patterns of COPD, asthma and SEIFA - index of relative social disadvantage
Both COPD and asthma cases were not randomly dis-tributed throughout the study region, but exhibited degrees of geographic aggregation. For COPD, low prevalence values were observed for western coastal areas, with some pockets of high prevalence. High prevalence areas were observed for northern regions, towards the east to the periphery of the central busi-ness district, and in the south, close to the airport (Fig. 3). For asthma diagnoses, areas with high preva-lence values were observed in the northern region and the northwest-southeast axis of the study region. The southwest, south and southeast regions had low prevalence values in general, but these were punctu-ated with pockets of high prevalence (Fig. 3).
[image:8.595.58.537.99.167.2]Both COPD and asthma prevalence values exhibited global and local spatial relationships. The Moran’s I statis-tic for COPD (I= 0.033,p= 0.002) indicated a positive and statistically significant spatial autocorrelation (small-scale variation) with the clustering of one large hot spot, two
Table 5Respiratory conditions within risk factors/comorbidities groups (count & prevalence)(Continued)
COPD Asthma ACO (COPD + asthma) Total (row n)
n % n % n % n
Osteoarthritis/ osteoporosis **** **** **** 33,725
Yes 550 9.7 776 13.6 189 3.3 5698
No 580 2.1 2681 9.6 128 0.5 28,027
Note: Pearson Chi-square test:* p < 0.05, ** p < 0.01, *** p < 0.001, **** p < 0.0001;Mental disorder: any active anxiety, depression or bipolar disorder; Row totals do not always add to the total number of active patients due to missing data;a
Missing data on smoking within active COPD (n =78, 6.9%);asthma (n= 580, 17%); ACO(n =21, 6.6%)
Stars (***) inside Table 5 indicate the levels of the Pearson Chi-square test p-values (p); *:p< 0.05; **:p< 0.01; ***:p< 0.001; ****:p< 0.0001
Table 6Percentage of patients with an active condition (rows) that also have an additional active condition (columns)
Condition B
Condition A Row n Row % COPD Asthma OA/Osteo Mental Diabetes Stroke Heart fail Dementia PVD
COPD 1130 3.35 100 28.1 48.7 27.4 16.3 5.84 8.05 2.30 3.27
Asthma 3457 10.3 100 22.4 23.3 8.42 1.97 2.29 0.64 0.35
OA/Osteo condition 5698 16.9 100 28.7 16.5 5.76 4.97 2.49 1.67
Mental disorder 5362 15.9 100 10.3 3.02 2.16 1.90 0.67
Diabetes type II 2399 7.11 100 5.42 4.50 2.25 2.00
Stroke 552 1.64 100 10.3 5.43 2.72
Heart failure 456 1.35 100 6.36 4.39
Dementia 257 0.76 100 2.72
PVD 155 0.46 100
Overall prevalence of Condition B 3.35 10.3 16.9 15.9 7.11 1.64 1.35 0.76 0.46
[image:8.595.56.539.559.724.2]very small-size hot spots and two relatively medium-size cold spots (Fig.4). For asthma prevalence, the Moran’s I statistic (I= 0.0178, p= 0.076) indicated positive global spatial relationship, but at the borderline of statistical sig-nificance. The clustering of high values (one medium-size hot spot) and low values (one relatively large cold spot) are illustrated in Fig.4.
[image:9.595.57.540.113.276.2]Geographic patterns of the index of relative social disad-vantage (SEIFA-IRSD) highlighted the coastal west and southwest region with relatively well-off areas with social disadvantage increasing towards the north, close to the peninsula and towards both the east and southeast regions (Fig.5). Overlaying choropleth maps of COPD and asthma prevalence rates with relative socio-economic disadvantage
Table 7Percentage of patients aged 55 years and over with an active condition (rows) that also have an additional active condition (columns)
Condition B
Condition A Row n Row % COPD Asthma OA/Osteo Mental Diabetes Stroke Heart fail Dementia PVD
COPD 1017 7.81 100 27.8 51.9 25.4 17.7 6.49 8.95 2.56 3.54
Asthma 1273 9.78 100 53.7 29.3 19.2 5.26 6.05 1.65 0.86
OA/Osteo condition 5105 39.2 100 27.4 17.7 6.39 5.45 2.76 1.84
Mental disorder 2618 20.1 100 17.6 5.77 4.35 3.86 1.38
Diabetes type II 2074 15.9 100 6.17 5.16 2.60 2.31
Stroke 527 4.05 100 10.8 5.50 2.85
Heart failure 442 3.40 100 6.56 4.52
Dementia 253 1.94 100 2.77
PVD 150 1.15 100
Overall prevalence of Condition B 7.81 9.78 39.2 20.1 15.9 4.05 3.40 1.94 1.15
Note–OA/Osteo conditionosteoarthritis or osteoporosis,Mental disorderany active anxiety,depression or bipolar disorder,PVDperipheral vascular disease
Table 8Multilevel logistic regression of active COPD
Model 1 Model 2
Covariates Est. SE p [95% CI] Est. SE p [95% CI]
Within-cluster
Age – – – – – 2.348 0.239 < 0.0001 [1.880 2.816]
Age2 – – – – – −0.697 1.121 < 0.0001 [−0.933 −0.461]
Male – – – – – 0.522 0.077 < 0.0001 [0.372 0.672]
Female – – – – – 0.0 – – – –
Smoker – – – – – 2.477 0.116 < 0.0001 [2.251 2.704]
Ex-smoker – – – – – 1.522 0.093 < 0.0001 [1.340 1.704]
Never smoked – – – – – 0.0 – – – –
Indigenous Australian – – – – – 0.871 0.341 0.011 [0.203 1.540]
Non-Indigenous Australian – – – – – 0.0 – – – –
Unmarried – – – – – 0.365 0.126 0.004 [0.118 0.613]
Married – – – – – 0.0 – – – –
N-Comorbidities – – – – – 1.060 0.029 < 0.0001 [1.004 1.117]
Between-cluster – –
IRSD (Q4) −1.280 0.171 < 0.0001 [−1.614 −0.945] −0.513 0.182 0.005 [−0.870 −0.155]
IRSD (Q3) −0.712 0.114 < 0.0001 [−0.936 −0.489] −0.299 0.117 0.010 [−0.528 −0.071]
IRSD (Q2) −0.358 0.083 < 0.0001 [−0.520 −0.196] −0.156 0.091 0.088 [−0.335 0.023]
IRSD (Q1) 0.0 – – – – 0.0 – – – –
[image:9.595.57.548.410.688.2]Table 9Multilevel logistic regression of active asthma
Model 1 Model 3
Covariates Est. SE p [95% CI] Est. SE p [95% CI]
Within-cluster
Age – – – – – −1.316 0.044 < 0.0001 [−1.401 −1.230]
Age2 – – – – – −0.291 0.026 < 0.0001 [−0.342 −0.239]
Male – – – – – 0.192 0.046 < 0.0001 [0.102 0.283]
Female – – – – – 0.0 – – – –
Smoker – – – – – −0.324 0.071 < 0.0001 [−0.462 −0.185]
Ex-smoker – – – – – −0.175 0.065 0.007 [−0.302 −0.049]
Never smoked – – – – – 0.0 – – – –
Indigenous Australian – – – – – 0.201 0.209 0.336 [−0.209 0.612]
Non- Indigenous Australian – – – – – 0.0 – – – –
Unmarried – – – – – 0.063 0.080 0.426 [−0.093 0.220]
Married – – – – – 0.0 – – – –
N-Comorbidities – – – – – 1.741 0.035 < 0.0001 [1.672 1.811]
Between-cluster
IRSD (Q4) −0.091 0.077 0.241 [−0.242 0.061] 0.361 0.093 < 0.0001 [0.179 0.544]
IRSD (Q3) −0.215 0.056 < 0.0001 [−0.324 −0.107] 0.055 0.071 0.443 [−0.085 0.194]
IRSD (Q2) −0.135 0.047 0.004 [−0.228 −0.042] −0.020 0.064 0.759 [−0.145 0.105]
IRSD (Q1) 0.0 – – – – 0.0 – – – –
Notes–Age: age in years, standardised; Age2
: Age*Age. Smoker: daily, weekly or irregular smoker; Ex-smoker: does not smoke now, but has smoked≥100 cigarettes (or equivalent) in life time; Never smoked: does not smoke now, and has smoked < 100 cigarettes (or equivalent) in life time; Unmarried: never married, divorced, separated or widowed; Married: registered or de facto; N-Comorbidities: Number of comorbid conditions; IRSD: Index of Relative Social Disadvantage (ABS 2011); Q1-Q4: National quartile of IRSD (determined using cut-points for quartiles within the Australia-wide distribution of scores at SA1 level) where Q1: most disadvantaged, Q4: least disadvantaged
[image:10.595.59.539.469.714.2]Fig. 4Clustering of COPD and Asthma cases (Hot and cold spots)
[image:11.595.59.541.87.337.2] [image:11.595.58.539.419.712.2](Fig.5) confirmed the presence of relatively high prevalence rates of COPD and asthma in low SES areas, but did not show any specific trend as expected, on the basis of the in-verse linear relationship previously described.
Discussion
This analysis of GP-based data examined patients’ re-spiratory conditions and showcased the practical util-ity of these data for research to improve practitioners’ understandings of chronic disease, and the individual and geographic factors related to chronic disease and the potential application for improving health care practice and patient outcomes [26, 39]. Benchmarked with age-specific 2014–15 NHS estimates, GP-data re-vealed lower estimates for COPD up to 64 years, then higher estimates for age 65 and over. These high-risk age groups are more likely to be captured by GP practices than NHS data, as GPs will consider a diag-nosis of COPD for those patients with a history of exposure risk factors and comorbid conditions as rec-ommended by the guidelines [40, 41]. For other pa-tients, symptoms may appear non-specific and may be missed, resulting in under-diagnosis of COPD [42,
43]. In relation to asthma, the GP data revealed higher prevalence values in the 15–25 and 75+ age groups compared with the NHS-based estimates. In-deed, patients with childhood asthma may become asymptomatic, no longer require treatment, or be missed at diagnosis. However, those that might out-grow asthma could still develop asthma later on in their lives, being vulnerable.
These discrepancies may indicate a better under-standing of the real-world health status and outcomes that routine GP-practice based data offer as opposed to self-reported survey-based data. Knowledge of practice-based versus population discrepancies may also serve to raise GP awareness and vigilance when assessing respiratory symptoms, relevant not only to early detection, but to avoiding delayed detection and missed opportunities to prevent worsening disease outcomes [43, 44]. This may be especially important in age groups for whom the lower prevalence esti-mates of GP-based data compared with the NHS could indicate possible under-diagnosis. Finally, these research findings stand to assist GPs in continuing education for better management of patients’ multiple diseases and conditions, and in developing account-ability benchmarks that could improve patient care – provided these benchmarks focus on getting the best outcome for the patient, not simply meeting certain imposed targets for service delivery [23, 28, 45]. Al-though this is an idealistic expression of the concept of putting data back into GP-practices to improve pa-tients’ outcomes, given substantial differences between
guideline-based and GP-recorded management of asthma and COPD, this feedback of practice-relevant information could be a critical component of uptake of guidelines into daily practice and enhancement of support strategies available at multiple levels [22].
Other lessons derived from this GP-based data analysis pertain to the co-occurrence of COPD and asthma with other chronic conditions, especially COPD-osteoarthritis/ osteoporosis and COPD-mental health (similarly, asthma-osteoarthritis/osteoporosis and asthma-mental health) pairs. High rates of co-occurrence were ob-served among patients aged 55 and over, highlighting the extent of age-related burden managed by GPs in routine practice [46, 47]. High rates of co-occurrence were reported by Britt and Miller in 2013 with COPD being associated with two or more other chronic dis-eases in about 87.4% of patients aged 65 years and over [27]. Other studies have documented the sys-temic effects of COPD on mental health and the management of depressive symptoms or severe osteo-arthritis in patients with COPD [48, 49].
The geographic patterning of COPD and asthma preva-lence estimates with area-level SES has previously been re-ported [50]. SES (at both individual and area levels) has been linked to various health outcomes including asthma and COPD, with lower SES being associated with higher rates of morbidity and mortality [14,50–55]. In this study, there was a clear negative trend along the areal SES con-tinuum for COPD with clustering most likely being driven by the presence of health care services (hospitals and GP centres) [12,56]. This may be due to the population in the study area being mostly multicultural and within the lower range of SES, except the west coastal region. Moreover, moderate to severe COPD patients may choose to live closer to GP centres and local hospitals to improve access time.
The most obvious limitation of this study is the lack of GP data from other sub-regions in Western Adelaide plus the wider Adelaide metropolitan area, especially from areas with higher SES and including Adelaide CBD. This would have allowed for comparisons of areas with greater variability in SES and a greater extent of geographic distributions in prevalence estimates, given that allied health and other health services tend to be concentrated in inner urban areas and the CBD. A fur-ther limitation is a lack of data on clinical variables (e.g. spirometry) related to COPD and asthma severity and management, as well as the extent of referrals to special-ized services including community respiratory services and rehabilitation centres.
regions in other states or territories in Australia [57]. To some extent these lessons could be generalised, as most GP practices use computers and majority code diagnoses using a range of coding systems. All across Australia, via primary health networks, efforts have been applied at local level to improve the quality of GP recorded health data, as exemplified by the BEACH program data [27] and Magnet research platform data [28].
Further research is indicated to: clarify reasons for under-diagnosis and/or over-diagnosis of chronic re-spiratory conditions in primary care settings [25]; target disparities in chronic respiratory diseases and potential correlates, such as psychosocial stressors and built envir-onment factors [58–60]; and most importantly, highlight the net benefits of early detection on other patients’ out-comes such as quality of life, and other comorbid condi-tions [41,57,59].
Conclusion
GP-based research databases are vital to achieving im-proved understandings of factors that shape patient outcomes including COPD and asthma, the burden of disease and comorbid conditions, and levels of disease management and quality of health care achieved. Al-though based on a limited number of GP practices in a geographically specific area, our results highlight the practical utility of routine GP-based data for quality re-search that can guide GPs with regard to interventions including targeted screening and management to im-prove patient outcomes. Observed spatial patterns sug-gest that efforts to address inequalities in COPD and asthma, and their comorbid conditions, should account for the context of both practices and patient local con-texts as well as social and environmental barriers to change. This may require investment in continuing medical education for professionals, not only to in-crease their awareness and skills in COPD and asthma management and control including early diagnosis, but also to improve clinical coding for these conditions in GP practices.
Abbreviations
ABS:Australian Bureau of Statistics; ACO: Asthma-COPD Overlap syndrome; AIHW: Australian Institute of Health and Welfare; BEACH: Bettering the Evaluation and Care of Health; CBD: Central Business District; CI: Confidence Interval; COPD: Chronic Obstructive Pulmonary Disease; GINA: Global Initiative for Asthma; GOLD: Global Initiative for Chronic Obstructive Lung Disease; GP: General Practitioners; IRSD: Index of Relative Socio-economic Dis-advantage; MAGNET: Melbourne East Monash General Practice Database; Meteor: Metadata Online Registry; NHS: National Health Survey; OR: Odds Ratio; PHA: Practice Health Atlas; Q1-Q4: Quartiles; RACGP: Royal Australian College of General Practitioners; SA1: Statistical Area 1; SEIFA: Socio-Economic Index of Areas; SES: Socio-Socio-Economic Status; SPR: Standardised Prevalence Ratio
Acknowledgements
The authors acknowledge contributions to and support of this research from Ian McRae and Paul Konnings at the Australian Primary Health Care Research
Institute, Australian National University as well as Debbie Stratford, Data Analyst, at Healthfirst Network, South Australia.
Funding
This research was supported by a grant from the Australian Primary Health Care Research Institute and the Australian National University. The funders had no role in the study design and collection, analysis, and interpretation of data and in writing the manuscript. The views expressed in this publication are the sole responsibility of the authors.
Availability of data and materials
The datasets generated and/or analysed during the current study are not publicly available because they are subject to the South Australian Personal Information Protection Act laws. However, the data and materials are available from the corresponding author on reasonable request.
Authors’contributions
MD, PDF and NTC conceived and designed the research project. NTC constructed environmental measures used for this study and performed spatial analysis and mapping. SBH and TN undertook initial statistical analyses of the data. TN completed the analyses and drafted the manuscript. PDF, MD and NTC contributed to the interpretation of results and revised the manuscript critically for important additional intellectual content. All the authors approved the final manuscript.
Ethics approval and consent to participate
This study was approved by the Institutional Review Board of the University of South Australia (Protocol no. 0000034329“Is COPD associated with socio-economic status and the built environment?”).
Consent for publication
As this manuscript contains no individual personal data, this section is not applicable.
Competing interests
The authors declare that they have no competing interests.
Publisher’s Note
Springer Nature remains neutral with regard to jurisdictional claims in published maps and institutional affiliations.
Author details 1
Centre for Research and Action in Public Health, Health Research Institute, Faculty of Health, University of Canberra, Canberra, Australian Capital Territory, Australia.2Healthfirst Network, Adelaide, South Australia, Australia. 3Centre de Recherche du Centre Hospitalier de l’Université de Montréal (CRCHUM), Montreal, Quebec, Canada.4Centre for Population Health Research, School of Health Sciences, University of South Australia, Adelaide, South Australia, Australia.5Department of Medicine, St Vincent’s Hospital, The University of Melbourne, Melbourne, Victoria, Australia.
Received: 24 August 2018 Accepted: 14 November 2018
References
1. McKenzie D, Abramson M, Crockett A, Glasgow N, Jenkins S, McDonald C, Wood-Baker R, Frith P, on behalf of The Australian Lung Foundation. The COPD-X Plan: Australian and New Zealand Guidelines for the management of Chronic Obstructive Pulmonary Disease 2011. Queensland: Australian Lung Foundation; 2011. In.; 2012
2. Vogelmeier CF, Criner GJ, Martinez FJ, Anzueto A, Barnes PJ, Bourbeau J, Celli BR, Chen R, Decramer M, Fabbri LM. Global strategy for the diagnosis, management, and prevention of chronic obstructive lung disease 2017 report. GOLD executive summary. Am J Respir Crit Care Med. 2017;195(5): 557–82.
4. Reddel HK. Treatment of overlapping asthma–chronic obstructive pulmonary disease: can guidelines contribute in an evidence-free zone? J Allergy Clin Immunol. 2015;136(3):546–52.
5. National Heart, Lung, and Blood Institute. National Asthma Education and Prevention Program. Expert panel report 3: guidelines for the diagnosis and management of asthma: full report 2007.https://www.nhlbi.nih.gov/files/ docs/guidelines/asthgdln.pdf. August 2007.
6. Barnes PJ. Asthma-COPD overlap. Chest. 2016;149(1):7–8.
7. ABo S. National Health Survey: First Results, 2014–2015. Canberra: ACT: Australian Bureau of Statistics (ABS); 2015.
8. AIHW: Australian Centre for asthma monitoring. Asthma in Australia 2011: with a focus chapter on chronic obstructive pulmonary disease. Australian Institute of Health and Welfare (AIHW); 2011.
9. Smith B, Appleton S, Bennett P, Roberts G, Fante PD, Adam R, Trott C, Allan D, Southcott A, Ruffin R. The effect of a respiratory home nurse intervention in patients with chronic obstructive pulmonary disease (COPD). Intern Med J. 1999; 29(5):718–25.
10. AIHW. Geographic distribution of asthma and chronic obstructive pulmonary disease hospitalisations in Australia, 2007–08 to 2009–10. In. Australian Institute of Health and Welfare: Canberra, ACT; 2013.
11. Wilson DH, Tucker G, Frith P, Appleton S, Ruffin RE, Adams RJ. Trends in hospital admissions and mortality from asthma and chronic obstructive pulmonary disease in Australia, 1993–2003. Med J Aust. 2007;186(8):408–11.
12. AIHW. Mortality from asthma and COPD in Australia. Canberra, ACT: Australian Institute of Health and Welfare; 2014.
13. Page A, Ambrose S, Glover J, Hetzel D. Atlas of Avoidable Hospitalisations in Australia: ambulatory care-sensitive conditions. 2007. Public Health Information Development Unit, University of Adelaide, a collaborating unit of the Australian Institute of Health and Welfare (AIHW).http://www.health.gov.au.
14. Crighton EJ, Ragetlie R, Luo J, To T, Gershon A. a spatial analysis of COPD prevalence, incidence, mortality and health service use in Ontario. Health Rep. 2015;26(3):10.
15. AIHW. Australia’s health: Australia’s health series no.13. Australian Institute of Health and Welfare: Canberra, ACT; 2012.
16. Kaplan A, Thomas M. Screening for COPD: the gap between logic and evidence. Eur Respir Rev. 2017;26(143):160113.
17. Løkke A, Ulrik CS, Dahl R, Plauborg L, Dollerup J, Kristiansen LC, Cording PH, Dehlendorff C. Detection of previously undiagnosed cases of COPD in a high-risk population identified in general practice. COPD: J Chron Obstruct Pulmon Dis. 2012;9(5):458–65.
18. Yawn BP, Duvall K, Peabody J, Albers F, Iqbal A, Paden H, Zubek VB, Wadland WC. The impact of screening tools on diagnosis of chronic obstructive pulmonary disease in primary care. Am J Prev Med. 2014; 47(5):563–75.
19. Toelle BG, Xuan W, Bird TE, Abramson MJ, Atkinson DN, Burton DL, James AL, Jenkins CR, Johns DP, Maguire GP. Respiratory symptoms and illness in older Australians: the burden of obstructive lung disease (BOLD) study. Med J Aust. 2013;198(3):144–8.
20. SA G. South Australia tobacco control strategy 2011-2016. Adelaide, South Australia: drug and alcohol services South Australia; 2011.
21. Britt H, Miller GC, Charles J, Henderson J, Bayram C, Valenti L, Pan Y, Harrison C, Fahridin S, O’Halloran J. General practice activity in Australia 1999–00 to 2008– 09: 10 year data tables. General practice series, vol. 26; 2009.
22. Johnston KN, Young M, Grimmer-Somers KA, Antic R, Frith PA. Why are some evidence-based care recommendations in chronic obstructive pulmonary disease better implemented than others? Perspectives of medical practitioners. International journal of chronic obstructive pulmonary disease. 2011;6:659.
23. Overington JD, Huang YC, Abramson MJ, Brown JL, Goddard JR, Bowman RV, Fong KM, Yang IA. Implementing clinical guidelines for chronic obstructive pulmonary disease: barriers and solutions. Journal of thoracic disease. 2014;6(11):1586.
24. Allan DP. Catchments of general practice in different countries–a literature review. Int J Health Geogr. 2014;13(1):32.
25. Reddel HK, Valenti L, Easton KL, Gordon J, Bayram C, Miller GC. Assessment and management of asthma and chronic obstructive pulmonary disease in Australian general practice. Aust Fam Physician. 2017;46(6):413.
26. Del Fante P, Allan D, Babidge E. Getting the most out of your practice: the practice health atlas and business modelling opportunities. Aust Fam Physician. 2006;35(1–2):34.
27. Britt HC, Miller GC. The bettering the evaluation and Care of Health (BEACH) program: where to from here? Med J Aust. 2013;198(3):125–6.
28. Mazza D, Pearce C, Turner LR, de Leon-Santiago M, McLeod A, Ferriggi J, Shearer M. The Melbourne east Monash general practice database (MAGNET): using data from computerised medical records to create a platform for primary care and health services research. Journal of innovation in health informatics. 2016;23(2):523–8.
29. CAHML. Sentinel GP COPD data improvement program. In: Unpublished report. Adelaide, South Australia: Central Adelaide and Hills Medicare Local; 2013. p. 2013.
30. ABo S. Australian Statistical Geography Standard (ASGS): volume 1—main structure and Greater Capital City statistical areas. Canberra: Australian Bureau of Statistics. 2011.
31. RACGP. Standards for general practices. In: (RACGP) RACoGP, editor. Melbourne: The RACGP 2010. 4th ed. Melbourne: VIC: Royal Australian College of General Practitioners (RACGP); 2010.
32. Bagheri N, McRae I, Konings P, Butler D, Douglas K, Del Fante P, Adams R. Undiagnosed diabetes from cross-sectional GP practice data: an approach to identify communities with high likelihood of undiagnosed diabetes. BMJ Open. 2014;4(7):e005305.
33. Bagheri N, Gilmour B, McRae I, Konings P, Dawda P, Del Fante P, van Weel C. Community cardiovascular disease risk from cross-sectional general practice clinical data: a spatial analysis. Prev Chronic Dis. 2015;12. 34. Pink B. Census of Population and Housing: Socio-Economic Indexes for
Areas (SEIFA), Australia, 2011. Technical Paper. Australian Bureau of Statistics (ABS), ed. Canberra: Australian Government. 2011:54-8.
35. Ciampi A, Courteau J, Niyonsenga T, Xhignesse M, Lussier-Cacan S, Roy M. Family history and the risk of coronary heart disease: comparing predictive models. Eur J Epidemiol. 2001;17(7):609–20.
36. Zhang X, Holt JB, Lu H, Wheaton AG, Ford ES, Greenlund KJ, Croft JB. Multilevel regression and poststratification for small-area estimation of population health outcomes: a case study of chronic obstructive pulmonary disease prevalence using the behavioral risk factor surveillance system. Am J Epidemiol. 2014;179(8):1025–33.
37. Anselin L. Local indicators of spatial association—LISA. Geogr Anal. 1995; 27(2):93–115.
38. Chun Y, Griffith DA. Spatial statistics and geostatistics: theory and applications for geographic information science and technology: Sage; 2013.
39. Van Schayck C, Chavannes N. Detection of asthma and chronic obstructive pulmonary disease in primary care. Eur Respir J. 2003;21(39 suppl):16s–22s. 40. Siu AL, Bibbins-Domingo K, Grossman DC, Davidson KW, Epling JW, García
FA, Gillman M, Kemper AR, Krist AH, Kurth AE. Screening for chronic obstructive pulmonary disease: US preventive services task force recommendation statement. Jama. 2016;315(13):1372–7.
41. Press VG, Cifu AS, White SR. Screening for chronic obstructive pulmonary disease. Jama. 2017;318(17):1702–3.
42. Walters JA, Hansen EC, Walters EH, Wood-Baker R. Under-diagnosis of chronic obstructive pulmonary disease: a qualitative study in primary care. Respir Med. 2008;102(5):738–43.
43. Wilson D, Appleton S, Adams R, Ruffin R. Undiagnosed asthma in older people: an underestimated problem. Med J Aust. 2005;183(1):S20–2. 44. Liang J, Abramson MJ, Zwar NA, Russell GM, Holland AE, Bonevski B, Mahal A,
Phillips K, Eustace P, Paul E. Diagnosing COPD and supporting smoking cessation in general practice: evidence-practice gaps. Med J Aust. 2018;208(1):29–34. 45. Schattner P, Saunders M, Stanger L, Speak M, Russo K. Clinical data
extraction and feedback in general practice: a case study from Australian primary care. Journal of Innovation in Health Informatics. 2010;18(3):205–12. 46. García-Olmos L, Alberquilla Á, Ayala V, García-Sagredo P, Morales L,
Carmona M, De Tena-Dávila MJ, Muñoza Pascual M, Salvador CH. comorbidity in patients with chronic obstructive pulmonary disease in family practice: a cross sectional study. BMC Fam Pract. 2013;14(1):11. 47. Cooke G, Valenti L, Glasziou P, Britt H. Common general practice presentations
and publication frequency. Aust Fam Physician. 2013;42(1/2):65. 48. Zilz C, Blaas SH, Pfeifer M, Jörres RA, Budweiser S. Mental health, serum
biomarkers and survival in severe COPD: a pilot study. Multidisciplinary respiratory medicine. 2015;11(1):3.
49. Yohannes AM, Hann M, Sibbald B. The management of depressive symptoms in patients with COPD: a postal survey of general practitioners. Primary health care research & development. 2011;12(3):237–44.
51. Bacon SL, Bouchard A, Loucks EB, Lavoie KL. Individual-level socio-economic status is associated with worse asthma morbidity in patients with asthma. Respir Res. 2009;10(1):125.
52. Boudreaux ED, Emond SD, Clark S, Camargo CA. Acute asthma among adults presenting to the emergency department: the role of race/ethnicity and socio-economic status. Chest. 2003;124(3):803–12.
53. Blanc P, Yen I, Chen H, Katz P, Earnest G, Balmes J, Trupin L, Friedling N, Yelin E, Eisner M. Area-level socio-economic status and health status among adults with asthma and rhinitis. Eur Respir J. 2006;27(1):85–94.
54. O'malley AS, Pham HH, Schrag D, Wu B, Bach PB. Potentially avoidable hospitalizations for COPD and pneumonia: the role of physician and practice characteristics. Med Care. 2007;45(6):562–70.
55. Farah C, Hosgood HD III, Hock JM. Spatial prevalence and associations among respiratory diseases in Maine. Spatial and spatio-temporal epidemiology. 2014;11:11–22.
56. Hetlevik Ø, Melbye H, Gjesdal S. GP utilisation by education level among adults with COPD or asthma: a cross-sectional register-based study. NPJ primary care respiratory medicine. 2016;26:16027.
57. Harrison C, Henderson J, Miller G, Britt H. The prevalence of diagnosed chronic conditions and multimorbidity in Australia: a method for estimating population prevalence from general practice patient encounter data. PLoS One. 2017;12(3):e0172935.
58. Han Y-Y, Forno E, Canino G, Celedón JC. Psychosocial risk factors and asthma among adults in Puerto Rico. J Asthma. 2018:1–9.
59. Pleasants RA, Riley IL, Mannino DM. Defining and targeting health disparities in chronic obstructive pulmonary disease. International journal of chronic obstructive pulmonary disease. 2016;11:2475.