Structural modeling of an outer membrane electron conduit
from a metal-reducing bacterium suggests electron transfer
via periplasmic redox partners
Received for publication, January 11, 2018, and in revised form, March 19, 2018 Published, Papers in Press, April 10, 2018, DOI 10.1074/jbc.RA118.001850
Marcus J. Edwards‡, Gaye F. White‡, Colin W. Lockwood‡, Matthew C. Lawes‡, Anne Martel§, Gemma Harris¶, David J. Scott¶储**1, David J. Richardson‡, Julea N. Butt‡, andX Thomas A. Clarke‡2
From the‡Centre for Molecular and Structural Biochemistry, School of Biological Sciences and School of Chemistry, University of East Anglia, Norwich NR4 7TJ, United Kingdom,§Institut Laue-Langevin, 38042 Grenoble, France,¶Research Complex at Harwell, Rutherford Appleton Laboratory, Oxfordshire OX11 0FA, United Kingdom,储ISIS Spallation Neutron and Muon Source, Rutherford Appleton Laboratory, Oxfordshire OX11 0QX, United Kingdom,**School of Biosciences, University of Nottingham, Sutton Bonington Campus, Leicestershire LE12 5RD, United Kingdom
Edited by Karen G. Fleming
Many subsurface microorganisms couple their metabolism to the reduction or oxidation of extracellular substrates. For exam-ple, anaerobic mineral-respiring bacteria can use external metal oxides as terminal electron acceptors during respiration. Porin– cytochrome complexes facilitate the movement of electrons generated through intracellular catabolic processes across the bacterial outer membrane to these terminal electron acceptors. In the mineral-reducing model bacterium She-wanella oneidensis MR-1, this complex is composed of two decaheme cytochromes (MtrA and MtrC) and an outer-mem-brane -barrel (MtrB). However, the structures and mech-anisms by which porin– cytochrome complexes transfer electrons are unknown. Here, we used small-angle neutron scat-tering (SANS) to study the molecular structure of the trans-membrane complexes MtrAB and MtrCAB.Ab initiomodeling of the scattering data yielded a molecular envelope with dimen-sions of⬃105ⴛ60ⴛ35 Å for MtrAB and⬃170ⴛ60ⴛ45 Å for MtrCAB. The shapes of these molecular envelopes suggested that MtrC interacts with the surface of MtrAB, extending ⬃70 Å from the membrane surface and allowing the terminal hemes to interact with both MtrAB and an extracellular acceptor. The data also reveal that MtrA fully extends through the length of MtrB, with⬃30 Å being exposed into the periplasm. Proteoliposome models containing mem-brane-associated MtrCAB and internalized small tetraheme cytochrome (STC) indicate that MtrCAB could reduce Fe(III) citrate with STC as an electron donor, disclosing a direct interaction between MtrCAB and STC. Taken together, both structural and proteoliposome experiments support porin–
cytochrome–mediated electron transfer via periplasmic cyto-chromes such as STC.
A broad range of subsurface microorganisms couple their metabolism to the reduction or oxidation of extracellular sub-strates. Dissimilatory metal-reducing bacteria can, in the absence of oxygen, utilize metal oxides as terminal electron acceptors during respiration. Iron-oxidizing bacteria generate energy by coupling the oxidation of Fe(II) to the reduction of oxygen, enabling aerobic bacteria to survive in nutrient-limited environments. For Gram-negative bacteria, these processes require electrons to be channeled across the outer membrane, which is achieved through the assembly of porin– cytochrome complexes that form within the outer membrane (1, 2).
The number of identified porin– cytochrome complexes is rapidly growing. Gene clusters with adjacent genes encoding a -barrel porin and multiheme cytochromes have been identi-fied in a broad range of bacteria, including the lithoautotroph
Sideroxydans lithotrophicus ES-1, phototrophic Rhodopseu-domonas palustrisTIE-1 (3, 4), and complete complexes from
Geobacter sulfurreducens have been isolated (5). However, the best-studied of these complexes is the MtrCAB porin– cytochrome complex from the facultative anaerobeShewanella oneidensisMR-1, a model organism for the study of the reduc-tion of extracellular minerals and metals (6). The MtrCAB complex consists of a periplasmic decaheme cytochrome MtrA, a transmembrane 28-strand-barrel MtrB, and a second deca-heme cytochrome MtrC on the cell surface. It is proposed that MtrA enters the periplasmic side of MtrB, and MtrC inserts into the extracellular side of MtrB (Fig. S1A). The positions of the two cytochromes inside MtrB are close enough to enable electron exchange, allowing electrons to move through a chain of hemes from the periplasm to the surface (7). The outer mem-brane cytochromes OmcA and MtrC are then responsible for mediating electron transfer from the cell surface to terminal electron acceptors (8 –10, 12).
A structural model of MtrA was experimentally analyzed using small-angle X-ray scattering (SAXS), which resulted in a molecular envelope of MtrA resembling a paddle-like shape This work was supported by Beamtime awards RB1410125 at ISIS
(Oxford-shire, UK) and 8-03-882 at the ILL (Grenoble, France) (to T. A. C.). This research was supported by the Biotechnology and Biological Sciences Research Council Grants BB/K009885/1, BB/L023733/1, and BB/K00929X/1 and a BBSRC DTP studentship (to M. C. L.). The authors declare that they have no conflicts of interest with the contents of this article.
Author’s Choice—Final version open access under the terms of the Creative Commons CC-BY license.
This article containsFigs. S1–S5, Tables S1 and S2, and supporting data. 1A Senior Molecular Biology and Neutron Fellow, supported by the Science
and Technology Facilities Council (UK).
2To whom correspondence should be addressed. Tel.: 44-1603-592190; E-mail:[email protected].
Author’s Choice
J. Biol. Chem.(2018) 293(21) 8103–8112
8103
by guest on June 13, 2018
http://www.jbc.org/
with approximate dimensions of 100⫻25⫻50 Å; it was sug-gested that the narrow end of MtrA could insert into MtrB, with most of MtrA accessible for electron exchange with periplasmic electron acceptors (13). MtrB is predicted to be a 28-strand outer membrane-barrel protein with an N-terminal domain of only⬃30 amino acids. Unlike typical outer membrane -bar-rels, MtrB is oriented in the membrane so that the soluble loops that link each-strand are shorter on the cell surface, whereas the longer solvent-exposed loops remain in the periplasm (12). This suggests that MtrB has a different folding pathway to other transmembrane-barrel proteins, and may be linked to the interaction between MtrA and MtrB during folding.
The crystal structure of a soluble form of MtrC is available (14). MtrC is composed of four domains, with the hemes bound in two pentaheme domains and the other two domains forming -barrels that support the pentaheme domains (Fig. S1B). The hemes are arranged in a staggered cross conformation, giving four possible sites for electrons to enter or exit MtrC. Two sites are at the edges of the pentaheme domains, whereas two others face into the-barrel domains. It is not yet clear which of these MtrC sites would accept electrons from MtrA and which sites transfer electrons into terminal extracellular acceptors.
Electron transfer to MtrCAB depends on CymA, a tetraheme menaquinol dehydrogenase in the cytoplasmic membrane, which can reduce a range of soluble periplasmic cytochromes (15). These include the small tetraheme cytochrome (STC)3 and tetraheme fumarate reductase FccA, as well as monoheme ScyA and the diheme ccp peroxidase (16). Both purified STC and FccA are capable of transferring electrons when mixed with purified MtrA, but this has never been demonstrated with membrane-bound MtrCAB complexes. It has been proposed that MtrA can directly exchange electrons with CymA, allow-ing static or dynamic electron transfer networks to assemble between CymA and the porin– cytochrome complex MtrCAB in the outer membrane of the cell (16 –18).
There is no experimental evidence for the overall shape of the MtrCAB complex, or exactly how MtrA and MtrC interact with MtrB. These data are important to understanding the mecha-nism of MtrCAB, including 1) how far MtrA can extend into the periplasm and interact with electron donors, 2) how far both MtrA and MtrC extend into MtrB, and 3) the orientation of MtrC on the surface of the complex and the cell. We sought to use small-angle scattering methods to obtain low-resolution information about the structural configuration of MtrAB and MtrCAB and address many of the structural queries that chal-lenge our understanding of this complex. In this project, we used small-angle neutron scattering (SANS) to deriveab initio
molecular envelope models of MtrCAB and MtrAB. SANS is a useful technique to help elucidate the overall domain organiza-tion of membrane proteins, as proteins and detergent mole-cules have different neutron-scattering lengths. This enables
“contrast matching,” where the scattering length of the solvent is adjusted to match the scattering length of the detergent; this is enabled by altering the ratio of D2O/H2O in the solvent. At this contrast match point the scattering contribution of deter-gent is the same as the solvent and so only the scattering of the protein is observed. This allows structural information about the protein derived independent of contributions from the supporting detergent micelle. Using this technique,ab initio
molecular models were derived that provided valuable struc-tural information about the organization of the MtrCAB com-ponent proteins, as well as the likely electron ingress and egress routes out of the complex and the overall structural arrange-ment in the membrane. These results led us to conclude that MtrCAB must interact with soluble periplasmic cytochrome electron shuttles rather than directly with the inner mem-brane CymA and to test this we constructed an artificial model of theShewanellaperiplasmic electron transfer sys-tem using MtrCAB proteoliposomes with internalized STC and external iron citrate.
Results
SANS and modeling of the porin– cytochrome complexes MtrAB and MtrCAB
Native MtrCAB and recombinant MtrAB were isolated from
S. oneidensisas described insupporting dataand SDS-PAGE was used to confirm purity and presence of component pro-teins in both MtrAB and MtrCAB (Fig. S2). Both proteins were buffer exchanged into 20 mMHEPES, pH 7.8, 100 mM NaCl, 2.8 mM Fos– choline-12, 13% D2O directly before SANS measurements.
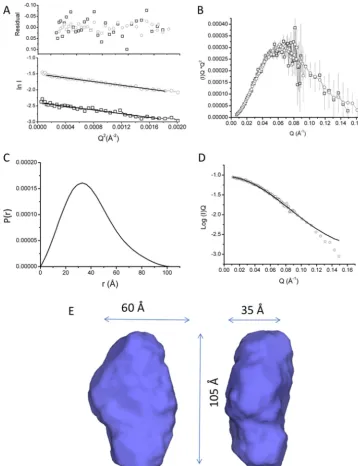
Initial SANS characterization was carried out on SANS2D (ISIS, Oxfordshire, UK) where the monodispersity of samples were confirmed via Guinier analysis over a range of concentra-tions. Further data for shape reconstruction was subsequently obtained on D22 (Institut Laue-Langevin (ILL), Grenoble, France) using MtrAB diluted to 3.5 and 8.7 mg/ml of protein in 20 mMHEPES, pH 7.8, 100 mMNaCl, 2.8 mMFos– choline-12, 13% D2O. Guinier analysis of MtrAB at both concentrations indicated that the samples were not aggregated and had a sim-ilar radius of gyration (Rg) of 29 Å (Fig. 1A). A Kratky plot (I(Q)*Q
2againstQ, whereQis momentum transfer (19)) showed MtrAB was globular and the scattering curves of both concen-trations were superposable (Fig. 1B), validating the absence of interparticle interactions. The two scattering curves were merged for further analysis, providing high reliability at low angle and a high signal-to-noise ratio at high Q values. The GNOM program (20) was used to generateP(r) distance distri-bution curves based on inverse Fourier transform of the data to a maximumQvalue of 0.15 Å⫺1. Beyond this range, the scat-tering intensity decreased significantly so data were truncated to this value beforeP(r) distance distribution curves were cal-culated. TheP(r) curve shape generated from the scattering curve was suggestive of a globular protein with anRgof 29.3⫾ 0.3 Å (Fig. 1,CandD), in good agreement with the value deter-mined by Guinier analysis. The molecular mass was calculated using the estimatedI(0) for each concentration, giving values of 104 kDa and 103 kDa for 3.5 and 8.7 mg/ml concentrations, 3The abbreviations used are: STC, small tetraheme cytochrome; SANS, small
angle neutron scattering;Rg, radius of gyration;Dmax, maximum distance; Buffer A, 20 mMHEPES, 50 mMNaCl pH 7.8, 2% (v/v) Triton X-100; Buffer B, Buffer A plus 1MNaCl; Buffer C, 20 mMTris-HCl, 50 mMNaCl, pH 8.5, con-taining 2% (v/v) Triton X-100; Buffer D, Buffer C plus 1MNaCl; Buffer E, 5 mM
lauryldimethylamineN-oxide, 20 mMHEPES, 50 mMNaCl, pH 7.8; Buffer F, Buffer E plus 300 mMNaCl.
by guest on June 13, 2018
http://www.jbc.org/
respectively, close to the calculated heterodimeric molecular mass of 110 kDa for MtrAB (Table S1) (21).
Pair distance distribution function (P(r)) curves were gener-ated with the maximum distance in the molecule,Dmax, values ranging between 98 and 110 Å and used to generate 20ab initio
models using DAMMIF for eachP(r) curve. The resulting mod-els were filtered to a core of 17–19 modmod-els using DAMFILT, and averaged using DAMAVER (Table S2). The resulting model was refined directly against scattering data using a final round of DAMMIN to generate a final model. Based on the error estimates obtained at eachDmaxvalue, the best model was found at a Dmax of 104 Å from the probability distribution
(Table S2). The averaged model had a normalized spatial
dis-crepancy of 0.530⫾0.02 and the final DAMMIN model had a 2value of 0.548 (Fig. S3). The filtered model shown inFig. 1E contains the core structural model conserved in all averaged models, and had approximate overall dimensions of 105⫻60⫻ 35 Å. The envelope is consistent with a monomeric single domain protein, although the model is ellipsoidal, rather than cylindrical, suggesting that the barrel is not completely sym-metrical. The experimental length of MtrAB obtained in these studies is approximately the same as the length of MtrA (13), and so these results are consistent with an MtrAB model where MtrA is fully inserted into the MtrB-barrel.
[image:3.603.117.476.57.524.2]MtrCAB was diluted to 3.5 and 9.7 mg/ml in 20 mMHEPES, pH 7.8, 100 mMNaCl, 13% D2O, 2.8 mMFos– choline-12 and
Figure 1. Small angle neutron scattering of MtrAB in 20 mMHEPES pH 7.8, 100 mMNaCl, 13% D2O, 2.8 mMFos-choline-12.A, Guinier region of MtrAB at
3.5 (black) and 8.7 (gray) mg/ml. Lines are linear fits used to calculateRg.Residuals of fit are shown above experimental curve.B, Kratky plot of scaled and
overlaid 3.5 (black) and 8.7 (gray) mg/ml.C,P(r) distance distribution curve of merged MtrAB data sets.D, scattering curve of merged 3.5 and 8.7 mg/ml datasets. The line is a fit of theP(r) curve shown in (C) to the scattering data.E, molecular envelope generated by DAMFILT, representing the core features of 19 independent models selected from 20 generated models fitted to the experimental data.
by guest on June 13, 2018
http://www.jbc.org/
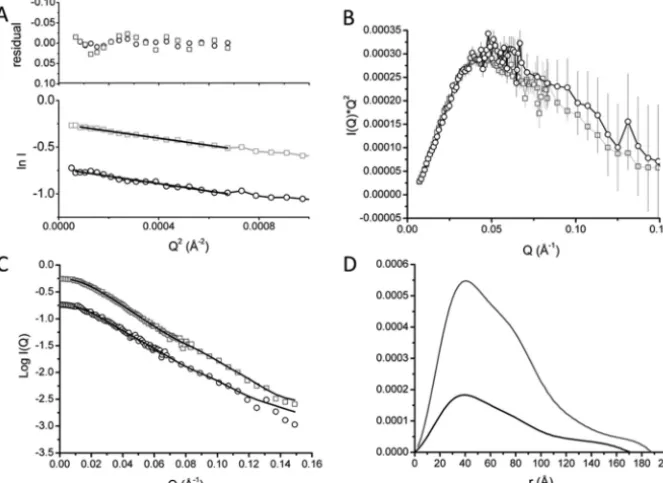
SANS data were collected on D22 (ILL). Guinier analysis of the MtrCAB scattering curves at both concentrations gave similar
Rgof 53 Å, suggesting that both 3.5 and 9.7 mg/ml samples were not aggregated over this concentration range (Fig. 2A).
The molecular size of MtrCAB was calculated using theI(0) determined at each concentration (21). Molecular masses of 183 kDa and 203 kDa were calculated at 3.5 and 9.7 mg/ml MtrCAB concentration, respectively, consistent with a 1:1:1 MtrCAB complex. To confirm the molecular mass of MtrCAB solubilized in Fos– choline-12, sedimentation velocity experi-ments were performed on samples of MtrCAB in 2.8 mMFos– choline-12, 100 mMNaCl, 51% D2O (Fig. S4). At this D2O con-centration, the buffer density is approximately equal to the reciprocal of the Fos– choline-12 partial specific volume (22). The major sedimenting component observed has a molecular mass of 200 kDa, similar to the molecular mass of 189 kDa predicted for MtrCAB. This agrees with previous studies, which determined a 1:1:1 stoichiometry for MtrCAB (7, 23). A second minor peak had a molecular mass of 70 kDa, close to the molecular mass of MtrC and suggesting some degradation of the complex, most likely because of the instability of MtrCAB in 51% D2O.
The Kratky plot of MtrCAB SANS data showed a broader peak than MtrAB (Fig. 2B), suggesting an elongated multido-main complex. The scattering intensity decreased significantly beyond aQvalue of 0.15, so data were truncated to this value before P(r) distance distribution curves were calculated. Despite attempts to adjust the data using buffer subtraction, there was a slight difference inI(Q)*Q2observed after 0.05 Å⫺1. This may be caused by interparticle interactions at higher con-centrations, or by weaker scattering at lower concentrations. The scattering curves of the two concentrations were therefore processed separately.
P(r) distance distribution plots producedRgvalues of 53.7⫾ 0.2 Å and 52.7⫾0.6 Å at 3.5 and 9.7 mg/ml, respectively, and initialDmaxvalues of 174 and 185 Å. The increase inP(r) at the higher distance range shape of the curves for both concentra-tions suggests that the association of MtrC to MtrAB results in a different, more substantially elongated complex, which is con-sistent with the Kratky plots (Fig. 2,CandD). Both concentra-tions were analyzed across Dmaxvalues of 150 and 190 Å to determine the most probable model for the two concentrations
(Table S2). Quality estimates from data processed using
GNOM suggested that the optimalDmaxwas between 165 and 180 Å, and the2values for final DAMMIN models were also highest at this range. Irrespective of the initialDmaxpredicted fromP(r) plots, the maximum edge-to-edge distance between atoms in the final DAMMIN model was slightly higher, with values of 180 –185 Å obtained for both concentrations.
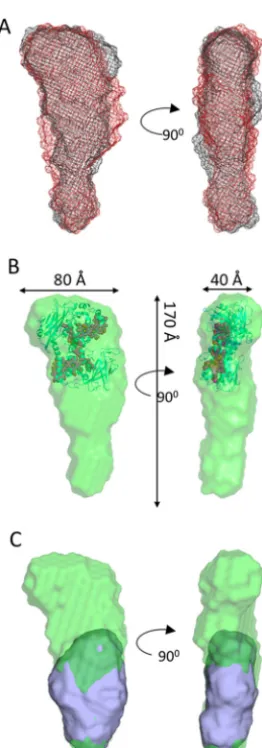
[image:4.603.133.465.62.304.2]The molecular envelopes shown in Fig. 3A represent the superposed filtered models of MtrCAB at both 9.7 and 3.5 mg/ml. Despite the differences revealed in both Kratky andP(r) distance distribution plots, the two structural models are broadly similar and can be defined into two regions, an oblate “head” domain and a prolate “tail” domain. An averaged model from both concentrations was generated by filtering all 40 mod-els generated for both concentrations using DAMFILT. A total of 38 models with a normalized spatial discrepancy of 0.713⫾ 0.06 were averaged using DAMAVER, and the filtered core, with a length of 170 Å, is shown inFig. 3B. The overall dimen-sions of the head domain are⬃80⫻50⫻40 Å and the prolate tail domain has approximate dimensions of 110⫻60⫻40 Å. The dimensions of the head domain are in broad agreement with the known dimensions of the MtrC crystal structure (90⫻ 60⫻40 Å), and the dimensions of the tail domain are consistent with the dimensions of the MtrAB SANS molecular envelope
Figure 2. SANS data analysis of MtrCAB in 20 mMHEPES pH 7. 8, 100 mMNaCl, 13% D2O, 2.8 mMFos-choline-12, at 3.5 (black) and 9.7 (gray) mg/ml.A,
Guinier region of MtrCAB with linear fit to data shown suggesting anRgof 54 Å. Residuals of fit are shown above.B, Kratky plot of scaled MtrCAB suggests
slight differences between the data at 3.5 and 9.7 mg/ml.CandD, scattering curves with fits to the data giving rise to theP(r) distance distribution curves shown in (D).
by guest on June 13, 2018
http://www.jbc.org/
shown inFig. 1E. It was possible to dock the MtrC structure into the head group of the MtrCAB filtered model using SUPCOMB (24) so that heme 10 or heme 5 is angled toward the base (Fig. 3B), and dock the MtrAB structural model into the remaining area of MtrCAB (Fig. 3C).
The level of resolution obtained for both complexes made it difficult to conclude whether the different shapes of the molec-ular envelopes corresponding to MtrAB and the MtrAB com-ponent complexed to MtrC were because of structural changes. However, it is possible to conclude that MtrC does not embed within MtrAB, but is docked to the surface with either heme 10 or heme 5 of MtrC within 15 Å of the surface of MtrAB, and the other heme extended away from the cell surface and into the extracellular environment toward potential terminal electron acceptors.
Electron transfer between MtrCAB and STC
MtrCAB can be incorporated into proteoliposomes contain-ing internalized electron mediators, allowcontain-ing the study of
MtrCAB-mediated transmembrane electron transport (25). To show that MtrCAB could interact with internalized soluble redox partners, we used proteoliposomes to mimic the outer membrane and to determine whether the periplasmic STC could transfer electrons to MtrCAB. The width of the lipid bilayer is⬃50 Å, so the maximum distance that the 105 Å long MtrAB could extend into the periplasm would be⬃55 Å.
Liposomes containing internalized STC with or without MtrCAB were prepared as described in thesupporting data, and the UV-visible absorbance spectrum of the liposome sus-pension was measured before and after addition of sodium dithionite as a reducing agent. The absorbance spectrum of liposomes containing STC revealed a peak at 410 nm corre-sponding to the Soret peak of the oxidizedc-type heme (Fig. 4,
AandB). The concentration of MtrCAB present in liposome suspensions is less than 10 nMand consequently below spectro-scopically detectable limits (19, 30). Addition of sodium dithio-nite to liposomes without MtrCAB did not cause any observ-able change in the heme spectrum because the internalized cytochromes were not able to access the reductant (Fig. 4A). However, when sodium dithionite was added to proteolipo-somes containing MtrCAB the Soret band shifted to 420 nm and the reduced ␣peaks at 520 nm and 550 nm increased, indicating the full reduction ofc-type hemes (Fig. 4B). We mea-sured the average hydrodynamic radius of these liposomes by dynamic light scattering (25) and found the radius to be 148⫾ 63 nm in the absence of MtrCAB, and 152 ⫾70 nm in the presence of MtrCAB. This indicates that there was no signifi-cant change in the sizes of liposomes because of the presence of MtrCAB. These results demonstrated that functional MtrCAB proteoliposomes could be prepared containing internalized soluble STC and used as model of the outer membrane
[image:5.603.102.233.51.426.2]elec-Figure 3. MtrCAB molecular envelopes generated from DAMFILT from multiple models.A, DAMFILT molecular envelopes generated from scatter-ing data of MtrCAB at 3.5 mg/ml (black mesh) and 9.7 mg/ml (red mesh).B, DAMFILT molecular envelope of MtrCAB generated by averaging all models generated at 3.5 and 9.7 mg/ml. The crystal structure of MtrC (PDB ID: 4LM8) is superposed using SUPCOMB into the MtrCAB envelope. The heme groups are shown asred spheres.C, superposition of MtrCAB and MtrAB molecular envelopes generated by DAMFILT and SUPCOMB.
Figure 4. Proteoliposome experiments using internalized STC.AandB, UV-visible spectra of STC liposomes in presence and absence of reductant. Liposomes were suspended in 50 mMHEPES, pH 7.0, 2 mMCaCl2, 10 mMKCl before (black) and after (gray) incubation with 0.25 mMsodium dithionite.A, liposomes prepared in 0.2 mMSTC without MtrCAB.B, proteoliposomes pre-pared in 0.2 mMSTC and MtrCAB.CandD, time-dependent oxidation and reduction of proteoliposomes containing MtrCAB monitored by changes in UV-visible absorbance.Arrowsshow addition of reductant or oxidant at time indicated.C, oxidized STC proteoliposomes monitored at 550 nm on addition of excess sodium dithionite.D, reduced STC proteoliposomes monitored at 550 nm on addition of 300MFe(III) citrate.
by guest on June 13, 2018
http://www.jbc.org/
[image:5.603.305.552.56.245.2]tron-transfer system. The internalized cytochromes are unable to pass through the liposome membrane and cannot be reduced by external reducing agents such as sodium dithionite, unless MtrCAB is present to act as an electron-transfer protein across the liposome membrane (Fig. S5).
By monitoring the change in absorbance of proteoliposomes at 550 nm, the time-dependent oxidation and reduction of the internalized STC could be measured. Addition of sodium dithionite to proteoliposomes containing STC and MtrCAB caused a monophasic increase in absorbance at 550 nm through the reduction of STC hemes (Fig. 4C). Subsequent addition of membrane-impermeable Fe(III) citrate resulted in a decrease in absorbance because of oxidation of the internalized STC hemes, and confirming bidirectional electron transfer through MtrCAB (Fig. 4D). The rate of electron transfer from sodium dithionite to STC was 140 nMelectrons s⫺1, slightly faster than the rate of electron transfer from STC to Fe(III)citrate, which was 61 nMelectrons s⫺1.
These results show that when the MtrCAB complex was incorporated in a lipid bilayer, it could mediate transmembrane electron transfer between STC and external electron acceptors. The physiologically relevant STC proteoliposomes were revers-ibly and fully reduced and oxidized by extracellular electron donors and acceptors (Fig. S5). This electron-transfer chain indicates that,in vivo, reduced STC could transfer electrons to a terminal acceptor such as Fe(III) citrate through MtrCAB across theS. oneidensisMR-1 outer membrane.
Discussion
Despite recent advances in characterization of the porin– cytochrome complex MtrCAB, many critical details of the con-formation of the complex remained unknown. The experi-ments reported here reveal important new structural details of MtrCAB, including information about interactions between MtrA, MtrB, and MtrC. The length of MtrAB was⬃100 Å, the same length as isolated MtrA (13). There was little evidence of flexibility within theP(r) or Kratky plots, consistent with bio-chemical data that suggest MtrA and MtrB form a tight, non-dissociating complex (7, 26), andin vivodata that show MtrA is essential for MtrB stability (7, 26). These SANS results indicate that MtrA most likely inserts through the entire length of MtrB allowing for electron transfer solely through MtrAB, although it is possible that association with MtrB alters the dimensions of MtrA measured free in solution using small-angle X-ray scat-tering. It is also possible that the isolated and detergent solubi-lized MtrCAB form determined here may not be identical to the structure of MtrCAB present in the outer membrane ofS. one-idensis.However, there isin vitroandin vivoevidence suggest-ing that MtrAB is capable of electron transfer to extracellular Fe(III) citrate and this too would be consistent with an MtrAB model where MtrA spans the entire membrane (12, 27). The cross-sectional dimensions of MtrAB shown here are⬃35⫻60 Å, and the corresponding dimensions of MtrA are 25 and 50 Å (13), indicating that the MtrB barrel could form an⬃10 Å shell around MtrA in the membrane.
The experimental scattering curves of MtrCAB show it has a maximal dimension of 174 –185 Å, in agreement with MtrC (90 Å) associating with the surface of MtrAB (100 Å). Comparison
of the MtrCAB and MtrAB envelopes allows the orientation of MtrAB in the membrane, with the tip of MtrAB extending⬃50 Å into the periplasm (Fig. 5). One end of MtrAB face would be exposed to the cell surface, allowing for interaction with MtrC or soluble Fe(III) citrate.
The width of theS. oneidensisperiplasm has been measured as 235 ⫾37 Å using cryo–transmission electron microscopy (28), so it is reasonable to assume that⬃200 Å represents a lower limit for the distance that electrons must travel between the inner and outer membrane ofS. oneidensisMR-1. Homol-ogy models of CymA based on NrfH suggest that CymA could reach 50 Å across the membrane (29), and it was previously postulated that direct electron transfer between CymA and MtrA might occur (27, 30, 31). More recent studies suggested that a range of soluble cytochromes, including STC and FccA, may be required (32). Rather than electron transfer between CymA and MtrA, our proteoliposome experiments confirmed that electron transfer between MtrCAB and STC would occur at rates sufficient to sustain respiration, revealing that electron transfer between CymA and MtrCAB must occur through interactions with periplasmic cytochromes, rather than direct electron transfer between CymA and MtrCAB.
Until now there has been no experimental evidence for the position of MtrC on the surface of the lipid bilayer. Possible conformations include a parallel orientation on the surface, allowing multiple hemes to interact with both MtrAB and min-eral, or a perpendicular orientation, in which case it is likely that only hemes 10 or 5 accept electrons from MtrAB (Fig. 5). The molecular envelopes of MtrCAB models generated at both con-centrations show that MtrC is likely to associate with MtrAB in a conformation perpendicular to the membrane, allowing hemes 5 and 10 to function as electron ingress/egress sites.
[image:6.603.310.545.57.238.2]Our structural models produced by SANS are sufficient to give the first insight into the arrangement of the component
Figure 5. Scale diagram of the CymA/MtrCAB electron transport system ofS. oneidensisMR-1.The averaged molecular envelope of MtrCAB contain-ing the docked MtrC structure (PDB ID: 4LM8) is shown ingreen. The filtered molecular envelope model of MtrAB is shown inblue. The crystal structure of the small tetraheme cytochrome (STC,green) and homology model of CymA (blue) are shown. The⬍100 Å distance between the tip of CymA and MtrCAB is too far to allow direct electron transfer; consequently, electrons must be transported through a series of electron shuttles, such as STC, across the periplasmic space.
by guest on June 13, 2018
http://www.jbc.org/
proteins of theS. oneidensisMtrCAB transmembrane electron channel, and how it may be arranged in the outer membrane. It is clear that MtrA inserts fully into the MtrB-barrel, with MtrC interacting with the MtrAB surface and either heme 10 or heme 5 accepting electrons. Assuming that MtrAB is also per-pendicular to the membrane then MtrC will be raised at an angle on the membrane surface, with either heme 10 or heme 5 able to donate electrons directly to an insoluble extracellular substrate.
Experimental procedures
Expression and purification of MtrCAB and STC from S. oneidensis MR-1
MtrCAB was isolated as a pure complex in 2% Triton X-100 as described previously (12, 23). STC was purified fromS. one-idensis cells grown aerobically at 30 °C in Terrific Broth medium overnight. Cells were harvested at 7000gand 4 °C for 20 min and re-suspended in 100 mMHEPES, pH 7.5. The cells were incubated with polymyxin B (1 mg ml⫺1) at 37 °C for 1 h before centrifugation at 15,000g, 4 °C for 45 min. The superna-tant was loaded onto a 15 ml HiTrap nickel affinity column (GE Healthcare) equilibrated with 20 mMHEPES, pH 7.6, and eluted via a 0 –500 mMimidazole gradient over 200 ml. Fractions con-taining STC were pooled and dialyzed against 20 mm HEPES, pH 7.6, overnight. The dialyzed fraction was loaded onto a Q Sepharose anion exchange column, equilibrated with 20 mM HEPES, pH 7.6. After washing with 2-column volumes of buffer, STC was eluted using a linear gradient of 0 –500 mM NaCl over 4-column volumes. Fractions were concentrated in an AvantiTM spin concentrator before passage through a HiLoad 16/60 Superdex 75 gel filtration column equilibrated with 20 mMHEPES, pH 7.6, 100 mMNaCl. Fractions containing pure STC were spin concentrated in 20 mMHEPES buffer, pH 7.5.
Preparation of recombinant MtrAB
Genes encoding MtrAB were cloned into a pBAD202 plas-mid (Invitrogen). The genomic DNA ofS. oneidensisMR-1 was isolated using a PureLink Genomic DNA Mini Kit (Invitrogen). The following primer pair amplified mtrA (1002 bp), mtrB
(2094 bp), and their intergenic region (12 bp): forward,
CACC-TAAGAAGGAGATATACATCCCATGAAGAA
CTGC-CTAAAAATGAAAAACCTAC (overhang and start codon, respectively) and reverse, GGATTAGAGTTTGTAACTCAT-GCTCAGC. The forward primer contained, between the over-hang and start codon, the ribosomal-binding site for the thiore-doxin gene of the pBAD202 plasmid such that the native ribosomal-binding site was not used. The CACC overhang allowed for directional insertion into pBAD202/Directional TOPO. The reverse primer maintained the native stop codon of
mtrB such that recombinant MtrAB would not include any affinity tags. PCR products were obtained with Phusion Flash High-Fidelity PCR Master Mix (Thermo Fisher Scientific) and amplification ofmtrABconfirmed by a single 3-kb band on a 1% agarose gel. The pBAD202 Directional TOPO Expression Kit (Thermo Fisher Scientific) was used to insert amplified DNA into the pBAD202/Directional TOPO plasmid and transform chemically competentEscherichia coliOne Shot TOP10 cells
with the ligation product, pCL001. Transformed cells were streaked onto LB agar plates with kanamycin (30g ml⫺1) and plasmid isolated from single-colonies (Qiagen Miniprep Kit). After sequencing (Eurofins) confirmed successful plasmid con-struction, pCL001 was used for transformation by electropora-tion into an MR-1 strain lacking the mtr-gene cluster to give strainmtr⫺mtrAB⫹. Successful formation ofmtr⫺mtrAB⫹was verified through sequencing of plasmid DNA.
Recombinant MtrAB was purified from membranes of MR-1 strainmtr⫺mtrAB⫹grown at 30 °C in M72 media (casein digest peptone 15 g liter⫺1, papaic digest of soybean meal 5 g liter⫺1, NaCl 5 g liter⫺1at pH 7.8) supplemented with 20 m
M DL-lactate, 20 mMsodium fumarate, 20 mMHEPES, pH 7.8, and 30g ml⫺1 kanamycin. Cultures (1.5-liter volume) were grown in 2-liter baffled flasks shaken at 200 rpm after inoculation (2%) with LB culture grown aerobically, overnight at 30 °C. The cells were induced at mid– exponential phase (A600 nm ⬃0.6) with the addition of 5 mM L-arabinose at which time shaking was stopped and the cultures left to grow microaerobically for a further 18 h. Cells were harvested by centrifugation at 6230⫻g
for 20 min at 4 °C, washed and resuspended in 20 mMHEPES, 50 mMNaCl, pH 7.8, using⬃5 ml for cells from 1 liter culture. Cell lysis was performed in the presence of lysozyme and DNase by two passes through a French press at a pressure of 16,000 psi (1 psi⫽6.9 kilopascals). Cell debris and unbroken cells were removed by 30-min centrifugation at 1500 ⫻ g, 4 °C. Membranes were pelleted by 100-min ultracentrifugation at 200,000⫻g, 4 °C and resuspended in 20 mMHEPES, 50 mM NaCl, pH 7.8. To preferentially solubilize inner membranes, Sarkosyl was added to the resuspended membranes to a con-centration of 1% (m/v) and the suspension stirred gently at 4 °C for 45 min. The pellet recovered from a second round of ultra-centrifugation was then solubilized by stirring overnight in 20 mMHEPES, 50 mMNaCl, pH 7.8 containing 5% (v/v) Triton X-100. Insoluble material was removed by a final round of ultracentrifugation and recombinant MtrAB purified from the supernatant by anion exchange chromatography at 4 °C, as below, monitored by electronic absorbance spectroscopy and SDS-PAGE with proteins visualized by heme and Coomassie Blue stain.
Solubilized membrane proteins were loaded (2 ml min⫺1) onto a Q Sepharose column (300 ml) pre-equilibrated with Buffer A (20 mMHEPES, 50 mMNaCl, pH 7.8, 2% (v/v) Triton X-100). After washing the column with Buffer A until a stable baseline was achieved (monitored by the absorbance at 280 nm), the bound proteins were eluted with a gradient of 0 –50% Buffer B (Buffer A plus 1MNaCl) over 800 ml (50 –525 mM NaCl) while collecting 10 ml fractions. The purest MtrAB-con-taining fractions were pooled, diluted into 20 mMTris-HCl, 50 mMNaCl, pH 8.5, containing 2% (v/v) Triton X-100 (Buffer C) and loaded on to a DEAE column (300 ml) pre-equilibrated with Buffer C. Bound protein was washed at 2 ml min⫺1with Buffer C and eluted with a gradient from 0 –50% Buffer D (Buffer C plus 1MNaCl) over 800 ml (50 –525 mMNaCl) while collecting 10 ml fractions. Fractions containing the purest MtrAB were pooled, diluted 3-fold with 5 mM lauryldimethyl-amineN-oxide, 20 mMHEPES, 50 mMNaCl, pH 7.8 (Buffer E) and loaded onto a HiTrap Q Sepharose column
by guest on June 13, 2018
http://www.jbc.org/
brated with Buffer E. The column was washed with 2- column volumes of Buffer E and eluted with Buffer F (Buffer E plus 300 mMNaCl). The resulting sample was concentrated and exchanged into Buffer E with a Microcon-30kDa Centrifugal Filter (Millipore Sigma) and stored as frozen aliquots at⫺80 °C.
Preparation of liposomes and proteoliposomes
Liposomes and MtrCAB proteoliposomes containing inter-nalized methyl viologen were prepared according to previously published methods (12, 25). Liposomes and MtrCAB proteoli-posomes containing STC were prepared through the following procedure. A 10 mg/ml phosphatidylcholine (Sigma-Aldrich) suspension prepared in 20 mMHEPES, pH 7.5, 100 mMNaCl, and 2.6 mg/ml STC was extruded though a 0.1m polycarbon-ate membrane and frozen at⫺80°C. After thawing, the suspen-sion was sonicated twice for 40 – 45 s. Valinomycin and MtrCAB were added to give final concentrations of 100 nMand 10 nM, respectively, and the suspension was subjected to two freeze thaw cycles. 0.25 g of BioBeads (Bio-Rad) were added to the sample and incubated at 4°C for 1 h to remove detergent. The supernatant was ultracentrifuged at 280,000gfor 45 min to isolate the proteoliposomes. The supernatant containing the excess cytochrome was removed and the proteoliposome/lipo-some pellet gently resuspended in 1 ml of fresh 20 mMHEPES pH 7.5, 100 mM NaCl, 2 mMCaCl2, 10 mM KCl buffer. The absorbance of the supernatant was measured and centrifuga-tion at 280,000gfor 45 min followed by supernatant removal, followed by pellet resuspension was repeated until the Soret peak of excess soluble cytochrome was no longer visible in the supernatant.
Spectrophotometric analysis of proteoliposomes
100 to 300l of proteoliposome stock suspension was added to 3 ml of 20 mMHEPES, pH 7.5, 100 mMNaCl, 2 mMCaCl2, 10 mMKCl buffer. The diluted proteoliposome/liposome suspen-sion was transferred to an anaerobic quartz cuvette and flushed with argon for 1–2 h with gentle stirring. Reduction of lipo-somes and proteolipolipo-somes was performed by addition of 15l of a 17 mMsolution of reduced sodium dithionite. Oxidation of proteoliposomes was performed by addition of 175–300M Fe(III) citrate, freshly prepared from ferric ammonium citrate (Sigma) or 1 mMpotassium ferricyanide to proteoliposomes that had been carefully reduced by titrating 2l aliquots of a 17 mMsolution of reduced sodium dithionite. The absorbance of the proteoliposomes was monitored using a Hitachi U-4100 UV-visible spectrophotometer. Wavelength scans were taken before and after time scans tracking the absorbance at 552 nm for STC and 603 nm for methyl viologen proteoliposomes.
Analytical ultracentrifugation
Sedimentation velocity experiments were performed at 35,000 rpm, using a Beckman Optima analytical ultracentrifuge with an An-50 Ti rotor and at 20 °C. 0.5 M MtrCAB was diluted into 20 mMHEPES, pH 7.8,100 mMNaCl, 2.8 mMFos– choline-12, 51% D2O. 51% D2O was used to match the buffer density to the density of the Fos– choline micelles. Data were recorded using the absorbance (at 410 nm with 10m resolu-tion and recording scans every 20 s) optical detecresolu-tion system.
The density and viscosity of the buffer was measured experi-mentally using a DMA 5000 Mdensitometer equipped with a Lovis 200ME viscometer module. The partial specific volume of the protein complex was calculated using SEDNTERP from the amino acid sequence. Data were processed using SEDFIT, fit-ting to the c(s) model, and in SEDPHAT fitfit-ting to the hybrid global c(s) global discrete species model.
SANS data collection and analysis of MtrCAB and MtrAB
SANS is used to obtain structural information on membrane proteins, as proteins and detergent molecules scatter radiated neutrons differently, resulting in different scattering length densities. This enables “contrast matching” where the scatter-ing length of the solvent is adjusted to match the scatterscatter-ing length of the detergent, which is achieved by altering the ratio of D2O/H2O in the solvent. At the contrast match point, the tering from detergent micelles is identical to the solvent scat-tering so after solvent subtraction the scatscat-tering of the protein is obtained. Structural information about the protein is there-fore derived independently of the contributions from the sup-porting detergent micelle. The literature value for the contrast match point of Fos– choline-12 was previously published as 11% (33, 34). A similar value of 13% had previously been obtained on beamline D22 (ILL), and this value was subse-quently used as the contrast match point for samples of MtrCAB and MtrAB solubilized in Fos– choline-12.
MtrCAB and MtrAB were purified as described in
support-ing data and concentrated to ⬃15 mg/ml using a 100,000
molecular weight cut-off spin concentrator (Millipore) and dia-lyzed overnight in a sealed DURAN bottle containing 20 mM HEPES, pH 7.8, plus 100 mMNaCl plus 13% D2O plus 2.8 mM Fos– choline-12 using a 50,000 molecular weight cut-off Dispo-Biodialyzer (Sigma-Aldrich). Protein concentrations were determined by UV-visible spectroscopy utilizing the heme Soret band absorbance at 410 nm (single heme extinction coefficient: 110,000M⫺1cm⫺1) and diluted to the required con-centration (MtrCAB: 8.7 mg/ml and 3.5 mg/ml, MtrAB: 9.7 mg/ml and 3.5 mg/ml) made using the dialysis buffer. 200l samples were centrifuged at 13,000⫻gfor 10 min at 4 °C before being placed in 0.1 cm path-length Suprasil quartz cuvette (Hellma) and sealed with parafilm.
Initial small-angle neutron scattering characterization was carried out on SANS2D (ISIS, Oxfordshire, UK). Monodisper-sity of the samples was confirmed via Guinier analysis over a range of concentrations and used to optimize both buffer and detergent conditions.
Further small-angle neutron scattering data were collected on D22 diffractometer of ILL (Grenoble, France) using two con-figurations of collimation 8 m and 2.8 m, and detector distance 8 m and 1.4 m, respectively. The collimation cross-section was 40 mm⫻55 mm and the sample aperture was 7 mm⫻10 mm. The exposure times ranged from 60 s to 1 h depending on sam-ple concentration, contrast, and instrument configuration. Data reduction using GRASP software included blocked beam and empty cell background subtraction, scaling for sample thickness and transmission, calibration to absolute intensity using incident neutron flux at sample position, and finally, azi-muthal averaging.
by guest on June 13, 2018
http://www.jbc.org/
Merging of curves recorded at different instrumental config-urations and buffer subtraction were done using NCNR macros for Igor Pro (WaveMetrics). Data analysis was performed using the ATSAS program suite (35). Within the ATSAS suite, the program PRIMUS (36) was used to calculate the radius of gyra-tion (Rg) and Kratky plots to evaluate disorder within the sam-ple. The program GNOM (20) was used to plot theP(r) function from the Fourier inversion of the scattering intensity,I(Q). The
P(r) function was used to calculate theRgand maximum parti-cle size (Dmax), and also for the reconstruction ofab initio enve-lopes by the application of 20 cycles in DAMMIN (37). The resulting bead models were sequentially analyzed using DAMSEL, DAMSUP, and DAMAVER to compare and identify the most probable model, align all models to the most probable model, average these aligned models and compute a probability map with the averaged model then filtered using DAMFILT (11). The averaged, filtered model was refined against the experimental data to final models to the data.
Author contributions—M. J. E., A. M., and T. A. C. data curation; M. J. E., G. F. W., C. W. L., M. L., A. M., G. H., D. J. S., J. N. B., and T. A. C. formal analysis; M. J. E., G. F. W., M. L., D. J. S., and T. A. C. validation; M. J. E., G. F. W., C. W. L., M. L., A. M., G. H., D. J. S., J. N. B., and T. A. C. investigation; M. J. E., G. F. W., and T. A. C. visualization; M. J. E., G. F. W., C. W. L., M. L., G. H., D. J. S., J. N. B., and T. A. C. methodology; M. J. E., C. W. L., D. R., J. N. B., and T. A. C. writing-original draft; M. J. E., A. M., D. J. S., D. R., J. N. B., and T. A. C. writing-review and editing; G. F. W., A. M., D. J. S., J. N. B., and T. A. C. supervision; A. M. resources; A. M. and D. J. S. software; D. J. S., D. R., and T. A. C. funding acquisition; D. J. S., D. R., J. N. B., and T. A. C. project administration; D. R. and J. N. B. conceptualization.
Acknowledgment—We are grateful to Dr. Liang Shi (University of Wuhan) for providing S. oneidensis strain LS306.
References
1. White, G. F., Edwards, M. J., Gomez-Perez, L., Richardson, D. J., Butt, J. N., and Clarke, T. A. (2016) Mechanisms of bacterial extracellular electron exchange.Adv. Microb. Physiol.68,87–138CrossRef Medline
2. Richardson, D. J., Butt, J. N., Fredrickson, J. K., Zachara, J. M., Shi, L., Edwards, M. J., White, G., Baiden, N., Gates, A. J., Marritt, S. J., and Clarke, T. A. (2012) The ’porin-cytochrome’ model for microbe-to-mineral elec-tron transfer.Mol. Microbiol.85,201–212CrossRef Medline
3. Jiao, Y., and Newman, D. K. (2007) Thepiooperon is essential for pho-totrophic Fe(II) oxidation inRhodopseudomonas palustrisTIE-1.J. Bac-teriol.189,1765–1773CrossRef Medline
4. Liu, J., Wang, Z., Belchik, S. M., Edwards, M. J., Liu, C., Kennedy, D. W., Merkley, E. D., Lipton, M. S., Butt, J. N., Richardson, D. J., Zachara, J. M., Fredrickson, J. K., Rosso, K. M., and Shi, L. (2012) Identification and char-acterization of MtoA: A decaheme c-type cytochrome of the neutrophilic Fe(II)-oxidizing bacteriumSideroxydans lithotrophicusES-1.Front. Mi-crobiol.3,37CrossRef Medline
5. Liu, Y., Wang, Z., Liu, J., Levar, C., Edwards, M. J., Babauta, J. T., Kennedy, D. W., Shi, Z., Beyenal, H., Bond, D. R., Clarke, T. A., Butt, J. N., Richard-son, D. J., Rosso, K. M., Zachara, J. M., FredrickRichard-son, J. K., and Shi, L. (2014) A trans-outer membrane porin-cytochrome protein complex for extracel-lular electron transfer byGeobacter sulfurreducensPCA.Environ. Micro-biol. Rep.6,776 –785CrossRef Medline
6. Shi, L., Rosso, K. M., Clarke, T. A., Richardson, D. J., Zachara, J. M., and Fredrickson, J. K. (2012) Molecular underpinnings of Fe(III) oxide
reduc-tion byShewanella oneidensisMR-1. Front. Microbiol.3,50CrossRef Medline
7. Hartshorne, R. S., Reardon, C. L., Ross, D., Nuester, J., Clarke, T. A., Gates, A. J., Mills, P. C., Fredrickson, J. K., Zachara, J. M., Shi, L., Beliaev, A. S., Marshall, M. J., Tien, M., Brantley, S., Butt, J. N., and Richardson, D. J. (2009) Characterization of an electron conduit between bacteria and the extracellular environment.Proc. Natl. Acad. Sci. U.S.A.106,22169 –22174
CrossRef Medline
8. Coursolle, D., Baron, D. B., Bond, D. R., and Gralnick, J. A. (2010) The Mtr respiratory pathway is essential for reducing flavins and electrodes in She-wanella oneidensis.J. Bacteriol.192,467– 474CrossRef Medline
9. Lower, B. H., Yongsunthon, R., Shi, L., Wildling, L., Gruber, H. J., Wiggin-ton, N. S., Reardon, C. L., Pinchuk, G. E., Droubay, T. C., Boily, J. F., and Lower, S. K. (2009) Antibody recognition force microscopy shows that outer membrane cytochromes OmcA and MtrC are expressed on the exterior surface ofShewanella oneidensisMR-1.Appl. Environ. Microbiol. 75,2931–2935CrossRef Medline
10. Okamoto, A., Nakamura, R., and Hashimoto, K. (2011) In-vivo identifica-tion of direct electron transfer fromShewanella oneidensisMR-1 to elec-trodes via outer-membrane OmcA-MtrCAB protein complexes. Electro-chimica Acta56,5526 –5531CrossRef
11. Volkov, V. V., and Svergun, D. I. (2003) Uniqueness ofab initioshape determination in small-angle scattering.J. Appl. Crystallogr.36,860 – 864
CrossRef
12. White, G. F., Shi, Z., Shi, L., Wang, Z. M., Dohnalkova, A. C., Marshall, M. J., Fredrickson, J. K., Zachara, J. M., Butt, J. N., Richardson, D. J., and Clarke, T. A. (2013) Rapid electron exchange between surface-exposed bacterial cytochromes and Fe(III) minerals.Proc. Natl. Acad. Sci. U.S.A. 110,6346 – 6351CrossRef Medline
13. Firer-Sherwood, M. A., Ando, N., Drennan, C. L., and Elliott, S. J. (2011) Solution-based structural analysis of the decaheme cytochrome, MtrA, by small-angle X-ray scattering and analytical ultracentrifugation.J. Phys. Chem.115,11208 –11214CrossRef Medline
14. Edwards, M. J., White, G. F., Norman, M., Tome-Fernandez, A., Ain-sworth, E., Shi, L., Fredrickson, J. K., Zachara, J. M., Butt, J. N., Richardson, D. J., and Clarke, T. A. (2015) Redox linked flavin sites in extracellular decaheme proteins involved in microbe-mineral electron transfer.Sci. Rep.5,11677CrossRef Medline
15. Marritt, S. J., McMillan, D. G., Shi, L., Fredrickson, J. K., Zachara, J. M., Richardson, D. J., Jeuken, L. J., and Butt, J. N. (2012) The roles of CymA in support of the respiratory flexibility of Shewanella oneidensis MR-1.
Biochem. Soc. Trans.40,1217–1221CrossRef Medline
16. Fonseca, B. M., Paquete, C. M., Neto, S. E., Pacheco, I., Soares, C. M., and Louro, R. O. (2013) Mind the gap: Cytochrome interactions reveal elec-tron pathways across the periplasm of Shewanella oneidensisMR-1.
Biochem. J.449,101–108CrossRef Medline
17. Paquete, C. M., Fonseca, B. M., Cruz, D. R., Pereira, T. M., Pacheco, I., Soares, C. M., and Louro, R. O. (2014) Exploring the molecular mecha-nisms of electron shuttling across the microbe/metal space.Front. Micro-biol.5,318CrossRef Medline
18. Sturm, G., Richter, K., Doetsch, A., Heide, H., Louro, R. O., and Gescher, J. (2015) A dynamic periplasmic electron transfer network enables respira-tory flexibility beyond a thermodynamic regularespira-tory regime.ISME J.9,
1802–1811CrossRef Medline
19. Feigin, L. A., Svergun, D. I., and Taylor, G. W. (1987)Structure Analysis of Small-Angle X-ray and Neutron Scattering, Plenum Press, New York 20. Svergun, D. I. (1992) Determination of the regularization parameter in
indirect-transform methods using perceptual criteria.J. Appl. Crystallogr. 25,495–503CrossRef
21. Orthaber, D., Bergmann, A., and Glatter, O. (2000) SAXS experiments on absolute scale with Kratky systems using water as a secondary standard.
J. Appl. Crystallogr.33,218 –225CrossRef
22. Le Roy, A., Wang, K., Schaack, B., Schuck, P., Breyton, C., and Ebel, C. (2015) AUC and small-angle scattering for membrane proteins.Methods Enzymol.562,257–286CrossRef Medline
23. Ross, D. E., Ruebush, S. S., Brantley, S. L., Hartshorne, R. S., Clarke, T. A., Richardson, D. J., and Tien, M. (2007) Characterization of protein-protein
by guest on June 13, 2018
http://www.jbc.org/
interactions involved in iron reduction byShewanella oneidensisMR-1.
Appl. Environ. Microbiol.73,5797–5808CrossRef Medline
24. Kozin, M. B., and Svergun, D. I. (2001) Automated matching of high- and low-resolution structural models.J. Appl. Crystallogr.34,33– 41CrossRef
25. White, G. F., Shi, Z., Shi, L., Dohnalkova, A. C., Fredrickson, J. K., Zachara, J. M., Butt, J. N., Richardson, D. J., and Clarke, T. A. (2012) Development of a proteoliposome model to probe transmembrane electron-transfer reac-tions.Biochem. Soc. Trans.40,1257–1260CrossRef Medline
26. Schicklberger, M., Bücking, C., Schuetz, B., Heide, H., and Gescher, J. (2011) Involvement of theShewanella oneidensisdecaheme cytochrome MtrA in the periplasmic stability of the-barrel protein MtrB.Appl. En-viron. Microbiol.77,1520 –1523CrossRef Medline
27. Coursolle, D., and Gralnick, J. A. (2010) Modularity of the Mtr respiratory pathway of Shewanella oneidensis strain MR-1. Mol. Microbiol. 77,
995–1008CrossRef Medline
28. Dohnalkova, A. C., Marshall, M. J., Arey, B. W., Williams, K. H., Buck, E. C., and Fredrickson, J. K. (2011) Imaging hydrated microbial extracel-lular polymers: Comparative analysis by electron microscopy.Appl. Envi-ron. Microbiol.77,1254 –1262CrossRef Medline
29. Rodrigues, M. L., Oliveira, T. F., Pereira, I. A., and Archer, M. (2006) X-ray structure of the membrane-bound cytochrome c quinol dehydrogenase NrfH reveals novel haem coordination.EMBO J.25,5951–5960CrossRef Medline
30. Coursolle, D., and Gralnick, J. A. (2012) Reconstruction of extracellular respiratory pathways for iron(III) reduction in Shewanella oneidensis
strain MR-1.Front. Microbiol.3,56CrossRef Medline
31. Shi, L., Rosso, K. M., Zachara, J. M., and Fredrickson, J. K. (2012) Mtr extracellular electron-transfer pathways in Fe(III)-reducing or
Fe(II)-oxidizing bacteria: A genomic perspective. Biochem. Soc. Trans. 40,
1261–1267CrossRef Medline
32. Alves, M. N., Neto, S. E., Alves, A. S., Fonseca, B. M., Carrêlo, A., Pacheco, I., Paquete, C. M., Soares, C. M., and Louro, R. O. (2015) Characterization of the periplasmic redox network that sustains the versatile anaerobic metabolism of Shewanella oneidensis MR-1. Front. Microbiol. 6, 665
CrossRef Medline
33. Compton, E. L., Karinou, E., Naismith, J. H., Gabel, F., and Javelle, A. (2011) Low resolution structure of a bacterial SLC26 transporter reveals dimeric stoichiometry and mobile intracellular domains.J. Biol. Chem. 286,27058 –27067CrossRef Medline
34. Breyton, C., Gabel, F., Lethier, M., Flayhan, A., Durand, G., Jault, J. M., Juillan-Binard, C., Imbert, L., Moulin, M., Ravaud, S., Härtlein, M., and Ebel, C. (2013) Small angle neutron scattering for the study of solubilised membrane proteins.Eur. Phys. J. E. Soft Matter36,71CrossRef Medline
35. Petoukhov, M. V., Franke, D., Shkumatov, A. V., Tria, G., Kikhney, A. G., Gajda, M., Gorba, C., Mertens, H. D., Konarev, P. V., and Sver-gun, D. I. (2012) New developments in the ATSAS program package for small-angle scattering data analysis.J. Appl. Crystallogr.45,342–350
CrossRef Medline
36. Konarev, P. V., Volkov, V. V., Sokolova, A. V., Koch, M. H. J., and Svergun, D. I. (2003) PRIMUS: A Windows PC-based system for small-angle scat-tering data analysis.J. Appl. Crystallogr.36,1277–1282CrossRef
37. Franke, D., and Svergun, D. I. (2009) DAMMIF, a program for rapidab initioshape determination in small-angle scattering.J. Appl. Crystallogr. 42,342–346CrossRef Medline
by guest on June 13, 2018
http://www.jbc.org/
A. Clarke
Martel, Gemma Harris, David J. Scott, David J. Richardson, Julea N. Butt and Thomas
Marcus J. Edwards, Gaye F. White, Colin W. Lockwood, Matthew C. Lawes, Anne
bacterium suggests electron transfer via periplasmic redox partners
doi: 10.1074/jbc.RA118.001850 originally published online April 10, 2018 2018, 293:8103-8112.
J. Biol. Chem.
10.1074/jbc.RA118.001850 Access the most updated version of this article at doi:
Alerts:
When a correction for this article is posted •
When this article is cited •
to choose from all of JBC's e-mail alerts Click here
http://www.jbc.org/content/293/21/8103.full.html#ref-list-1
This article cites 36 references, 13 of which can be accessed free at
by guest on June 13, 2018
http://www.jbc.org/