APPLICATION OF CLUSTERING TECHNIQUES TO MULTISPECTRAL OPTICAL
DATA OVER THE OCEAN
Margaret Joseph1, Graham D. Quartly2, Colette Robertson2, Valborg Byfield2 and Ray Harris1
1 Department of Geography, University College London, 26, Bedford Way, London, WC1H 0AP 2 National Oceanography Centre, Empress Dock, Southampton, Hants, SO14 3ZH, UK
ABSTRACT
MERIS, on Envisat, provides high-resolution radiometric data at nine discrete channels in the visible band. This paper looks at the potential of an unsupervised classification technique for utilizing these multi-spectral data to provide better discrimination between water masses according to their optical properties, and in particular whether phytoplankton groups can be distinguished. Although the majority of data do show a spectral peak associated with chlorophyll's red fluorescence line, clustering using only the red bands was found to separate out coastal waters according to their sediment content. Red-end classification also appeared to identify sub-pixel cloud, and demonstrate that the smile correction had not removed all the striping from the data. Classification using bands from the blue-green end showed a response to changes in chlorophyll concentration, but also indicated other variations. However, without in situ data no firm conclusions can be drawn on which phytoplankton groupings are present.
1. INTRODUCTION AND METHODOLOGY
The surface waters of the ocean are optically complex, with reflectances that are the result of absorption, scattering and fluorescence by plankton cells belonging to different phytoplankton taxa, which contain various pigments in addition to chlorophyll and vary widely in size and reflectivity. Pigment concentrations relative to biomass, and the relationship between chlorophyll fluorescence and chlorophyll content may vary from group to group, as well as with physiological state. In Case I waters, particle scattering and absorption by yellow substance (coloured dissolved organic material or CDOM) is directly related to plankton concentrations, and therefore co-vary with chlorophyll concentrations. In Case II waters (e.g. waters influenced by river-input) suspended sediment and yellow substance of terrestrial origin will also be present in varying concentrations and contribute to reflectances in a way that does not co-vary with chlorophyll concentration; see IOCCG [1] for further details on Case II waters.. It is therefore to be expected that the reflectance spectra obtained from different types of water, containing different plankton communities and different contributions from CDOM or suspended sediments, should vary in a way that may be used to discriminate between different water types, and potentially between different plankton communities. Thus, optical algorithms based on clustering techniques may be expected to be capable of discriminating between Case I and Case II waters, and could also provide a method for distinguishing between different phytoplankton communities. Potentially this could lead to new techniques for the monitoring of harmful algal blooms, quantification of species associated with halocarbon production in the marine environment, and studies of how the dominant groups in a region change on seasonal and interannual time scales.
Other satellite-borne colour sensors (CZCS, SeaWiFS, MODIS) have recorded radiances at a number of wavelengths in the visible band (400 to 700 nm); however, it is hoped that new terrestrial and marine applications will be developed with the advent of MERIS, with its extra bands in the orange-red part of the spectrum, the 620nm band designed for increased sensitivity to particle scattering, and the three bands (7,8 and 9) designed to measure the height of the chlorophyll fluorescence peak at ~681 nm.
In this study, instead of using knowledge of the optical spectra associated with different seawater constituents, such as chlorophyll and yellow substance, we analyse the data using unsupervised classification. This is a statistical technique that identifies the key structures within the data in a purely objective manner. The principal idea is to divide the pixels into clusters based on their measured reflectance spectra, with minimum variability within each cluster but maximum variability between clusters. The specific technique trialled here was ISODATA unsupervised classification, implemented within the ENVI software package. Unsupervised classification has been extensively used in terrestrial remote sensing, but rarely applied in the marine environment, with a few notable exceptions [2,3].
For the purpose of this short paper we concentrate on a MERIS pass of 14th Feb. 2005 running down the western edge of the Indian Ocean from the Arabian Sea, past the island of Socotra at the mouth of the Gulf of Aden, along the east coast of Madagascar and on to about 40˚S in the Southern Ocean. This dataset thus spans a diverse range of conditions from the oligotrophic waters of the central Indian Ocean to the various coastal regions. In this paper we first look at classification using the red end of the spectrum (section 2), then the blue end (section 3), and finally with all the visible channels (section 4). In section 5 we summarise the findings and discuss further extensions of this work.
__________________________________________
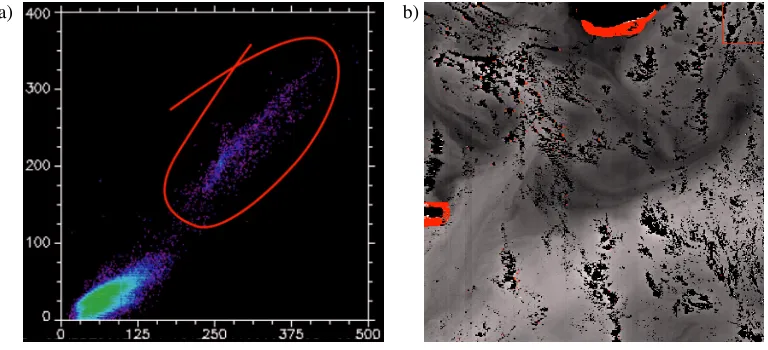
edges of islands (Fig. 1b). Examination of further MERIS images showed the persistence of these high reflectance pixels around the islands.
a)
b)
Fig. 1. a) Scatterplot of reflectances in channel 8 (x-axis) and 9 (y-axis) using all the data from the MERIS pass. Circled points are unlikely to be associated with chlorophyll fluorescence, as they have similar reflectance values in both channels. b) Zoom of channel 8 reflectances south of Socotra (black island at middle of top), with red indicating the points highlighted in the scatterplot.
2.2 Unsupervised classification
The ISODATA unsupervised classification finds an optimum set of groupings under chosen constraints. The user has to supply a range for the number of possible classes, plus the maximum number of iterations to be performed. For most cases, we required the process to produce between 5 and 10 classes, using at most 50 iterations. Under such conditions it always found 10 classes (with only 5 iterations, the process determined 7 classes). When automated clustering using bands 7, 8 & 9 was applied to the whole pass, two of the ten classes were found to represent 97.4% of the pixels. These two, indicated in red and green in Figs. 2-4 covered all the open ocean, with the green cluster predominating in the north (Fig. 2a) and the red in the south (Fig. 2b).
[image:2.595.108.492.283.458.2]a) b)
[image:3.595.128.470.97.257.2]
Fig. 2 Unsupervised classification of the whole pass using the red bands gave ten clusters indicated by different colours. Zooms are shown of a) Oman, and b) Southern Madagascar.
a)
b) c)
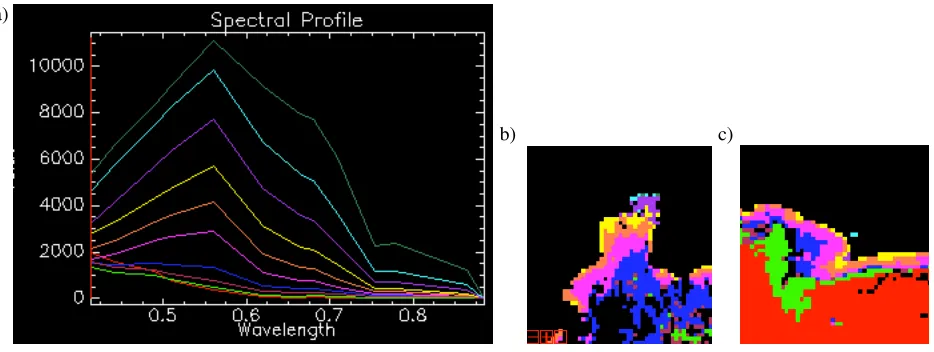
Fig. 3.a) Mean spectra associated with each of the 10 clusters. b), c) High-resolution segments from Fig. 2 showing coastal waters.
2.3 Non-oceanographic features
[image:3.595.60.527.300.476.2]
Fig. 4. a) Zoom of classification in area to north of Madagascar, showing patchy cloud (black). b) Zoom of region east of Socotra, showing near-linear boundary between red and green classes.
3. CLASSIFICATION USING THE BLUE END OF THE SPECTRUM
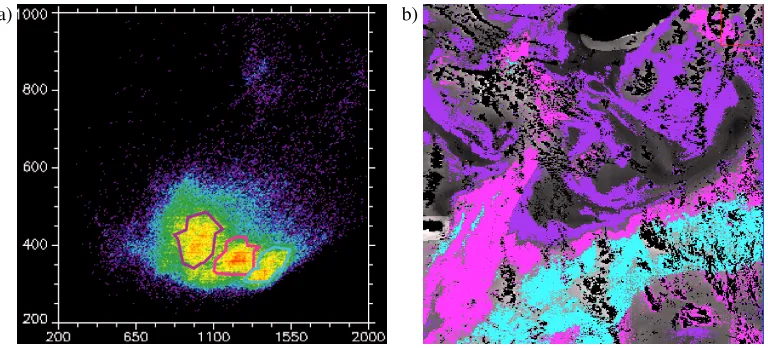
As chlorophyll is a strong absorber of blue light, the ratio of reflectances in blue and green is commonly used as the basis for algorithms estimating chlorophyll concentration [4]. However, a scatterplot of the reflectances in bands 2 and 5 (443 and 560 nm) shows a clumping of points (Fig. 5a) rather than a smooth continuum. There are also small clusters of points (not highlighted) lying above the main population.
a) b)
Fig. 5 a) Scatterplot of reflectances in channel 2 (x-axis) and 5 (y-axis), with 3 groupings highlighted in purple, pink and light blue. b) Location of these clusters within the zoom region south of Socotra.
[image:4.595.117.484.97.272.2] [image:4.595.107.491.407.581.2]a) b)
Fig. 6. a) Geographical pattern of clusters identified by unsupervised classification of channels 2,3,4 & 5. Zoom of region south of Socotra. b) Algal_1 product (chlorophyll estimate for Case I waters), with broad gradation from purple (high values) to light blue, pink, yellow, and then grey (low values).
4. CLASSIFICATION USING ALL VISIBLE BANDS
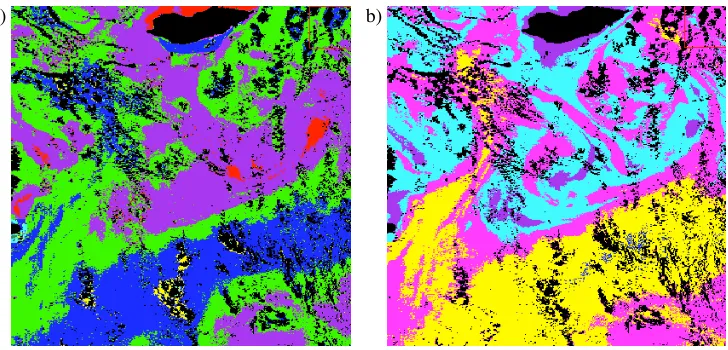
Having demonstrated that the ISODATA routine usually selects features in the limited band case that were similar to the subjective views of the operator, we then applied the technique to all nine visible bands to ascertain the key groupings present in a multi-dimensional space not easily studied by separate scatter plots. The classifier identified ten groupings with 4 of them covering 92% of observations, with great similarity in the geographical pattern (Fig. 7a) to the results of the blue-green classifier. (Note, the region highlighted in dark green in Fig. 7a is akin to the purple patch in Fig. 6a.)
a)
b)
Fig. 7. a) Geographical display of clusters derived using all visible channels, for region south of Socotra. b) Mean spectra of the 10 clusters.
[image:5.595.118.482.97.272.2] [image:5.595.92.509.447.616.2]sediment loading in the coastal waters. Application to the blue-green end of the spectrum produced 5 classes encompassing 89.6% of the data (principally open ocean waters containing phytoplankton), with a further two having spectra consistent with chlorophyll absorption. Unsupervised classification using all the visible channels produced similar results to blue-green classification, except only 4 clusters were used to explain 93.7% of the data, and an extra cluster was used to discriminate different coastal waters. The precise values determined do vary with the particular pass and extent of data used, but the above proportions are indicative of how the classification algorithm responds to different parts of the spectrum.
The strength of unsupervised classification is that it permits a statistical interpretation of MERIS data that is not dependent upon preconceived expectations about the presence of different seawater constituents, such as chlorophyll, suspended sediment or yellow substance. The weakness is absence of clear linkage between statistical classes and optically active constituents. Thus there is still a requirement for subjective interpretation.
This technique has also been used successfully for waters surrounding the UK, with similar conclusions as to sensitivity to clouds, sediment and chlorophyll [5]. However, as each classification is based upon its own data, the frequencies of occurrence of classes are not readily comparable between different regions or for different times, making such a technique difficult to use for the purpose of detecting changes. A possible way forward is to use a few MERIS passes as a training set to develop a supervised classification that can be applied to all subsequent datasets.
6. ACKNOWLEDGMENTS
The MERIS data were requested from ESA via a Category-1 proposal in support of the MadEx cruise, and were provided via RSDAS. Help from Dave Poulter and Tristan Quaife is also gratefully acknowledged.
7. REFERENCES
1. International Ocean-Colour Co-ordinating Group, Remote-sensing of ocean colour in coastal, and other optically-complex waters, IOCCG Report No. 3, IOCCG, Dartmouth, Canada, 2000.
2. Esaias, W., Iverson, R.L. and Turpie, K., Ocean Province classification using ocean colour data: observing biological signatures of variations in physical dynamics. Global Change Biology, Vol. 6, 39-55, 2000.
3. Hilger, K.B., Nielsen, A.A., Anderson, O.B., Knudesn, P. and Knudesn, T, Classification of multispectral and mulitemporal ocean colour images. Available: http://manicoral.kms.dk/PK/havf2002_clas.pdf, 2002.