H O S T E D B Y Contents lists available atScienceDirect
Progress in Natural Science: Materials International
journal homepage:www.elsevier.com/locate/pnsmi
Original Research
High e
ffi
ciency synthesis of HKUST-1 under mild conditions with high BET
surface area and CO
2
uptake capacity
Yipei Chen
a,b, Xueliang Mu
a,c, Edward Lester
b, Tao Wu
a,c,⁎ aNew Materials Institute, The University of Nottingham Ningbo China, Ningbo 315100, ChinabDepartment of Chemical and Environmental Engineering, The University of Nottingham, Nottingham NG7 2RD, UK
cMunicipal Key Laboratory of Clean Energy Conversion Technologies, The University of Nottingham Ningbo China, Ningbo 315100, China
A R T I C L E I N F O
Keywords:
Metal organic framework HKUST-1
Rapid synthesis Green synthesis CO2adsorption
A B S T R A C T
This study focuses on the development of a hydrothermal method for the rapid synthesis of good quality copper benzene-1,3,5-tricarboxylate (referred to as HKUST-1) with high yield under mild preparation conditions to address the issues associated with reported methods. Different synthesis conditions and activation methods were studied to understand their influence on the properties of HKUST-1. It was found that mixing the precursors at 50 °C for 3 h followed by activation via methanol refluxing led to the formation of a product with the highest BET specific surface area of 1615 m2/g and a high yield of 84.1%. The XRD and SEM data illustrated that the product
was highly crystalline. The sample was also tested on its capacity in CO2adsorption. The results showed strong
correlation between surface area of the sample and its CO2uptake at 1 bar and 27 °C. The HKUST-1 prepared in
this study demonstrated a high CO2uptake capacity of 4.2 mmol/g. It is therefore concluded that this novel and
efficient method can be used in the rapid preparation of HKUST-1 with high surface area and CO2uptake
capacity.
1. Introduction
Metal Organic Frameworks (MOFs) are hybrid materials that consist of organic ligands and metal ions or metal-contained clusters [1,2]. Compared with traditional porous solid adsorbents (such as zeolites, activated carbon and N-doped porous carbons[3]), MOFs possess the highest surface area among many porous materials known to date[4]. Furthermore, the structure and pore size of MOF materials are relatively easier to tune for specific applications[5]. In recent years, MOFs have been found to show great potential in CO2capture [6,7]. HKUST-1 (Cu3(BTC)2) is one of the most widely studied MOFs owing to its high surface area and large pore volume[8], which wasfirstly reported by Chui[9]in 1999. This Cu-based material consists of copper nodes and organic ligands (benzene-1,3,5-tricarboxylate, BTC), with each copper coordinated with four oxygen atoms and water molecules [9]. This framework contains a bimodal pore size distribution, i.e. a large cage with 9 Å diameter and small pores with 3.5 Å diameter[10,11].
In the past few years, various synthesis strategies were reported, such as microwave-assisted synthesis [12,13], ultrasonic synthesis [11,14], mechanochemical synthesis [15] and conventional hydro/ solvothermal synthesis. Conventional methods normally involve the use
of high temperature and pressure[16]to facilitate the formation of MOFs in shorter period of time[17]or require a long reaction time (from days to weeks[5,18]) to achieve the synthesis of MOFs under milder conditions. The other methods rely on the use of specific in-struments, such as high pressure autoclave, which is usually associated with safety issues and high costs. The surface area reported in literature ranges from 400 to 1800 m2/g, while most are within the range of 700–1000 m2/g[19–22]. Al-Janabi et al. reported an optimised pro-cedure for the synthesis of HKUST-1, which led to the production of HKUST-1 with a yield of 89.4% and Brunauer-Emmett-Teller (BET) surface area of 1507 m2/g. However, the MOF was prepared in a sealed autoclave at 100 °C which meant that elevated pressure was unavoid-able, and the preparation process required 24 h to complete. More re-cently, McKinstry et al.[23]also adopted hydrothermal methods to produce HKUST- 1 with a high surface area, but the yield was rather low especially when only ethanol was used as the solvent and only achieved 55% when DMF was used as the solvent. In summary, most recent methods involve the adoption of elevated pressure and result in the formation of products with either low yields or low surface areas. Table 1summarizes the operating conditions and properties of HKUST-1 synthesized using different hydrothermal methods.
https://doi.org/10.1016/j.pnsc.2018.08.002
Received 19 March 2018; Received in revised form 13 August 2018; Accepted 13 August 2018 Peer review under responsibility of Chinese Materials Research Society.
⁎Corresponding author.
E-mail address:[email protected](T. Wu).
1002-0071/ © 2018 Chinese Materials Research Society. Published by Elsevier B.V. This is an open access article under the CC BY-NC-ND license (http://creativecommons.org/licenses/BY-NC-ND/4.0/).
To date, very few HKUST-1 synthesis methods have been reported to operate under atmospheric pressure. In the past few years, Khoshhal et al. [24] produced HKUST-1 under atmospheric pressure with di-methyl formamide (DMF) as the solvent. However, these methods re-sulted in either a low yield or surface area. Therefore, there is still a need to develop new methods for the preparation of MOFs with high surface area and high yield under mild preparation conditions, which can also have high CO2uptake capacity.
In this study, a high efficiency solvothermal method was developed for the synthesis of HKUST-1 under atmospheric pressure and low temperature. The characterization of MOFs was conducted to optimize conditions for the synthesis of HKUST-1 with a high yield and high BET surface area. The HKUST-1 was also tested in terms of its potential in CO2adsorption.
2. Experimental
2.1. Materials and preparation method
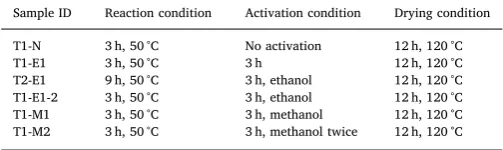
All chemicals used in this study were purchased from Sigma Aldrich and used without further purification. In a typical synthesis process, copper nitrate trihydrate (98%) and benzene-1,3,5-tricarboxylic acid (95%) were mixed and heated to 50 °C for 3 h. Upon cooling to room temperature, it was placed in a dryer operated at 120 °C for 12 h. The dried powder was then activated by using either methanol or ethanol to wash out the impurities trapped in pores. Finally, the product was centrifuged and dried at 120 °C. Table 2 lists the denominations of different products prepared in this study.
2.2. Characterization
Powder X-ray diffraction (XRD) patterns were recorded using a Bruker D8 A25 diffractometer operated at 40 kV and 35 mA between 5°2θand 40°2θwith a Cu Kαradiation. The scanning speed was 1 s/step and the step size was 0.02°[27]. Thermal stability test was performed using a thermogravimetric analyser (NETZSCH STA49 F3) following the procedure described by Zhang et al.[28]. Approximately 10 mg sample was heated from 30 to 900 °C at a heating rate of 10 K/min under high-purity nitrogen (99.999%) atmosphere. The morphology of materials was observed using a scanning electron microscope (SEM, ZEISS Sigma VP) operated at 20 kV [29,30]. Nitrogen adsorption experiment was performed using a Micromeritics Tristar 3020 instrument operated at 77k[31]. Before each test, the sample was degassed at 150 °C for 12 h.
2.3. CO2adsorption-desorption test
The CO2 uptake capacity was examined at 1 bar using the TGA (NETZSCH STA49 F3). As with a typical test, the temperature was in-itially raised to 150 °C under N2atmosphere (99.999%) and kept iso-thermal for 30 min, followed by cooling to 27 °C and kept isoiso-thermal for another 30 min. After the temperature became stable, the gasflow was switched to pure CO2for 30 min. The CO2cyclic adsorption-desorption test was performed to evaluate the stability of HKUST-1. In this cyclic test, N2gas was used to purge offthe adsorbed CO2in sample at the same temperature. The adsorption and desorption processes were re-peated for 10 times continuously. The N2 gas flow rate was set at 100 mL/min and CO2at 133 mL/min. Blank group was conducted for every test to eliminate the influence of buoyancy. Moreover, CO2 iso-thermal adsorption test was carried out using a Micromeritics ASAP 2020 instrument at 27 °C for 12 h, followed the procedure described elsewhere[32].
3. Results & discussion
3.1. Characterization of crystal structure
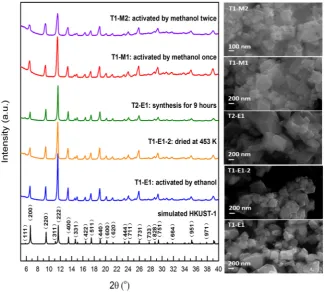
It can be seen fromFig. 1that the main X-ray diffraction peaks for each sample matched well with the patterns obtained from the simu-lation based on single crystal data, as well as those reported in the literature [33]. The sharp peaks for all samples suggested that the sample possessed high degree of crystallinity[33].
The color of as-synthesized HKUST-1 powder was light blue, but turned into dark blue after activation by ethanol or methanol. The color change in sample is consistent with those reported in literature[26]. According to Cheng et al.[34], this change implies that the co-ordi-nation number of copper has decreased from six to four. The activation process eluted the coordinated solvent or water from the copper sites. There is a small difference observed from the comparison with si-mulated patterns. The intensity ratios of (331) to (420) plane, and (200) to (220) plane are both notably higher for the simulated patterns, which can be as attributed to dehydrated samples. This phenomenon is in agreement with that reported by Schlichte et al.[16]. It is very difficult to avoid this difference because HKUST-1 rapidly adsorbs moisture from the air during the preparation process of the XRD test. Kathuria et al.[35]stated that the marked reduction of peak intensities of (111) and (200) is related to the FCC crystal structure loss on account of HKUST-1 hydration.
From the SEM images (as shown inFig. 1), no significant morpho-logical differences were observed among these activated samples. The crystal sizes are all in the range of 100–500 nm. The SEM image of T1-M2 clearly shows crystal surface defects and smaller particle size when compared with T1-M1, suggesting the second washing process has significant influence on the structure of the HKSUT-1 and damages the surface. These damages also affect surface area and CO2capacity of the sample.
[image:2.595.36.560.78.163.2]The XRD pattern of the sample without activation (T1-N) was sig-nificantly different from the activated samples. T1-M1 was taken as the benchmark to compare with T1-N. As shown inFig. 2, there are three Table 1
Comparison of HKUST-1 synthesized using different hydrothermal methods.
Years Pressure Time (h) Temperature (°C) Solvents Yield (%) SLangmuir(m2/g) SBET(m2/g)
1999[9] Elevated pressure in an autoclave 12 180 EtOH/H2O 60.0 918 692
2012[19] Elevated pressure in an autoclave 18 110 EtOH/H2O N/A N/A 1055
2015[24] Atmospheric pressure 12 80 DMF 92.0 N/A 1387
2015[25] Elevated pressure in an autoclave 24 120 EtOH/H2O N/A N/A 1140
2015[26] Elevated pressure in an autoclave 24 100 EtOH 89.4 N/A 1507
2017[23] Low pressure 5 60 EtOH 41.6 2100 N/A
2017[23] Low pressure 5 79 DMF 55.0 1200 N/A
Table 2
List of HKUST-1 samples and corresponding preparation conditions.
Sample ID Reaction condition Activation condition Drying condition
T1-N 3 h, 50 °C No activation 12 h, 120 °C
T1-E1 3 h, 50 °C 3 h 12 h, 120 °C
[image:2.595.37.289.669.744.2]main distinctive peaks at 2θ= 7.9°, 10.7°, 12.7°. The unreacted copper nitrate and trimesic acid may have remained in the samples. In addi-tion, the diffraction data of simulated Cu2(OH)3NO3 indicated their presence in the sample. It is also reported[36]that the copper based precursors include Cu2(OH)3NO3, which might be trapped in the HKUST-1 sample. However, after taking these impurities into con-sideration, the pattern of T1-N was still not consistent with that of HKUST-1. This result suggested that new crystalline complex were formed via chemical bindings[37]. The activation process has broken these bonding and therefore the XRD showed the pure phase HKUST-1. Moreover, the pH value of T1-M1 solution was measured as 0.68, and 7.22 for T1-M2 solution. These solutions were collected from the upper layer after centrifugation of each sample. The significant difference in pH value indicated that the first-time activation removed impurities trapped in the sample.
3.2. Thermogravimetric analysis
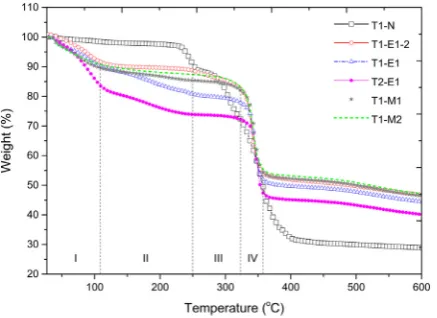
Fig. 3presents the weight loss of samples being heated from room temperature to 600 °C at a heating rate of 10 °C per minute in nitrogen atmosphere. The shapes of their respective TGA curves are similar to those reported for HKUST-1 crystals[5,38].
In the TGA profile, thefirst mass loss stage that occurred between 30 and 110 °C can be ascribed to the evaporation of physically adsorbed water. When exposed to air, HKUST-1 can instantaneously adsorb water into the pores and occupy the 96 j position[9,16]. This amount of water can be driven offwhen the sample is heated to 110 °C.
[image:3.595.135.461.56.349.2] [image:3.595.94.505.547.727.2]The two samples activated by ethanol (T1-E1, T2-E1) showed an obvious weight loss in stage (II) between 110 and 250 °C, which in-dicates the release of water that is chemically bonded on copper atoms, and solvent that is physically adsorbed in internal pores[16]. This is Fig. 1.XRD patterns and SEM images of the samples synthesized under different reaction conditions.
consistent with that reported by Lestari et al.[20]. The coordination bonds between water and copper require a higher temperature (150–300 °C) to break, which is higher than the temperature needed for physically adsorbed water molecules to be released upon heating.
It is obvious that the samples activated by methanol showed a small weight loss in this stage, whereas the sample without activation (T1-N) exhibited a plateau in the temperature range from 30 to 230 °C. This indicates that no solvent was physically adsorbed in the pores. This can be explained by the non-porous structure of T1-N, which was examined by the N2adsorption experiment discussed in the next part. Hence, it is possible that the guest molecules released in stage II are formed during the ethanol activation process. It should be noted that the sample ac-tivated by using ethanol which underwent drying at 180 °C (T1-E1-2) exhibited no obvious mass loss upon heating. This suggests that the higher drying temperature could eliminate guest molecules, but on the other hand, it might also lead to the formation of more defects on the framework.
[image:4.595.55.274.56.215.2] [image:4.595.322.539.56.207.2] [image:4.595.307.558.259.336.2]All activated samples only showed a small weight loss in stage III and started to breakdown when temperature was raised further to above 320 °C (stage IV), which is attributed to the damage of the re-latively weak coordination bond between copper and the ligands [39,40]. However, for the sample without washing and activation, the weight loss occurred in a broader region as a result of the residuals, such as unreacted chemicals mixed in the product, that were trapped in pores. Powder XRD analysis showed the compositions of the decom-posed sample after being heated to 600 °C, which were Cu, Cu2O and CuO. This is consistent with those reported in literature[16]. It can therefore be concluded that methanol is a better activation agent than ethanol since the sample activated by methanol contained much lesser impurities than those washed by ethanol. Methanol can be exchanged with guest molecules trapped inside the pore system at a higher effi -ciency than ethanol.
3.3. Textual properties
N2adsorption-desorption isotherms at 77 K are shown inFig. 4. The non-activated sample exhibited a plateau with almost zero N2 adsorp-tion, indicating its non-porous structure. Isotherm curves with similar shapes were found for the samples such as M1, T2-E1, E1 and T1-E1-2. The adsorption equilibriums were quickly reached in the low relative pressure region, and there were no hysteresis loops shown under high relative pressure. This shape indicates that it is Type I iso-therm according to the IUPAC (International Centre for Theoretical and Applied Chemistry) classification[22,41]. Normally, samples with Type I isotherm are of microporous (< 2 nm) structure[15].
BET surface area and porosity properties of samples are listed in Table 3. The sample activated once by methanol showed the highest BET surface area of 1616 m2/g. Its total pore volume and micropore
volume were determined to be 0.69 and 0.61 cm3/g, respectively. These values are relatively high as compared with the reported results (as shown inTable 1). The high gas uptake capacity suggested that the guest molecules in the pores were removed after activation process [42], which is also consistent with the TGA results. The surface areas of T1-E1 and T2-E1 were very similar, so were the pore volumes. There-fore, it is suggested that mixing time does not have significant influence on the textural properties of sample and thus three-hour mixing is adequate. However, T1-E1-2 is of a much lower surface area, which is attributed to the drying process. The BET surface area of T1-M2 is about half that of the T1-M1. It can be seen fromFig. 4, T1-M2 presented a hysteresis loop in the high relative pressure region, which was attrib-uted to the stacking of particles or capillary condensation occurring in the mesopores (2–50 nm)[43,44]. The mesopores were formed in the second washing process while the micropore structure was ruined to some extent. The BET and porosity results suggested that methanol is a better activation agent than ethanol for purifying the sample. This can be attributed to the smaller size of methanol molecules thus making it easier to exchange with the molecules trapped in the pores. In addition, optimisation involves washing once with methanol to achieve a high surface area and to avoid damages to the micropores.
3.4. CO2adsorption and structure stability
More often than not, the high surface area of MOFs is a significant feature which leads to a high CO2uptake capacity [4]. In addition, HKUST-1 contains unsaturated metal sites (also known as open metal sites) with relatively strong affinity towards CO2 [45,46]. Therefore, this study aims to examine the CO2adsorption performance of HKUST-1 prepared in this study and any enhancement resulted from this novel approach.
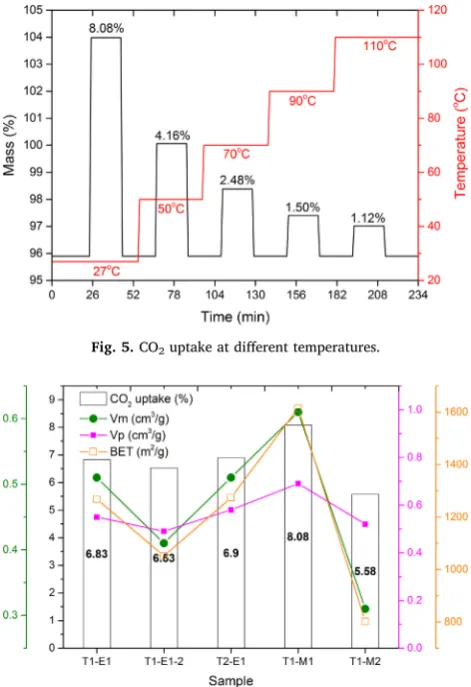
The CO2adsorption was carried out using a TGA under atmospheric pressure. Different temperatures were tested to investigate the infl u-ence of temperature on CO2uptake.Fig. 5shows the amount of CO2 adsorbed on the T1-M1 at 27, 50, 70, 90 and 110 °C. It was found that CO2uptake was 8.08%, which is relatively high as compared with data Fig. 3.Thermogravimetric analysis of various samples. Fig. 4.N2adsorption-desorption isotherms for different samples.
Table 3
Textural properties of different HKUST-1s.a
Sample ID SBET(m2/g) SLangmuir(m2/g) Vp(cm3/g) Vm(cm3/g)
T1-N 0 0 – –
T1-E1 1268 1475 0.55 0.51
T1-E1-2 1052 1208 0.49 0.41
T2-E1 1274 1501 0.58 0.51
T1-M1 1615 1806 0.69 0.61
T1-M2 801 972 0.52 0.31
a Vp: total pore volume at 0.99 p/p
0, Vm: micropore volume by t-plot
reported by others[41,47].Fig. 6illustrates the relationship between the textural properties of MOFs and CO2uptake. It is clear that textural property has strong influence on CO2uptake. T1-M1, which possesses the highest CO2uptake capacity (8.08% or 1.84 mmol/g) among the
five samples, has the highest Vm, Vp as well as BET surface area. The CO2adsorption isotherm curve of the sample with the highest surface area (T1-M1) is shown inFig. 7. The test was conducted at 27 °C and low pressure in order to match the post-combustion CO2capture application environment, since the partial pressure of CO2in theflue gas is often around 1 bar or lower[46,48]. The result shows that under
1 bar the HKUST-1 synthesized in this study was able to adsorb 4.2 mmol/g (equals to 18.5%) of CO2. This value is much higher than that obtained in this study using TGA (8.08% or 1.84 mmol/g). This is believed to be due to the sample being degassed in advance before CO2 adsorption isotherm was obtained, thus releasing more sites for CO2 uptake.
It was reported[49]that at atmospheric temperature and pressure, CO2uptake capacity of some commonly used MOFs varies from 2.9 to 5.1 mmol/g.Table 4shows the comparison of HKUST-1 synthesized in this study with reported data in terms of CO2adsorption performance. Compared with most previously reported HKUST-1 samples, the pro-duct synthesized in this work showed a relatively higher CO2 adsorp-tion capacity. Although the absolute amount of CO2uptake was slightly lower than the HKUST-1 reported by Wang et al.[50], the reported adsorption temperature was 22 °C, which was 5 °C lower than the ad-sorption temperature adopted in this study (27 °C). This could be a reason for the slightly higher performance recorded by Wang et al. since CO2uptake ability is highly favored by lower temperatures[51].
In addition, compared with the other widely studied adsorbents listed inTable 4, the HKUST-1 prepared in this study showed superior adsorption capability under similar adsorption conditions. This is as-cribed to its unsaturated metal centers with stronger physisorption
af-finity towards CO2. Therefore, it can be concluded that HKUST-1 pre-pared in this study is promising in the CO2adsorption[46,48].
[image:5.595.45.281.55.399.2] [image:5.595.306.557.78.181.2]Since the structural stability of the adsorbent is another significant factor to be considered in CO2adsorption applications, the CO2cyclic adsorption-desorption test of T1-M1 was conducted and the results are shown inFig. 8. The amount of CO2adsorbed by the MOF of each cycle was almost the same, suggesting that with N2feeding CO2was almost completely outgassed and the product can be regenerated for further adsorption of CO2. Moreover, the product retained its structural in-tegrity after multiple cycles. Thisfinding suggests that the HKUST-1 synthesized in this study could be regenerated without losing its CO2 uptake capacity. The reversible adsorption also demonstrates that the Fig. 5.CO2uptake at different temperatures.
Fig. 6.Relationship between CO2capacity and total pore volume, micropore
volume and BET surface area.
[image:5.595.55.276.558.728.2]Fig. 7.CO2isotherm curve at ambient temperature.
Table 4
CO2adsorption capacity of various MOFs.
MOF name Adsorption capacity (mmol/g)
Adsorption condition
Reference
HKUST-1 1.82 30 °C, 10 bar
HKUST-1 3.27 25 °C, 103 kPa [49]
HKUST-1 4.20 27 °C, 1 bar This study
HKUST-1 4.50 22 °C, 0.9 bar [50]
MIL-101(Cr) 1.17 30 °C, 10 bar [41]
ZIF-8 0.76 25 °C, 1 bar [52]
UIO-66(Zr) 2.70 25 °C, 2 bar [53]
NUT-6 3.70 25 °C, 1 bar [54]
[image:5.595.324.542.565.726.2]interaction between metal and CO2does not involve chemical bonding [45]. This stability agrees well with other researchers` cyclic tests on MOFs[55,56].
4. Conclusion
In this study, a new method has been developed for the rapid and highly efficient synthesis of HKUST-1 MOFs with high surface area (1615 m2/g). This method allows the synthesis of HKUST-1 to be car-ried out safely under ambient pressure and mild temperature leading to a high yield of MOFs at 84.1%. In addition, the CO2adsorption tests showed that the HKUST-1 prepared in this study has a good CO2uptake capacity of 4.2 mmol CO2/g.
Acknowledgements
The Ministry of Science and Technology, China is acknowledged for partially sponsoring this research under its National Key R&D Programme (2017YFB0603202). The University of Nottingham UK and the University of Nottingham Ningbo China are acknowledged for providing thefirst two authors with full scholarships.
References
[1] Z.-G. Gu, J. Zhang, Epitaxial growth and applications of oriented metal–organic framework thinfilms, Coord. Chem. Rev. (2017).
[2] Z.G. Gu, D.J. Li, C. Zheng, Y. Kang, C. Wöll, J. Zhang, Angew. Chem. Int. Ed. 56 (24) (2017) 6853–6858.
[3] J. Kou, L.-B. Sun, Ind. Eng. Chem. Res. 55 (41) (2016) 10916–10925.
[4] Y. Liu, Z.U. Wang, H.-C. Zhou, Greenh. Gases: Sci. Technol. 2 (4) (2012) 239–259. [5] L.H. Wee, M.R. Lohe, N. Janssens, S. Kaskel, J.A. Martens, J. Mater. Chem. 22 (27)
(2012) 13742–13746.
[6] J.L.C. Rowsell, O.M. Yaghi, Microporous Mesoporous Mater. 73 (1–2) (2004) 3–14. [7] Y. Jin, C. Zhao, Y. Lin, D. Wang, L. Chen, C. Shen, J. Mater. Sci. Technol. 33 (8)
(2017) 768–774.
[8] D. Zhang, Y. Xu, Q. Liu, Z. Xia, Inorg. Chem. 57 (8) (2018) 4613–4619. [9] S.S.-Y. Chui, S.M.-F. Lo, J.P. Charmant, A.G. Orpen, I.D. Williams, Science 283
(5405) (1999) 1148–1150.
[10] L. Oar-Arteta, T. Wezendonk, X. Sun, F. Kapteijn, J. Gascon, Mater. Chem. Front. (2017).
[11] Z. Bacsik, R. Atluri, A.E. Garcia-Bennett, N. Hedin, Langmuir 26 (12) (2010) 10013–10024.
[12] Z. Ni, R.I. Masel, J. Am. Chem. Soc. 128 (38) (2006) 12394–12395.
[13] S.H. Jhung, J.H. Lee, J.W. Yoon, C. Serre, G. Férey, J.S. Chang, Adv. Mater. 19 (1) (2007) 121–124.
[14] Z.-Q. Li, L.-G. Qiu, T. Xu, Y. Wu, W. Wang, Z.-Y. Wu, X. Jiang, Mater. Lett. 63 (1) (2009) 78–80.
[15] M. Klimakow, P. Klobes, A.F. Thünemann, K. Rademann, F. Emmerling, Chem. Mater. 22 (18) (2010) 5216–5221.
[16] K. Schlichte, T. Kratzke, S. Kaskel, Microporous Mesoporous Mater. 73 (1) (2004) 81–88.
[17] L. D'Arras, C. Sassoye, L. Rozes, C. Sanchez, J. Marrot, S. Marre, C. Aymonier, New J. Chem. 38 (4) (2014) 1477–1483.
[18] Z.-G. Gu, H. Fu, T. Neumann, Z.-X. Xu, W.-Q. Fu, W. Wenzel, L. Zhang, J. Zhang, C. Wöll, ACS Nano 10 (1) (2015) 977–983.
[19] K.-S. Lin, A.K. Adhikari, C.-N. Ku, C.-L. Chiang, H. Kuo, Int. J. Hydrog. Energy 37 (18) (2012) 13865–13871.
[20] W.W. Lestari, M. Adreane, C. Purnawan, H. Fansuri, N. Widiastuti, S.B. Rahardjo,
IOP Conference Series: Materials Science and Engineering; IOP Publishing, 2016, p. 012030.
[21] A.S. Münch, F.O. Mertens, J. Mater. Chem. 22 (20) (2012) 10228–10234. [22] I. Majchrzak-Kucęba, D. Bukalak-Gaik, J. Therm. Anal. Calorim. 125 (3) (2016)
1461–1466.
[23] C. McKinstry, E.J. Cussen, A.J. Fletcher, S.V. Patwardhan, J. Sefcik, Chem. Eng. J. (2017).
[24] S. Khoshhal, A.A. Ghoreyshi, M. Jahanshahi, M. Mohammadi, RSC Adv. 5 (31) (2015) 24758–24768.
[25] K.-Y.A. Lin, Y.-T. Hsieh, J. Taiwan Inst. Chem. Eng. 50 (2015) 223–228. [26] N. Al-Janabi, P. Hill, L. Torrente-Murciano, A. Garforth, P. Gorgojo, F. Siperstein,
X. Fan, Chem. Eng. J. 281 (2015) 669–677.
[27] D. Bazer-Bachi, L. Assié, V. Lecocq, B. Harbuzaru, V. Falk, Powder Technol. 255 (2014) 52–59.
[28] S. Zhang, H. Liu, P. Liu, Z. Yang, X. Feng, F. Huo, X. Lu, Nanoscale 7 (21) (2015) 9411–9415.
[29] S. Shen, W. Wu, K. Guo, J. Chen, J. Mater. Sci. Technol. 14 (4) (2007) 369–372. [30] X. Mu, Y. Chen, E. Lester, T. Wu, Microporous Mesoporous Mater. (2018). [31] W. Liu, Y. Xu, W. Zhou, X. Zhang, X. Cheng, H. Zhao, S. Gao, L. Huo, J. Mater. Sci.
Technol. 33 (1) (2017) 39–46.
[32] L. Cheng, Y. Jiang, S.-C. Qi, W. Liu, S.-F. Shan, P. Tan, X.-Q. Liu, L.-B. Sun, Chem. Mater. 30 (10) (2018) 3429–3437.
[33] S. Gadipelli, Z. Guo, Chem. Mater. 26 (22) (2014) 6333–6338.
[34] Y. Cheng, A. Kondo, H. Noguchi, H. Kajiro, K. Urita, T. Ohba, K. Kaneko, H. Kanoh, Langmuir 25 (8) (2009) 4510–4513.
[35] A. Kathuria, M.G. Abiad, R. Auras, Polym. Int. 62 (8) (2013) 1144–1151. [36] T. Toyao, K. Liang, K. Okada, R. Ricco, M.J. Styles, Y. Tokudome, Y. Horiuchi,
A.J. Hill, M. Takahashi, M. Matsuoka, Inorg. Chem. Front. 2 (5) (2015) 434–441. [37] C. Zheng, H. Ren, Z. Cui, F. Chen, G. Hong, J. Alloy. Compd. 477 (1) (2009)
333–336.
[38] Y. Guo, Y. Mao, P. Hu, Y. Ying, X. Peng, ChemistrySelect 1 (1) (2016) 108–113. [39] K. Sumida, D.L. Rogow, J.A. Mason, T.M. McDonald, E.D. Bloch, Z.R. Herm,
T.-H. Bae, J.R. Long, Chem. Rev. 112 (2) (2012) 724–781.
[40] K. Tan, N. Nijem, Y. Gao, S. Zuluaga, J. Li, T. Thonhauser, Y.J. Chabal, CrystEngComm 17 (2) (2015) 247–260.
[41] S. Ye, X. Jiang, L.-W. Ruan, B. Liu, Y.-M. Wang, J.-F. Zhu, L.-G. Qiu, Microporous Mesoporous Mater. 179 (2013) 191–197.
[42] Y.-R. Lee, J. Kim, W.-S. Ahn, Korean J. Chem. Eng. 30 (9) (2013) 1667–1680. [43] M. Klimakow, P. Klobes, K. Rademann, F. Emmerling, Microporous Mesoporous
Mater. 154 (2012) 113–118.
[44] A. Omri, S.D. Lambert, J. Geens, F. Bennour, M. Benzina, J. Mater. Sci. Technol. 30 (9) (2014) 894–902.
[45] I. Spanopoulos, I. Bratsos, C. Tampaxis, D. Vourloumis, E. Klontzas, G. Froudakis, G. Charalambopoulou, T. Steriotis, P. Trikalitis, Chem. Commun. 52 (69) (2016) 10559–10562.
[46] R. Sabouni, H. Kazemian, S. Rohani, Environ. Sci. Pollut. Res. 21 (8) (2014) 5427–5449.
[47] R. Chugh, P. Bajpai, H.G. Bhunia, Carbon Dioxide Adsorpt. Metal. Org. Framew. Basolite C300 (2015).
[48] J. Liu, Y. Wang, A.I. Benin, P. Jakubczak, R.R. Willis, M.D. LeVan, Langmuir 26 (17) (2010) 14301–14307.
[49] M. Du, L. Li, M. Li, R. Si, RSC Adv. 6 (67) (2016) 62705–62716.
[50] Q.M. Wang, D. Shen, M. Bülow, M.L. Lau, S. Deng, F.R. Fitch, N.O. Lemcoff, J. Semanscin, Microporous Mesoporous Mater. 55 (2) (2002) 217–230. [51] M.-W. Yang, N.-C. Chen, C.-H. Huang, Y.-T. Shen, H.-S. Yang, C.-T. Chou, Energy
Procedia 63 (2014) 2351–2358.
[52] J. McEwen, J.-D. Hayman, A.O. Yazaydin, Chem. Phys. 412 (2013) 72–76. [53] C. Chen, Y.-R. Lee, W.-S. Ahn, J. Nanosci. Nanotechnol. 16 (5) (2016) 4291–4301. [54] S. Mane, Z.-Y. Gao, Y.-X. Li, D.-M. Xue, X.-Q. Liu, L.-B. Sun, J. Mater. Chem. A 5 (44)
(2017) 23310–23318.
[55] S. Nandi, P. De Luna, T.D. Daff, J. Rother, M. Liu, W. Buchanan, A.I. Hawari, T.K. Woo, R. Vaidhyanathan, Sci. Adv. 1 (11) (2015) e1500421.