Using simulation modelling to improve the design and management of furrow irrigation in smallholder plots.
Philip K Langat 1,2 and Steven R Raine2 1Ministry of Agriculture, P.O. Box 4, Kabarnet, Kenya
Email: [email protected]
Tel: +254-53-222108
2 Cooperative Research Centre for Irrigation Futures & National Centre for Engineering in Agriculture, Faculty of Engineering and Surveying, University of Southern Queensland, Toowoomba, 4350, Australia.
Email: [email protected]
Fax: + 61 7 4631 2526
Abstract
Over 70 % of all irrigated land in Sub-Sahara Africa is currently under surface irrigation.
However, the performance of surface irrigation in this region is often low resulting in
significant deep drainage losses and sustainability concerns. This is of a particular concern
for tenant based large scale irrigation scheme located in arid and semi-arid areas which are
prone to salinity and drainage problems. Field design and irrigation management practices
have a significant impact on performance but have received only limited consideration to
date. Externally funded irrigation projects in the region are usually constructed using generic
design parameters with limited or no analysis of local soil and operational conditions.
Similarly, irrigation design and management guidelines for in-field irrigation management
are generally lacking due to the high cost and time involved in obtaining data for traditional
evaluations. This paper uses data collected from small-holder irrigation plots in the Tana
River Basin to demonstrate the benefits of using the simulation program SIRMOD to
evaluate the performance of surface irrigation practices. It also discusses the benefits of
simulation modelling for identifying irrigation performance indices and guidelines for
Keywords: Agricultural water management; furrow irrigation; modeling
1.0 Introduction
Over 70% of irrigated land is currently under surface irrigation in Sub-Sahara Africa (SSA)
and it seems likely to continue to be widely practised for the foreseeable future. However, the
performance of surface irrigation in this region is often low resulting in significant deep
drainage losses and sustainability concerns (Gichuki 1996; Kandiah 1997; Kirpich et al.
2000). This is of a particular concern for tenant-based irrigation schemes located in arid and
semi-arid areas (Hughes 1984; Maingi & Marsh 2001; Ledec 1987) which are prone to
salinity and drainage problems (Bakker et al. 2006).
Field design and irrigation management practices have a significant impact on surface
irrigation performance (Clemmens 2000; Horst 1998; Raine et al. 1998) but have received
only limited consideration to date (Horst 1998). Improper design and management of furrow
irrigation systems may result in water wastage, water-logging and losses of fertilisers and
pesticides out of root zones. Externally funded irrigation projects in the SSA region are
usually constructed using generic design parameters with limited or no analysis of local soil
and operational conditions (Horst 1998). Similarly, irrigation design and management
guidelines for infield irrigation management are generally lacking due to the high cost and
time involved in obtaining and analysing data for traditional evaluations.
Furrow irrigation system design and management parameters which can be altered by farmers
with little effort and cost include inflow rates and irrigation cut-off time (Walker &
Skogerboe 1987; Zerihun et al. 2001). Traditionally, inflow rates and cut-off time are
previous irrigation experiences in making decisions regarding these parameters and often,
where experience is lacking, identification and adoption of appropriate management practices
is difficult. It is also common for farmers to make decisions on cut-off based on how long
water is made available by the managing statutory authorities. Hence, farmers often irrigate
for longer than is necessary.
The use of simulation models to develop irrigation guidelines for design and management
practices provides opportunities for advisors and farmers to make more informed and timely
irrigation decisions. The objective of this paper is to demonstrate the potential to use
simulation modelling to improve the performance of surface irrigation practices using data
collected from smallholder irrigation plots in the Bura Irrigation Scheme, Kenya.
2.0 Methods and Materials 2.1 Field data
The field data used in this evaluation was obtained from Mwatha and Gichuki (2000) who
conducted furrow irrigation trials in the Bura Irrigation Scheme, Kenya. The Bura Irrigation
Scheme is located in the Tana River Basin and was initially developed in 1979 to settle
landless farmers and grow irrigated cotton for export. The Bura area is located at latitude 10o 8’S and longitude 39o 45’ E and has an elevation of 110 m above sea level. The mean annual rainfall and evaporation are 400 and 2490 mm, respectively. The rainfall is bimodal, with
long rains occurring in March to May and short rains occurring in November to December.
Soils in the Bura area are shallow sandy clay loams and heavy cracking clays overlying saline
The irrigation water in the Bura Irrigation Scheme is pumped from the Tana River into
settling basins and main scheme canals before being siphoned into 0.9 m spaced furrows
within the small-holder irrigation fields. Mwatha and Gichuki (2000) reported data for two
irrigations (fifth irrigation is considered in this paper) during the 1989 growing season from
four irrigated cotton fields (lengths of 275-300 m). Furrow characteristics, soil moisture
content and irrigation parameters data were collected from February to October 1989 when
cotton was growing. The evaluation data were obtained from four fields with average slopes
of 0.09, 0.13, 0.25 and 0.31 % denoted in this paper as 9S, 13S, 25S and 31S, respectively.
Within each field there were three inflow rate treatments (1.5, 2.0 and 3.0 Ls-1 furrow-1) and data were collected from four furrows in each treatment. Inflow was measured using Parshall
flumes spaced at 50 m intervals along the furrows and for the purpose of this analysis it was
assumed there was no inflow variability. All data were collected from plots located on the
same soil type (Mwatha and Gichuki, 2000). The fifth irrigation had a deficit of 63 mm as
measured by the difference in the volumetric soil moisture content taken at 50 m distances
along the field before the irrigation and two days after irrigation (Mwatha and Gichuki,
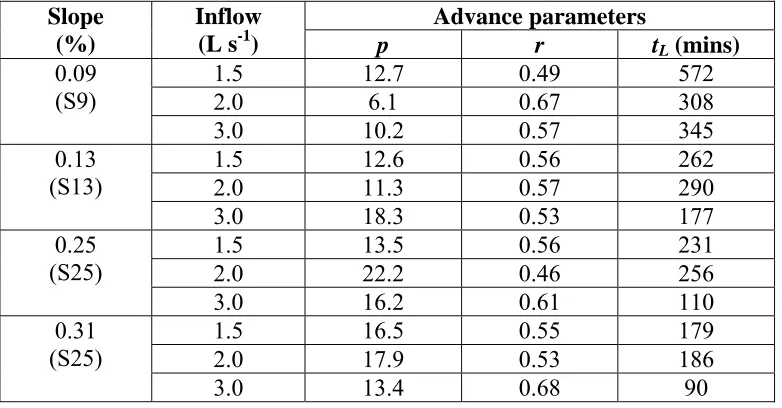
2000). Table 1 shows the measured furrow characteristics while the irrigation inflow and
advance parameters for the four fields are given in Table 2.
Table 1: Geometry characteristics for furrows in the Bura Irrigation Scheme (from Mwatha and Gichuki, 2000)
Parameter Value Furrow length 275-300m
Furrow spacing 0.9 m
Furrow slope 0.05 %- 0.3%
Cross-section parabolic Top-width (T) A T= 2.8y0.62
Wetted perimeter (wp) A wp=2.8y0.65 Area of flow A A=1.48y1.55
Table 2: Advance parameters for the fifth irrigation event, Bura Irrigation Scheme (from Mwatha and Gichuki, 2000)
Advance parameters Slope
(%)
Inflow
(L s-1) p r tL (mins)
1.5 12.7 0.49 572 2.0 6.1 0.67 308 0.09
(S9)
3.0 10.2 0.57 345 1.5 12.6 0.56 262 2.0 11.3 0.57 290 0.13
(S13)
3.0 18.3 0.53 177 1.5 13.5 0.56 231 2.0 22.2 0.46 256 0.25
(S25)
3.0 16.2 0.61 110 1.5 16.5 0.55 179 2.0 17.9 0.53 186 0.31
(S25)
3.0 13.4 0.68 90
2.3 Infiltration parameters
Infiltration parameters for the furrows were estimated using an inverse solution technique and
the software INFILT (McClymont and Smith, 1996). This software is designed to calculate
soil infiltration parameters using only inflow and advance data and has been used over a
range of soils and situations (Bakker et al., 2006; Khatri and Smith, 2005; Smith et al., 2005;
Raine et al., 2005). The soil infiltration characteristics are derived from the advance
trajectory assuming a power advance function (Walker and Skogerboe, 1987):
x = p(ta)r Equation 1
where ta is the time taken for the water to reach advance distance x, and p and r are fitted
advance parameters. INFILT calculates the soil infiltration characteristics from the fitted
power curve parameters based on the equivalent furrow infiltration Kostiakov-Lewis
equation:
where z is the cumulative infiltration (in m), דis the time the water has been applied to the
soil (in minutes), fo is the steady state infiltration rate of the soil (in m3/min/m) and k and a are fitted parameters. INFILT uses three or more advance points to determine best fit values
for the three infiltration parameters a, k and fo. Where a minimum of four advance points are provide, it is also able to estimate the cross-sectional area of flow term (σyAo) if this term is
fixed as an input parameter. However, in this study, the inlet area of flow (Ao) was calculated
using the Manning’s equation and the measured furrow geometry (Table 1).
2.4 Simulation
The estimated soil infiltration parameters from INFILT, measured inflow rates (Table 2) and
furrow geometry (Table 1) were used in the latest version of the surface irrigation model
SIRMOD (version 4) (Walker 2001) to reproduce each irrigation event as measured.
Calibration of the model for each event was conducted by adjusting the hydraulic resistance
term (Manning n) until the simulated advance matched the measured advance at the end of
the furrow.
After calibration, the model was used to evaluate the performance of a range of different
designs (e.g. furrow length) and management (e.g. inflow rate, irrigation period) options.
SIRMOD has the capability of modifying the infiltration function based on changes in furrow
wetted perimeter (Equation 3) at different inflow rates:
b
WP WP
⎭ ⎬ ⎫ ⎩ ⎨ ⎧ =
1 2
where WP1 is the wetted perimeter (in m) for inflow rate Q1, WP2 is the wetted perimeter (in
m) for simulated inflow rate Q2 and b is an empirical exponent. In this study, the exponent
was assumed to be unity for simplicity although Alvarez (2003) and Mailhol et al. (2005)
have indicated that greater benefits may be obtained by measuring it for any particular site or
soil type.
The performance of a furrow irrigation system can be described by three different, but
interacting, indices: application efficiency (Ea), requirement efficiency (Er) and distribution
uniformity (DU) (Zerihun et al. 2001). It is commonly assumed that deep percolation and
run-off is weighted equally in optimisation of application efficiency.
This study evaluated the potential irrigation performance that can be attained under the
present design conditions assuming adequate farmer irrigation management practices. Other
assumptions included: (a) furrow length of 285 m, (b) 3.0 L s-1 inflow rate is the non-erosive limit in the study area, and (c) the farmer practice is to ensure that the irrigation requirement
efficiency is met (i.e. Er ≥ 90%). The infiltration function obtained from the 1.5 L s-1 treatment furrow in each field was used for the performance predictions using SIRMOD. The
optimisation involved varying inflow rates (Qo), cut–off time (tco) and the presence or
absence of furrow end-dyking. Current farmer management was assumed to be the
performance obtained if the irrigation was cut-off when the water advance reached the end of
the furrow. However, it should be noted that this may have overstated the existing
performance as many farmers cut-off long after the water advance has reached the end of the
3.0 Results and discussion
3.1 Effect of inflow rates and cut-off time
The application efficiency for the existing design and management practices ranged from 31
to 99%. Distribution uniformity ranged from about 70 to 91% and requirement efficiency
from 75 to 99.5%. Field S9 had a low application efficiency (<38%) irrespective of the
management strategy which suggests that design changes (in field length) are required to
improve the performance of this field.
For fields S13, S25 and S31, increasing inflow rate from1.5 to 3.0 L s-1 and optimising cut-off time increased the average application efficiency from 79.4 to 87.5%. However,
increasing inflow rate to 3.0 L s-1 and cut-off when the advance reaches the end of the field produced an average application efficiency of 84.5%. Increasing the inflow rate and reducing
the cut-off time to equal 90% of the advance time improved the application efficiency to
88.7% across the fields. Introducing furrow end-dyking increased the distribution uniformity
by between 0.3 and 5.2% but did not significantly affect application or requirement
efficiency. However, the furrow end-dykes were over-topped by the irrigation in some
events (e.g. field S31 with inflow rate of 3.0 L s-1). It should also be noted that end-dyking may also cause surface drainage problems under high rainfall conditions.
Traditional furrow irrigation design and management commonly attempts to maximise the
requirement efficiency (i.e. Er ~ 100%). However, where the distribution uniformity is high,
the only implication of a low requirement efficiency (i.e Er < 90%) is that the next irrigation
is required to be sooner than originally planned. Lower requirement efficiencies may also
Bura, generally have little understanding of either the interval between irrigations or
irrigation opportunity time required to satisfy the desired soil-water deficit. Irrigation
application is often continued as long as water is available or until it is convenient to be
manually switched off. Thus, significant water losses due to excessive drainage and tail water
run-off may be experienced.
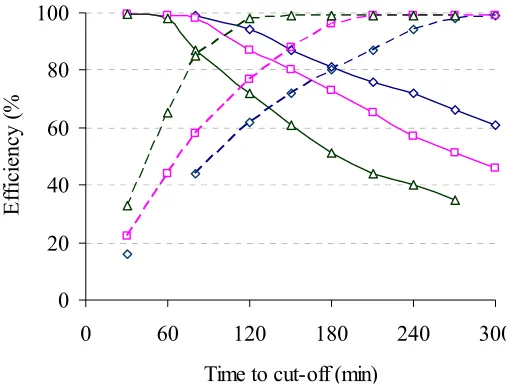
The relationship between inflow rate and cut-off time, and the application or requirement
efficiency for the S31 field, is shown in Figure 1. This figure can be used as a decision
support aid in irrigation management to provide advice or strategies to reduce water and
energy costs and give improved environmental management. For example, a farmer using an
inflow rate of 2.0 L s-1 can achieve an application and requirement efficiency of 79 and 98%, respectively by irrigating for 180 min. However, irrigating for longer periods will
significantly reduce application efficiency without improving the requirement efficiency.
Hence, switching off the irrigation at an appropriate time would not only reduce the volume
of tailwater run-off but also the volume of water lost as deep percolation and, thus, save a
significant quantity of water.
0 20 40 60 80 100
0 60 120 180 240 300
Time to cut-off (min)
E
ff
ic
iency (
[image:9.595.171.424.520.713.2]%
Figure 1: Effect of irrigation cut-off time on application () and requirement () efficiencies for a 300 m field length and water application discharges (∆ =1.5, □ = 2.0 and
3.3 Effect of furrow length
Significant deep drainage due to surface irrigation has the potential to affect groundwater
levels and contribute to salinity in the river basin. On high infiltration soils (e.g. field S9),
changes in furrow length may be needed to reduce deep drainage. For the S9 field,
optimisation of cut-off time for various furrow lengths was conducted to identify the
opportunity to improve performance. Deep percolation ratio is defined as the ratio of volume
of irrigation water lost below the root zone to the total volume of water applied.
0 20 40 60 80 100
0 50 100 150 200 250 300
Length (m)
Irri
g
a
ti
o
n
p
erf
o
r
ma
n
c
e
(
%
[image:10.595.163.420.337.518.2])
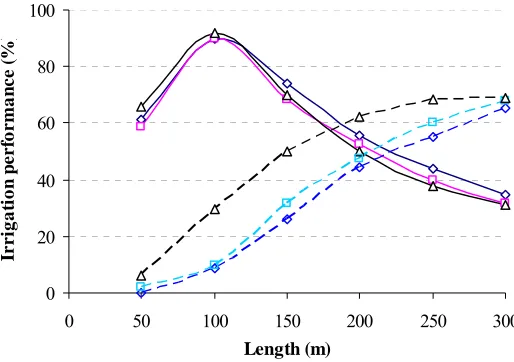
Figure 3: Application efficiency () and deep percolation ratio () as a function of furrow length for fifth event with different inflow rates (∆ = 1.5 ls-1, □ = 2.0 ls-1, ◊ = 3.0 ls-1)
for field S9.
Application efficiencies of less than 40% were achieved with furrow lengths of 275-300 m
regardless of inflow discharge used. However, reducing the field length to approximately 100
m would improve the application efficiency to greater than 80% and reduce deep percolation
ratio to <10% for flow rates ≥2.0 L s-1 (Figure 3). Lower flow rates (i.e. 1.5 L s-1) still have high (≥80%) application efficiencies but the proportion of water lost as deep drainage
4.0 Conclusion
Alternative irrigation system and management practices were evaluated to identify strategies
to improve irrigation performance. A simple decision support aid to improve irrigation
performance in the Bura Irrigation Scheme of the Tana River Basin has been demonstrated.
This work has shown that farmers, with the assistance of the Tana River Development
Authority (TARDA) among others, may obtain performance benefits by optimising irrigation
inflow rates and cut-off times. In some cases, field re-design to optimise furrow lengths may
be required to achieve satisfactory performance.
References
Alvarez, RJ 2003, ‘Estimation of advance and infiltration equations in furrow irrigation for untested discharges.’ Agricultural Water Management 60, pp 227-239
Bakker, DM, Plunket, G, & Sherrard, J 2006, 'Application of efficiencies and furrow infiltration functions of irrigations in sugar cane in the Ord River irrigation area of North Western Australia and the Scope of the improvement', Agricultural Water Management, vol. 86, no. 1-2, pp. 162-72.
Gichuki, FN 1996, Sustainability concerns in African irrigation, in Pereira, LS, Feddes, RA, Gilly, JR & Lesaffre, B (eds) Sustainability of irrigated Agriculture, Kluwer Academic publishers, Dordrecht.
Horst, L 1998, The dilemas of water division: considerations and criteria for irrigation system design. International Water Management Institute (IWMI), Colombo.
Khatri, KL & Smith, R 2005, 'Evaluation of methods for determining infiltration parameters from advance data.' Irrgation and drainage, no. 55, pp. 1-16.
Ledec, G 1987, 'Effects of Kenya's Bura Irrigation Settlement Project on Biological Diversity and other conservation concerns', Conservation Biology, vol. 1, no. 3, pp. 247-58.
Mailhol, JC,Ruelle, P & Povova, Z 2005, ‘ Simulation of furrow irrigation practices: a field scale modelling of water management and crop yield for furrow irrigation’, Irrigation Science 24: pp 37-48
Mwatha, S & Gichuki, FN 2000, 'Evaluation of the Furrow Irrigation System in Bura Scheme', in Gichuki, FN, Mungai, DNGachene, CK & Thomas DB, ‘Land and Water Management in Kenya: towards sustainable land use’, proceedings of the Fourth National Workshop, Wida Highway Motel, Soil and Water Conservation Branch, Ministry of Agriculture and Rural Development & Department of Agricultural Engineering, University of Nairobi.
Raine, SR, McClymont, DJ & Smith, RJ, 1998, 'The effect of variable infiltration on design and management guidelines for surface irrigation', Proceedings of ASSSI National Soil conference, Brisbane, 27-29 April.
Raine, SR, Purcel, J & Schimidt, E 2005, ‘Improving whole farm and infield irrigation efficiencies using irrimate TM tools restoring the balance’, Proc. Nat. Conf. Irr. Assoc. of Aust. 17th- 19th may Townsville pp5
Smith, RJ, Raine, SR & Minkevich, J 2005, 'Irrigation application efficiency and deep drainage under surface irrigated cotton', Agricultural Water Management, vol. 71, pp. pp 117-30.
Walker, WR & Skogerboe, G. V. 1987, Surface irrigation: theory and practice, prentice-Hall, INC. Englewood Cliffs, New Jersey.