Factors Contributing to Making the Learning of Statistics an
Enjoyable Experience
Mehryar Nooriafshar1 Faculty of Business
University of Southern Queensland Toowoomba, Queensland
Australia
1 Dr Mehryar Nooriafshar is a Senior lecturer in Logistics and Operations Management at the Faculty
of Business of the University of Southern Queensland, Australia. Mehryar is actively involved in the design and delivery of web-based multimedia teaching and learning materials. He was the winner of USQ's inaugural Award for Excellence in the Design and Delivery of Teaching Materials.
Address: Faculty of Business, University of Southern Queensland, Toowoomba, Queensland, AUSTRALIA, 4350
E-mail: [email protected]
URL: http://www.usq.edu.au/users/mehryar Phone: +61 7 46311278
The findings of the study reported in this paper are based on an investigation into more effective methods of teaching and learning statistics. This investigation was a part of a formal research project funded by the Faculty of Business, University of Southern Queensland.
The study was conducted by surveying year-12 students of ten High Schools in and around Toowoomba in Queensland. Both public and private schools were included in the study. The sample comprised 133 randomly selected students.
Despite the importance of statistics in tertiary education and professional activities, the majority of the students did not think that they would have any use for or exposure to it in the future. Having someone with a strong mathematics background at home, students’ level of fear of statistics and their mathematical inclination appear to be amongst the main factors which contribute to making statistics an enjoyable subject to learn.
The findings also demonstrated that most High School students have a preference for visual learning with regard to statistics. This finding indicates that learning via multimedia, with interactive animations, appears to be an attractive approach in' new times'.
Keywords:
Statistics, Education, Multimedia, Learning StyleIntroduction
Teaching a mathematical subject such as statistics to students who do not have a very strong background in mathematics is always challenging. This experience is also extremely rewarding when these students begin enjoying the journey, which leads to mastering the concepts.
Casual observations carried out by the author between 1996 - 2000 has indicated that by the first half of a lecture on a quantitative subject is the most crucial part in terms of students' learning, and attitude towards the subject. These observations were carried out by recording the number of questions (by different 1st year tertiary students) relating to difficulties in grasping the concepts.
Hypothesis and the Research Questions
The hypothesis to be tested was that:
Most students who complete high school and enter the tertiary education do not regard statistics as an enjoyable subject.
The following research questions were also part of this investigation:
What are the factors which contribute to making statistics an attractive subject?
What are the characteristics of students who do regard statistics to be an enjoyable subject?
What are the learning style preferences of students who do not appear to find statistics an enjoyable subject?
Answers to the above questions would make it possible to explore and recommend more effective and enjoyable methods of teaching and learning statistics.
Investigation
In order to collect relevant data for the purpose of testing the hypothesis, and finding answers to the research questions, 10 high schools in and around Toowoomba (Queensland, Australia) were surveyed. Both public and private high schools were represented in this survey. This study will be referred to as the Toowoomba High Schools Survey (THSS) throughout the paper.
The survey was conducted by using a specially designed questionnaire for the purpose of collecting the necessary information. After obtaining the Principals' approval for the survey, the teachers responsible for teaching mathematics/statistics were contacted for information. The nominated coordinators were asked to administer the completion of these questionnaires. Each coordinator chose a random sample of 15 students in such a way that they represented different backgrounds and abilities.
The initial phase of the investigation was a pilot study on a small sample. After identifying the necessary adjustments to be made to the survey instrument, all 10 schools were surveyed. The response rate from the High Schools was reasonably high as 8 out of 10 schools participated.
After receiving the completed questionnaires, a number of schools were contacted and interviewed for further information and clarification.
Main Findings
Students' perception of future contact:
39%
44%
17% nothing to do with
it not sure
something to do with it
Figure1 - Students' perception of their future dealings with statistics
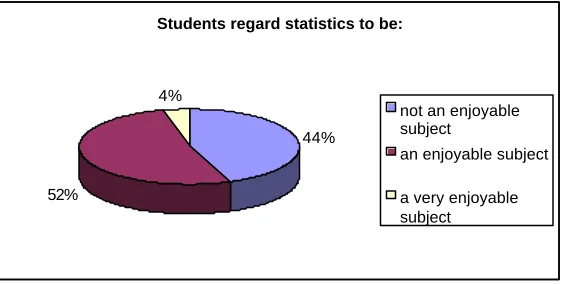
Analysis of the results indicated that a large proportion (44%) of students do not regard statistics to be an enjoyable subject to learn (see Figure 2). This perception may be a result of the general image that the subject of statistics has created.
Kettenring (1997) in a presentation entitled "Shaping Statistics for Success in the 21st Century" to the American Statistical Association suggested that image reconstruction of the field of statistics must be placed right at the top of the list.
The THSS study has also shown that unfortunately there is a problem with regard to statistics’ image. This image or perception problem should be tackled at the time when students start learning statistics more seriously. This process, probably, starts at the secondary education level and continues into the tertiary studies.
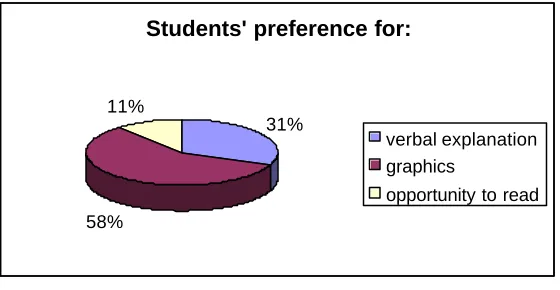
Conveying mathematical concepts to students is probably the key to successful teaching. Campbell (2002) contends that the conceptual understanding of mathematics needs to be addressed in mathematics education. About 58% of the surveyed students indicated their preference for graphics and visual learning (see Figure 3). Given the importance of conveying the concepts and students' preference for visual learning, placing an emphasis on pictorial presentation of concepts seems to be a step in the right direction.
Students regard statistics to be:
44%
52%
4%
not an enjoyable subject
an enjoyable subject
[image:4.596.172.453.550.692.2]a very enjoyable subject
Students' preference for:
31%
58% 11%
verbal explanation graphics
[image:5.596.173.453.74.219.2]opportunity to read
Figure 3 - Learning medium preferences of students
The next sections present characteristics and factors, which have an impact on the learning experience of the students.
Factors Contributing To Enjoying Statistics
• 54% of the students, who find statistics an enjoyable subject, have someone with a strong mathematics background in their families. (Help at Home)
• 86% of the students, who find statistics an enjoyable subject, regard it as an easy subject to understand. (Fear of Statistics)
• 82% of the students, who find statistics an enjoyable subject, describe their mathematical background as strong. (Background)
• 78% of the students, who find statistics an enjoyable subject, also enjoy mathematics. (Mathematical Inclination)
Characteristics of Students who do not Enjoy Statistics
• Only 36% of the students, who do not find statistics an enjoyable subject, have someone with a strong mathematics background in their families. (Help at Home)
• 55% of the students, who do not find statistics an enjoyable subject, regard it as an easy subject to understand. (Fear of Statistics)
• 76% of the students, who do not find statistics an enjoyable subject, describe their mathematical background as strong. (Background)
• Only 43% of the students, who do not find statistics an enjoyable subject, enjoy mathematics. (Mathematical Inclination)
Help at Home 54% Fear of Statistics 14% Perceived Strong Mathematics Background 76% - 82% Differences Similarities Enjoy statistics Do not enjoy statistics Differences
[image:6.596.117.537.70.222.2]Help at Home 36% Fear of Statistics 45% Mathematically Inclined 78% Mathematically Inclined 43%
Figure 4 – Comparing and Contrasting the Characteristics of the Enjoyers and Non-Enjoyers of Statistics
Therefore, Help at Home, Fear of Statistics, and Mathematical Inclination of students are some of the main factors which can play a role in determining whether or not the student finds statistics an enjoyable subject. It is interesting to note that students’ perception of their mathematics background (Perceived Background) does not make a significant contribution to the outcome.
Enjoyers and non-enjoyers seem to be similar in terms of their mathematical background perception. Hence, it is concluded that a strong mathematics background does not, necessarily, guarantee enjoying statistics!
The next section presents the learning style preferences of the students who do not regard statistics as an enjoyable subject.
Learning Style Preferences For Non-Enjoyers
Given the high percentage that does not enjoy statistics, it would be a reasonable strategy to focus on them when designing tertiary teaching materials. For instance, identifying these students' learning style preferences and considering them in the design of learning and teaching packages would be a move in the right direction. Designing educational materials based on the students' preference and learning perception is a valid approach. This is due to the fact that the way students prefer to learn may be totally different from the way the teachers wish to teach. Humbenberger (2002) describes this difference as fairly different experiences of the same “events”.
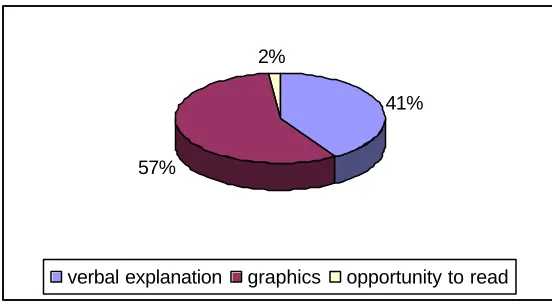
An investigation of the THSS students who do not enjoy statistics has shown that:
• 57% prefer seeing many graphs, images and relevant pictures during the lessons;
• Only 2% prefer having the opportunity to read the topic from a book or handouts and then ask the teacher any questions they may have.
41%
57%
2%
[image:7.596.171.447.113.266.2]verbal explanation graphics opportunity to read
Figure 5 - Learning medium preferences of students who do not enjoy statistics
Further analysis has revealed that 60% of the THSS 'non-enjoyers' prefer to be told exactly what to do. In other words, a vast majority of students in this category may not have a preference for the constructivist methods of learning! They instead prefer instructivism. So, how do they like to learn? The THSS has demonstrated that the use of other media in addition to text, and providing clear direction would certainly benefit those students who do not seem to enjoy statistics. According to a study by Nooriafshar (2001), the use of animated graphs and images enhance students’ performance. Computer-based multimedia is perhaps the most popular and widely referenced way of developing and delivering animated graphs.
Preference For the Multimedia Way?
The findings may lead to the conclusion that school leavers have a preference for visual and aural learning. In other words the use of multimedia would be an appropriate choice in developing tertiary courses for statistics.
However, a multimedia system should not be regarded as a substitute for the traditional teaching/learning methods.
A multimedia system should be able to enhance the existing teaching/learning materials. In other words, it ought to offer students different and additional features such as the opportunity of interacting with animations of the concepts as and when they wish. However, it must be remembered that the content and teaching/learning methods should still be the basis of any multimedia system. A large number of video and audio clips, and clickable icons and menu items do not necessarily add value.
We are able to create the most sophisticated animations and multimedia in our thoughts as we can select different types of thought-based “audio” and “visual” effects as well as “actors”. In other words, we have an unlimited amount of resources to choose from to design our thought-based multimedia system. In the future, the technology will probably enable us to capture and store our thought-based multimedia directly onto storage devices for future reference and other people’s use.
However, at the present time, we do not have the technology for any direct interface and transfers between humans and machines. Therefore, we should focus on feasible approaches. For instance, we may compromise and encourage the use of more non-text materials in the form of concept maps and concept images. The uses of less language-dependent teaching media may even allow us to cross the language barriers and make a significant contribution towards internationalisation of learning.
For example concepts can be illustrated graphically using concept maps. The purpose is to demonstrate how the blueprint of an idea can be developed in a form, which is not explicitly sequential. In other words, in a language which is as close as possible to the generic language and thought mechanism of our brain. In this way, we are encouraging learners to tap into their right-brain, which is a more creative part of the brain. Right-brain is also very good at dealing with non- linear thought processes. Let us consider a Concept Map (Figure 6) of the following analogy for re-enforcing the importance of statistics in an entertaining and possibly thought-promoting manner:
“Imagine that you wish to find out if there is life in the other parts of the universe! How would you approach it scientifically? Think about the vast universe, which we belong to. Can we scientifically prove that there are planets like ours belonging to some of the other solar systems? You may have heard of new planetary systems outside our solar system. Scientists and astronomers have detected the possibility of planets rotating around some stars by observing the wobbling effect on those stars. These gravitational pulls are, probably, being caused by planets revolving around these planets. So far, no scientist or astronomer has actually seen these planets. One day it may become possible to do so!
So, can we scientifically conclude that we are or are not alone in the universe? Maybe not. However, we may demonstrate, statistically, that the chances are very high.
has at least 100 billon
may contain at least 100
billion
having are quite
The
Universe
Galaxies,
which
Suns each.
So, the
chances of
an
Earth-like
planet
High
Figure 6 – A Concept Map illustrating the life in the Universe analogy.
The use of anecdotes and analogies in explaining concepts is also an effective way of teaching. Chanter (http://science.ntu.ac.uk/rsscse/ts/bts/chanter/text.html) presents an interesting collection of anecdotes and analogies used in the teaching of statistics. As is demonstrated below, the author has taken things one-step forward and added the medium of image to presentation of these concepts, anecdotes and analogies. Therefore, by designing, drawing and presenting these special illustrations in conjunction with our text or verbal description, we are moving closer to having a 'multimedia' method of presentation.
Another favourite is the story of two soldiers who congratulate each other on the grounds that, on average, they hit the enemy target. They both miss the target by equal distances; one misses it to the left and the other to the right!
These types of anecdotes are very effective in conveying the message to the learners that one cannot simply quote an average without indicating the variability.
100,000 is a reasonably large figure, it is only 0.05 percent of two million! So, the message about the difference between the response- numbers and response-rate would become quite clear to a learner of statistics.
Such basic, non-computerised multimedia presentations will be more interesting for learners. They will learn and remember the concepts and, in future, one quick look at the images will prompt the whole story and logic. After all, human beings receive, decipher and store information using different senses.
We can utilise the technology and produce a computer-based multimedia of a concept. However, it should be noted that a computer-based multimedia is not going to emulate or excel the teaching methods and explanations of an experienced teacher but it can simulate the process. So, what are the advantages? The students can take the good teacher home with them. They can get him/her to repeat concepts at their desired pace as many times as they want and they will be in control. The Internet takes the whole thing a few steps further and our good, experienced and patient teacher becomes available to almost anyone, anywhere at anytime at a reasonably low distribution costs.
Conclusions and Recommendations
The investigation has revealed that
• There should be a concerted effort at secondary education level to convey the message to the students that statistics does and will play an important role in our professional activities.
• Tertiary courses on statistics should be developed in such a way that they cater for all students and not just those who have a strong mathematical background.
• It should be noted that a reasonably large proportion of students do not regard statistics to be an enjoyable subject. Therefore, there ought to be an attempt not to teach statistics in a “dry” manner. Instead a more lively, entertaining and at the same time educationally sound method of multimedia approach should be adopted.
References
Campbell, S. (2002), ‘Early Mathematics Education: A Case of The Blind Leading The Blind?’, Philosophy of Mathematics Education Journal, 15 (2002). [Online], Available: http://www.ex.ac.uk/~PErnest/pome15/early_maths.htm, [2002, April 15].
Chanter D.O., Some Anecdotes and Analogies for Illustrating Statistical Ideas, [Online], Available: http://science.ntu.ac.uk/rsscse/ts/bts/chanter/text.html
[2000, March 12].
Friedman, H., Halpern, N.and Salb, D. 1999, 'Teaching Statistics Using Humorous Anecdotes', Mathematics Teacher, Vol. 92, Issue 4, p305, 4p.
Humenberger, H. (2000), ‘Applicable Mathematics in Mathematical Education’,
International Journal for Mathematics Teaching and Learning, June Issue.
Kettenring, J. 1997, 'Shaping statistics for success in the 21st century', Journal of the American Statistical Association, Vol. 92, Issue 440, p1229, 6p.