This is a repository copy of The relationship between EQ-5D, HAQ and pain in patients with rheumatoid arthritis: further validation and development of the limited dependent variable, mixture model approach.
White Rose Research Online URL for this paper: http://eprints.whiterose.ac.uk/74450/
Article:
Hernandez, M.A., Wailoo , A., Wolfe, F. et al. (1 more author) (2012) The relationship between EQ-5D, HAQ and pain in patients with rheumatoid arthritis: further validation and development of the limited dependent variable, mixture model approach. HEDS
Discussion Paper, 12/10. (Unpublished)
[email protected] https://eprints.whiterose.ac.uk/ Reuse
Unless indicated otherwise, fulltext items are protected by copyright with all rights reserved. The copyright exception in section 29 of the Copyright, Designs and Patents Act 1988 allows the making of a single copy solely for the purpose of non-commercial research or private study within the limits of fair dealing. The publisher or other rights-holder may allow further reproduction and re-use of this version - refer to the White Rose Research Online record for this item. Where records identify the publisher as the copyright holder, users can verify any specific terms of use on the publisher’s website.
Takedown
If you consider content in White Rose Research Online to be in breach of UK law, please notify us by
HEDS Discussion Paper
No. 12.10
The relationship between EQ-5D, HAQ and pain in patients with rheumatoid arthritis: further validation and development of the limited dependent variable,
mixture model approach
Monica Hernandez Alava1, Allan W ailoo1, Fred W olfe2, Kaleb Michaud2,3.
1
School of Health and Related Research, University of Sheffield, UK
2
National Data Bank for Rheumatic Diseases, Wichita, US
3
University of Nebraska Medical Center, Omaha, US
Disclaimer:
This series is intended to promote discussion and to provide information about work in progress. The views expressed in this series are those of the authors, and should not be quoted without their permission. Comments are welcome, and should be sent to the corresponding author.
White Rose Repository URL for this paper:
The relationship between EQ-5D, HAQ and pain in patients with rheumatoid arthritis: further validation and development of the limited dependent variable, mixture model approach
Monica Hernandez Alava1, Allan Wailoo1, Fred Wolfe2, Kaleb Michaud2,3.
1
School of Health and Related Research, University of Sheffield, UK
2
National Data Bank for Rheumatic Diseases, Wichita, US
3
University of Nebraska Medical Center, Omaha, US
Words: 2844
Financial support: None
Corresponding author: Allan Wailoo,
Reader in Health Economics, Health Economics and Decision Science, School of Health and Related research, University of Sheffield
Sheffield, UK
Tel: 00 44 114 2364775 Fax: 00 44 114 2724095
Abstract
Objective
To provide robust estimates of EQ-5D as a function of the Health Assessment Questionnaire
(HAQ) and pain in patients with rheumatoid arthritis.
Method
Repeated observations of patients diagnosed with RA in a US observational cohort
(n=100,398 observations) who provided data on HAQ, pain on a visual analogue scale and
the EQ-5D questionnaire. We use a bespoke mixture modelling approach to appropriately
reflect the characteristics of the EQ-5D instrument and compare this to results from linear
regression.
Results
The addition of pain alongside HAQ as an explanatory variable substantially improves
explanatory power. The preferred model is a four component mixture. Unlike the linear
regression it exhibits very good fit to the data, does not suffer from problems of bias or
predict values outside the feasible range.
Conclusions
It is appropriate to model the relationship between HAQ and EQ-5D but only if suitable
statistical methods are applied. Linear models underestimate the QALY benefits, and
therefore the cost effectiveness, of therapies. The bespoke mixture model approach outlined
here overcomes this problem. The addition of pain as an explanatory variable greatly
Introduction
Economic evaluation of health care technologies is now a technique in widespread use across
most developed health care systems and a key aid to decision makers. It provides a rational
framework to consider both the cost and benefits of treatments that compete for scarce health
care resources. In rheumatoid arthritis (RA), the advent of high cost biologic drugs has been a
particular driver for the large number of such cost effectiveness analyses. In many
jurisdictions, decision makers wish to have health benefits of treatments expressed in terms of
quality adjusted life years (QALYs) so that comparisons across diverse disease areas can be
made using a common metric. The QALY attaches weight to each year of survival to adjust
for its perceived quality. A year in full health is scored as one and death is zero. These serve
as the points around which all intermediate health states are valued.
In order for the health benefits of a therapy to be estimated in terms of QALYs gained, it is
usual for an appropriate outcome measurement tool to be administered to patients as part of
the clinical trial. Several “off the shelf” instruments are available including the EQ-5D(1),
SF6D(2) (a derivative of the SF36) and the Health Utilities Index(3). Each of these
instruments comprise of questions which ask patients to indicate their health on a range of
dimensions. Pre-existing scores on the QALY scale calculated from the general populations
of several different countries are then available to attach to those health states.
However, in RA many of the pivotal trials for new therapies have failed to include such
preference based instruments. In this situation, analysts have attempted to estimate the
relationship between clinical outcome measures that are included in trials (predominantly the
Health Assessment Questionnaire – HAQ) and preference-based measures via statistical
modelling (4,5,6,7,8). These are almost all simple linear regression models which is
thereby undervalue treatment benefits. This is evident from numerous studies in varying
disease settings (9) and in RA populations both when using the HAQ summary score (10) or
the individual components of HAQ (4,11) as predictors. In these cases the statistical model
underestimates utility values for those patients with little or no functional disability, but
overestimates the utility score for those with poor function.
This linking of clinical and economic outcome measures has been referred to as “mapping”
and has been subject to substantial controversy. The OMERACT network (Outcome
Measures in Rheumatology) Economics Group recognised this and reported that “mapping
should be better explored” (12). Scott et al. (13) go so far as to suggest that economic
evaluations should not be based on HAQ transformed to EQ-5D.
We have previously developed a new statistical approach to modelling EQ-5D(14). Using a
small dataset from an early RA cohort we demonstrated the appropriateness of the method
using HAQ and pain to estimate EQ-5D scores. This paper refines the method and applies it
to a much larger dataset in order to provide definitive results. Whilst this paper concentrates
on the UK EQ-5D tariff, the issues are relevant to EQ-5D using scores from other countries
populations, or for other health utility based instruments. Overall, we aim to estimate EQ-5D
as a function of HAQ and pain.
Materials and Methods
Data were provided by the US National Data Bank for Rheumatic Diseases (NDB). The NDB
is a not-for-profit rheumatic disease research databank in which patients complete detailed
self-report questionnaires at 6 month intervals (15). Eligible patients in this study were those
with RA who had completed a biannual survey for events occurring between July 1st 2002
At each assessment, demographic variables were recorded including sex, age, ethnic origin,
education level, current marital status, medical history and total family income. Patients also
complete the Health Assessment Questionnaire Disability Index (HAQ), including pain on a
visual analogue scale (VAS) scored from 0-100 and EQ-5D, amongst other items. UK EQ-5D
tariff values were used. Summary statistics for the sample are provided in Table 1.
A total of 103,867 observations were included in the total dataset from 16,011 patients. 3,469
observations had missing data and were not included in the statistical models. The size of the
dataset dwarfs that which is typical of most “mapping” studies. Patients spanned the full
range of HAQ, pain and EQ-5D values. Nevertheless, very few observations were observed
in the most extreme HAQ health state. 1244 observations (1.2%) from 528 patients had a
HAQ exceeding 2.5, and just 152 observations (0.15%) from 64 patients had a HAQ of 3.
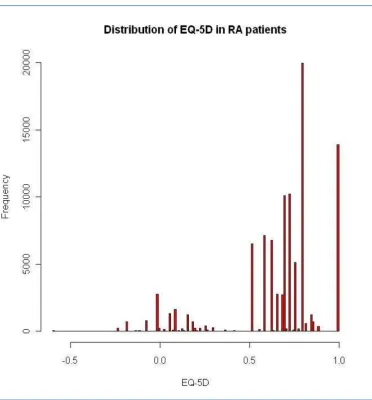
The histogram in Figure 1 displays the key features typical of EQ-5D. First, there is a
substantial mass of observations at 1. There are 13,891 observations (14%) at full health.
Second, there is a gap between these observations and those for any level of impairment, as is
imposed by the method for calculating EQ-5D tariff scores. There are then at least two more
separate components to the distribution with models around zero and 0.75. There is a very
large mass of observations around 0.8. There are 50 observations in the so-called “Pits state”
that is, 33333, the worst state that can be described by the EQ-5D descriptive system. These
are the features of EQ-5D that raise statistical challenges and result in the poor performance
of standard approaches.
Statistical methods
We aim to estimate the conditional relationship between EQ-5D, HAQ and pain on a scale of
0-100. Standard linear regression models are in widespread use for modelling EQ-5D but are
distribution (see Figure 1) and tend to perform poorly. A linear regression model was
included to confirm this. We apply the general framework for modelling EQ-5D from
Hernández et al. (14) which combines bespoke distributions in a mixture model. Full details
are provided elsewhere (14), however, the key details of the two main elements of the
approach are provided here. First, mixture models are formed from a number of different
component distributions which are combined to form a new density. They offer an extremely
flexible and convenient manner in which complex distributions (such as EQ-5D) can be
analysed in a semi-parametric manner (16). Second, in this case each component is made up
of a normal distribution that is limited at full health (1) and has an adjustment to reflect the
gap in feasible values between 1 and 0.883. Explanatory variables may enter the model in
two ways: either as predictors of the relationship with EQ-5D within each component or as
predictors of component membership.
Models were estimated using maximum likelihood in GAUSS v11 (Aptech Systems Inc.).
We considered models comprising different numbers of components. Comparisons were
made in terms of Akaike’s and Bayesian information criteria (AIC/BIC). Other measures of
fit such as the mean absolute error (MAE) and the root mean squared error (RMSE) are also
reported.
Many RA cost effectiveness models simulate individual patients, as opposed to averages
from patient cohorts (7, 17). To reflect this use of the model results, we simulated a set of 100
modelled EQ-5D scores for each of the patients in the dataset. This further illustrated
differences between the observed data and the data generated by the linear regression and the
mixture model approaches.
A four component mixture model was selected as the optimal model. Each of the components
includes HAQ and HAQ2, pain, age and age2 as explanatory variables. The probability of any
patient’s observation being assigned to a component is based on HAQ, pain and pain2. The
optimal linear regression model included HAQ and HAQ2, pain, age and age2. However, this
model suffered very poor fit particularly at the extremes of good health and poor health.
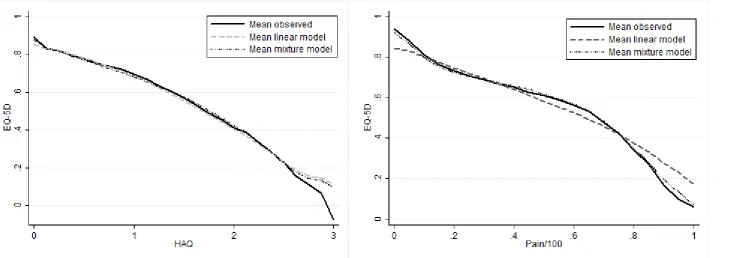
The mixture model vastly outperformed the linear model in terms of summary fit measures.
AIC and BIC were both lower for the mixture model and there was a 9.6% improvement in
MAE and a 3.4% improvement in RMSE. Importantly, the improvement in fit was greatest at
the extremes of very poor and very good health. For those patients with a HAQ between
either 0 and 1 or between 2 and 3, MAE improved by more than 11%. At pain scores of zero
the MAE reduces from 0.13 to 0.08, a 35% improvement. At pain scores exceeding 95, the
MAE reduces from 0.23 to 0.18, a 22% improvement. These features are evident in Figure 2,
which plots the mean EQ-5D versus a) HAQ and b) pain, for the observed data, the linear
regression model and the preferred mixture model. Results for this model are reported in
Table 2.
Each patient observation is assigned a probability of being in each of the four components.
One way of considering the size of each class is as the mean of the component probabilities.
The first class is by far the largest with a mean probability of class membership of 0.73. In
this class, HAQ and pain are negatively related to EQ-5D (p<0.000) (see Table 2). HAQ2 is
not significant. A positive relationship with age and age2 is demonstrated but in the case of
age2 this is not statistically significant (p=0.23). The average characteristics of those patients
most likely to be in this class are very similar to those of the average overall dataset. Notably,
these are less severely affected patients with a mean HAQ of around 1, EQ-5D of 0.67 and
peak around 0.7 that coincides with that observed in Figure 1. This component also
contributes to the mass of data at EQ-5D equal to one, but does not contribute significantly to
the lower end of the distribution.
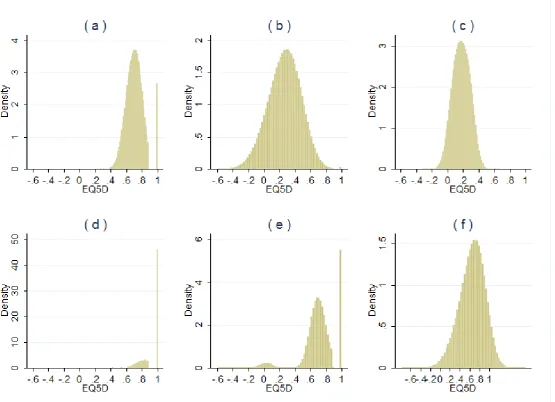
The mean probability of any observation being in the second class is 0.05, making it the
smallest class. This component of the model has a large spread, including both those patients
in the most severe EQ-5D health states and those in full health (Figure 3b). The coefficients
on HAQ and HAQ2 indicate that EQ-5D decreases, by increasing amounts, as HAQ worsens.
The impact of pain on EQ-5D in this group is the most pronounced of all the classes. In those
patients most likely to be assigned to this group, the mean HAQ is almost 2.76 (SD 0.23),
EQ-5D is 0.33 (SD 0.32) but pain is relatively mild at 10.3 (SD 11.2). Patients most likely to
be in this group have an average RA duration in excess of 31 years.
Figure 3c shows that the fourth component is centred around EQ-5D of 0.2 and accounts in
part for the second element of the bi-modal EQ-5D distribution. 7% of patients are most
likely to be assigned to this component. HAQ is negatively associated with EQ-5D and is
much greater in magnitude than the positive coefficient on HAQ2. Pain is also negatively
associated with EQ-5D. This is a class made up of patients with poor functional status. The
mean HAQ is 2.03 (SD 0.44). These patients also have the most severe average pain score for
any of the four groups at 87.8 (SD 7.4).
The 4th class shows no statistically significant relationship between EQ-5D and either age or
pain. HAQ is negatively related to EQ-5D (p<0.05). HAQ2 is not statistically significant.
This group of 14% of the dataset is made up of patients with mild or no symptoms. The mean
HAQ is 0.15 (SD 0.27), pain is 2.3 (SD 2.5) and EQ-5D is 0.93 (SD 0.11). Figure 3d
Figure 3e shows that the key features of the EQ-5D data distribution (Figure 1) are replicated
by the bespoke mixture model: a mass of observations at 1, a gap to the next set of feasible
values, tri-modal and does not predict values outside the feasible range either at the top or the
bottom. The linear regression model has none of these features (see Figure 3f).
Discussion
Cost effectiveness analyses of treatments for patients with RA frequently estimate health
benefits in terms of QALYs by estimating the relationship between preference-based
outcome measures like EQ-5D, and clinical outcomes measures like HAQ. However, the
statistical models used to do this tend to be relatively simplistic and do not account for the
many idiosyncrasies of the EQ-5D instrument and valuation system. For this reason, such
approaches result in systematically biased estimates which undervalue the benefits of
treatments. Unsurprisingly, this has led to criticism from the rheumatology community since
the methods to estimate these relationships are not merely of academic interest but form
critical components of the analyses that reimbursement authorities across the world rely on in
reaching funding decisions (13). These features are not limited to the UK version of the EQ-
5D and many are present in other quality of life instruments used to estimate QALYS such as
the SF-6D (2) and the Health Utilities Index (3). Indeed, comparisons of linear models using
several of these instruments have been performed in RA using data from the NDB (10).
This study uses a very large dataset to refine a flexible statistical approach that was designed
specifically to address such shortcomings.
Results show that the preferred 4 component model does indeed overcome the problems of
poor fit associated with simplistic techniques. Fit is substantially better at the extremes of the
distribution and there is no evidence of the systematic undervaluation of the benefits of
feasible range (-0.561 to 1). Simple approaches generate such nonsensical estimates
particularly when they are used to simulate individual patients and when the parameter
uncertainty in the estimates is reflected in cost effectiveness models. The covariance matrix
that would allow analysts to perform such analyses with this model is available online (Web
appendix).
Many cost effectiveness analyses focus on changes in HAQ due to treatment. This study
demonstrates that better estimates of the benefits of treatments in terms of QALYs will be
gained if HAQ and pain are simultaneously considered. This is neither new (10,14), nor
surprising when one considers that pain is one of the five domains in the EQ-5D instrument
and contributes the greatest weight to the summary score. Yet this finding implies that
economists will need to consider the decision models they use and how meta-analysis
methods can capture treatment benefits appropriately.
The mixture model approach that has been reported here was implemented because it offers a
flexible framework for complex distributions like EQ-5D. However, it also opens the
potential for the consideration of patient subgroups: the relationship between HAQ and pain
to EQ-5D are very different within the four components of the model. In some instances pain
is particularly important, in others it is HAQ that is critical. The patients that are likely to
form these groups are also very different in terms of age, duration and severity of disease.
These implications require further investigation. It is also worth noting that in the previous
implementation of this modelling approach in RA, the preferred model comprised 3
components. The additional of a fourth class here improved fit at the bottom end of the EQ-
5D distribution. Data at this extreme of poor health was lacking in Hernandez et al. (14). This
issue is diminished but not eliminated by using the NDB database. The only place where the
expense of generalizability. The validity of observations from patients at such extreme levels
of functional impairment may also be questionable and for this reason we propose the 4
component model.
More recent clinical trials of newer biologic agents are increasingly incorporating preference
based outcome measures. However, whilst it has often been claimed that direct health utility
assessment is preferable to using indirect “mapping” methods (4,9) this is not necessarily the
case. Here we have a dataset comprising in excess of 100,000 observations across the full
spectrum of functional disability and pain combined with an appropriate method to relate
these measures to EQ-5D. On the other hand, clinical studies, particularly trials, have limited
patient variability and follow up. Economic evaluations therefore extrapolate well beyond
these clinical studies, often over the entire patient lifetime, in order to accurately capture the
impact of treatment on long term costs and health benefits. Our approach offers a means by
which such extrapolations can be undertaken.
Furthermore, even if new trials include measures like EQ-5D the entirety of the evidence
base remains relevant, including studies of older treatments as comparators. Hence, given that
such estimates will be critical to reimbursement decisions for some time to come it is of vital
importance for patients and their physicians that treatment benefits are appropriately valued.
The results reported here can be used in future economic evaluations.
References
1
EuroQol Group. EuroQol-a new facility for the measurement of health-related quality of
life. Health Policy 1990; 16: 199-208
2
Brazier J, Roberts J, Deverill M. The estimation of a preference-based measure of health
3
Torrance G, Feeny D, Furlong W, Barr R, Zhang, Y, Wang Q. Multiattribute utility function
for a comprehensive health status classification system. Health Utilities Index Mark 2. Med
Care 1996; 34; 7: 702-722.
4
Bansback NJ, Marra C, Tsuchiya A, Anis A, Daphne G, Hammond T, et al. Using the health
assessment questionnaire to estimate preference-based single indices in patients with
rheumatoid arthritis. Arthritis Rheum 2007; 57: 963-971.
5
Marra CA, Marion SA, Guh DP, Najafzadeh M, Wolfe F, Esdaile JM, et al. Not all "quality
adjusted life years" are equal. J Clin Epidemiol 2007; 60: 616-624.
6
Lindgren P, Geborek P, Kobelt G. Modeling the cost-effectiveness of treatment of
rheumatoid arthritis with rituximab using registry data from Southern Sweden. Int J Technol
Assess 2009; 25: 181-189.
7
Wailoo AJ, Bansback N, Brennan A, Michaud K, Nixon RM, Wolfe F. Biologic drugs for
rheumatoid arthritis in the Medicare program: A cost effectiveness analysis. Arthritis Rheum
2008; 58: 939-946.
8
Hurst NP, Kind P, Ruta D, Hunter M, Stubbings A. Measuring health related quality of life
in rheumatoid arthritis: validity, responsiveness and reliability of EuroQol. Brit J Rheumatol
1997; 36: 551-559.
9
Brazier J, Yang Y, Tsuchiya A, Rowen, D. A review of studies mapping (or cross walking)
non-preference based measures of health to generic preference-based measures. Eur J Health
Econ 2010; 11: 215–225.
10
Wolfe F, Michaud K, Wallenstein G. Scale characteristics and mapping accuracy of the US
EQ-5D, UK EQ-5D, and SF-6D in patients with rheumatoid arthritis. J Rheumatol 2010; 37:
1615.
11
Harrison M, Lunt M, Verstappen SMM, Watson KD, Bansback NJ, Symmons DPM. 2010
Exploring the validity of estimating EQ-5D and SF-6D utility values from the health
assessment questionnaire in patients with inflammatory arthritis. Health Qual Life Outcomes
2010, 8: 21.
12
Harrison MJ, Bansback N, Marra C, Drummond M, Tugwell PS, Boonen A. Valuing
Health for Clinical and Economic Decisions: Directions Relevant for Rheumatologists. J
Rheumatol 2011; 38: 1770-1775.
13
Scott DL, Khoshaba B, Choy EH, Kingsley GH. Limited correlation between the Health
14
Hernandez Alava M, Wailoo AJ, Ara R. Tails from the Peak District: Adjusted Limited
Dependent Variable Mixture Models of EQ-5D Health State Utility Values. Value Health
2012; 15: 550-561.
15
Wolfe F, Michaud K. The National Data Bank for rheumatic diseases: a multi-registry
rheumatic disease data bank. Rheumatology 2011; 50: 16-24.
16
McLachlan GJ, Peel D. Finite Mixture Models. New York: Wiley; 2000 17
Chen Y-F, Jobanputra P, Barton P, Jowett SM, Byran S, Clark W, et al. A systematic review of the
effectiveness of adalimumab, etanercept and infliximab for the treatment of rheumatoid arthritis in
adults and an economic evaluation of their cost-effectiveness. Health Technol Assess 2006; 10 (42)
Tables
Table 1: Descriptive statistics of RA patients from NDB by observation (n=100,398)
n %
Female 79,639 79.3%
Mean SD
RA duration (yrs) 17.17 11.07 Age (yrs) 62.82 12.24
Pain 35.32 26.76
HAQ 1.00 0.73
EQ-5D 0.66 0.27
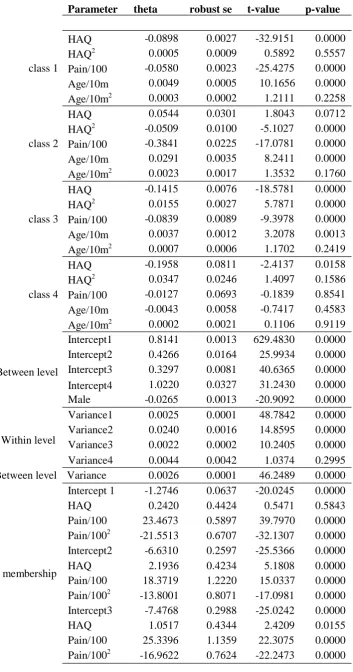
Table 2: Results from 4 class Mixture Model.
Parameter theta robust se t-value p-value
class 1 class 2 class 3 class 4 Between level Within level
HAQ -0.0898 0.0027 -32.9151 0.0000
HAQ2 0.0005 0.0009 0.5892 0.5557
Pain/100 -0.0580 0.0023 -25.4275 0.0000
Age/10m 0.0049 0.0005 10.1656 0.0000
Age/10m2 0.0003 0.0002 1.2111 0.2258
HAQ 0.0544 0.0301 1.8043 0.0712
HAQ2 -0.0509 0.0100 -5.1027 0.0000
Pain/100 -0.3841 0.0225 -17.0781 0.0000
Age/10m 0.0291 0.0035 8.2411 0.0000
Age/10m2 0.0023 0.0017 1.3532 0.1760
HAQ -0.1415 0.0076 -18.5781 0.0000
HAQ2 0.0155 0.0027 5.7871 0.0000
Pain/100 -0.0839 0.0089 -9.3978 0.0000
Age/10m 0.0037 0.0012 3.2078 0.0013
Age/10m2 0.0007 0.0006 1.1702 0.2419
HAQ -0.1958 0.0811 -2.4137 0.0158
HAQ2 0.0347 0.0246 1.4097 0.1586
Pain/100 -0.0127 0.0693 -0.1839 0.8541
Age/10m -0.0043 0.0058 -0.7417 0.4583
Age/10m2 0.0002 0.0021 0.1106 0.9119
Intercept1 0.8141 0.0013 629.4830 0.0000
Intercept2 0.4266 0.0164 25.9934 0.0000
Intercept3 0.3297 0.0081 40.6365 0.0000
Intercept4 1.0220 0.0327 31.2430 0.0000
Male -0.0265 0.0013 -20.9092 0.0000
Variance1 0.0025 0.0001 48.7842 0.0000
Variance2 0.0240 0.0016 14.8595 0.0000
Variance3 0.0022 0.0002 10.2405 0.0000
Variance4 0.0044 0.0042 1.0374 0.2995
Between level Variance 0.0026 0.0001 46.2489 0.0000
Intercept 1 -1.2746 0.0637 -20.0245 0.0000
HAQ 0.2420 0.4424 0.5471 0.5843
Pain/100 23.4673 0.5897 39.7970 0.0000
Pain/1002 -21.5513 0.6707 -32.1307 0.0000
Intercept2 -6.6310 0.2597 -25.5366 0.0000
HAQ 2.1936 0.4234 5.1808 0.0000
Probability of component membership
Pain/100 18.3719 1.2220 15.0337 0.0000
Pain/1002 -13.8001 0.8071 -17.0981 0.0000
Intercept3 -7.4768 0.2988 -25.0242 0.0000