Alterations of the human gut
microbiome in multiple sclerosis
The Harvard community has made this
article openly available. Please share how
this access benefits you. Your story matters
Citation
Jangi, S., R. Gandhi, L. M. Cox, N. Li, F. von Glehn, R. Yan, B. Patel,
et al. 2016. “Alterations of the human gut microbiome in multiple
sclerosis.” Nature Communications 7 (1): 12015. doi:10.1038/
ncomms12015. http://dx.doi.org/10.1038/ncomms12015.
Published Version
doi:10.1038/ncomms12015
Citable link
http://nrs.harvard.edu/urn-3:HUL.InstRepos:27822118
Terms of Use
This article was downloaded from Harvard University’s DASH
repository, and is made available under the terms and conditions
applicable to Other Posted Material, as set forth at
http://
Received 6 Sep 2015|Accepted 20 May 2016|Published 28 Jun 2016
Alterations of the human gut microbiome
in multiple sclerosis
Sushrut Jangi
1,*, Roopali Gandhi
1,*, Laura M. Cox
1, Ning Li
2, Felipe von Glehn
1, Raymond Yan
1, Bonny Patel
1,
Maria Antonietta Mazzola
1, Shirong Liu
1, Bonnie L. Glanz
1, Sandra Cook
1, Stephanie Tankou
1, Fiona Stuart
1,
Kirsy Melo
1, Parham Nejad
1, Kathleen Smith
1, Begu
¨m D. Topc
¸
uolu
3, James Holden
3, Pia Kivisa
¨kk
1, Tanuja Chitnis
1,
Philip L. De Jager
1, Francisco J. Quintana
1, Georg K. Gerber
2, Lynn Bry
2& Howard L. Weiner
1The gut microbiome plays an important role in immune function and has been implicated in several autoimmune disorders. Here we use 16S rRNA sequencing to investigate the gut microbiome in subjects with multiple sclerosis (MS, n¼60) and healthy controls (n¼43). Microbiome alterations in MS include increases inMethanobrevibacterandAkkermansiaand decreases inButyricimonas, and correlate with variations in the expression of genes involved in dendritic cell maturation, interferon signalling and NF-kB signalling pathways in circulating T cells and monocytes. Patients on disease-modifying treatment show increased abundances of Prevotella and Sutterella, and decreased Sarcina, compared with untreated patients. MS patients of a second cohort show elevated breath methane compared with controls, consistent with our observation of increased gutMethanobrevibacterin MS in the first cohort. Further study is required to assess whether the observed alterations in the gut microbiome play a role in, or are a consequence of, MS pathogenesis.
DOI: 10.1038/ncomms12015 OPEN
1Ann Romney Center for Neurologic Diseases, Evergrande Center for Immunologic Diseases, Partners Multiple Sclerosis Center, Brigham and Women’s
Hospital, Department of Neurology, Harvard Medical School, Boston, Massachusetts 02115, USA.2Center for Clinical and Translational Metagenomics,
Department of Pathology, Brigham and Women’s Hospital, Harvard Medical School, Boston, Massachusetts 02115, USA.3Department of Microbiology,
M
icroorganisms in the human gut encompass hundredsto thousands of bacterial, archaeal, viral and
fungal species, making the human intestinal lumen a
rich and dense source of antigenic diversity1. The gut
mucosal immune system samples and processes these microbial antigens, potentially driving the expansion of particular
immune subsets or generating specific immune repertoires2.
Thus, the intestinal microbiome is an important entity within the host that influences immune responses both locally and systemically.
The gut microbiome has been implicated in numerous immunologic disorders, including multiple sclerosis (MS), inflammatory bowel disease, type 1 diabetes and rheumatoid
arthritis3–5. In experimental autoimmune encephalomyelitis
(EAE), a murine model for MS, altering the gut microbiome
modulates central nervous system (CNS) autoimmunity.
In a relapsing–remitting mouse model of spontaneous EAE, transgenic SJL/J mice raised in germ-free conditions were protected against developing the disease, while the introduction
of commensal microbiota into the gut restored susceptibility6.
While gnotobiotic mice are relatively immunocompromised due to lack of microbial stimulation promoting immune maturation, specific association of germ-free mice with defined commensal species has been shown to modulate the development and severity of EAE. Segmented-filamentous bacteria (SFB) drive expansion of Th17 cell populations and generation of interleukin (IL)-17 in
the gut7. Mono-colonization of the gut of C57BL/6 mice with
segmented-filamentous bacteria promotes Th17 accumulation in
the spinal cords of mice and induces the development of EAE8.
Conversely, treatment of C57BL/6 mice with a polysaccharide
from the organism Bacteroides fragilis expands intestinal
Foxp3þ CD4 Tregs and protects against the development of
CNS autoimmunity9,10.
In the case of human autoimmune disease, associations have been reported with different members of the commensal microbiota. In a study of 20 MS patients versus 40 healthy
controls, Faecalibacterium, Prevotella and Anaerostipes were
decreased in MS, but the connection between microbiota,
treatment and changes in immunity was not examined11.
Prevotella copri has been associated in proinflammatory conditions, and has found to be enriched in patients with
new-onset rheumatoid arthritis5, or capable of exacerbating
dextran sodium sulfate colitis in antibiotic-treated C57BL/6 mice. Butyrate-producing organisms have protective associations with
inflammatory conditions, for example, Faecalibacterium
prausnitzii has been shown to be reduced in inflammatory
bowel disease12. In neuromyelitis optica, a CNS autoimmune
disease directed against aquaporin-4, there are increased antibodies against gastrointestinal antigens and cross-reactivity
to a protein belonging toClostridium perfringens, suggesting that
autoimmunity in neuromyelitis optica may be driven by
molecular mimicry against microbial antigens13. Similarly, the
autoimmunity associated with Guillain–Barre syndrome has been
associated with Campylobacter jejuni and the generation of
antibodies to microbial components that cross-react with epitopes
on the surface of the neuron14.
Given the importance of the gut microbiome in immune function and autoimmune disease, for the present work we investigated the human gut microbiome in multiple sclerosis (MS). We identify alterations in the intestinal microbiota and find correlations with MS-associated immune changes and treatment. If further studies demonstrate that these candidate microorganisms play an active role in either contributing to or ameliorating MS, then there is the potential to develop new diagnostics and therapies to combat the disease.
Results
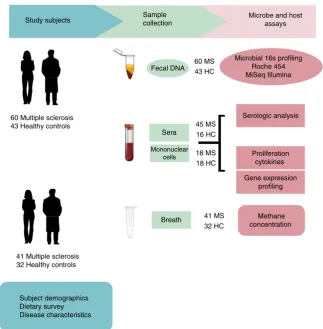
Subject characteristics. Faecal samples were collected from 60 MS patients and 43 healthy controls (Fig. 1); details of the study population are provided in Table 1 and in Methods. The MS and control cohorts had comparable demographic characteristics except that the MS cohort had an increased proportion of males. All MS patients had relapsing–remitting disease but none had an active relapse at the time of study enrollment.
Structure and composition of the gut microbiome in MS. Microbial DNA was extracted from faecal samples and 16S rRNA gene sequencing was performed on the Roche 454 and Illumina MiSeq platforms using primers targeting the V3–5 or the V4 variable regions, respectively. We used two sequencing platforms to avoid platform-specific biases and to provide complementary information: the Roche 454 platform produces longer sequencing reads but fewer reads, whereas the Illumina MiSeq provides shorter reads but greater sequencing depth. The resulting sequences were then processed using the mothur software package for quality filtering, removal of artifacts and clustering to
operational taxonomic units (OTUs)15 (Supplementary Fig. 1).
Roche 454 sequencing yielded 1,426,326 reads of B450
nucleotides each, with 426 OTUs identified after quality filtering. Illumina MiSeq sequencing yielded 11,498,168 paired-end reads of 150 nucleotides each, with 1,191 OTUs identified after filtering.
To assess overall differences in microbial community structure in MS patients and controls, we calculated measures of alpha- and beta-diversity. Alpha-diversity summarizes the microbial diversity within each sample, whereas beta diversity measures differences between samples. Shannon entropy, an alpha-diversity measure-ment of richness and evenness, was measured at multiple sequencing depths using rarefaction curves and was similar between MS patients and healthy controls (Supplementary Fig. 2). To determine whether overall microbial community structure was different between MS patients and controls, we calculated differences in beta-diversity using the weighted and unweighted UniFrac metric. Statistical analyses of the resulting matrices using the analysis of molecular variance technique did not reveal significant differences in overall microbial community structure between the two groups (Supplementary Fig. 3).
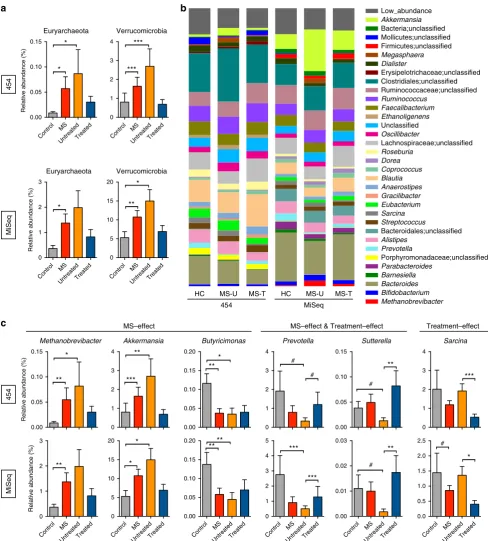
MS-associated microbiota changes at the phylum level. At the phylum level, the faecal microbiota of both groups was dominated by Firmicutes and Bacteroidetes, with smaller contributions of Euryarchaeota, Verrucomicrobia and Proteobacteria. The relative abundances of microbiota at the phylum level were compared between the entire MS cohort (both treated and untreated) and controls (Fig. 2). MS patients had a significantly increased relative abundance of the phyla Euryarchaeota and Verrucomicrobia compared to healthy controls (DESeq, Benjamini–Hochberg
adjusted Pvalueo0.05) by Roche 454 and Illumina sequencing
(Fig. 2a, Table 2).
MS-associated microbiota changes at the genus level. We next investigated whether relative abundances of the microbiota differed between MS (untreated and treated) patients and controls at the genus level (Fig. 2b,c). The relative abundances of
Methanobrevibacter, a genus in the phylum Euryarchaeota, and
Akkermansia, a genus in the phylum Verrucomicrobia, were both
increased in MS patients compared with controls by Roche 454 sequencing and by Illumina sequencing (Fig. 2c, Table 2).
Furthermore, Butyricimonas, which belongs to the phylum
Bacteroidetes had a reduced relative abundance in MS as detected by both sequencing platforms. These changes were similarly detected in untreated MS patients compared with controls
(Fig. 2c, Supplementary Fig. 5). In addition Collinsella and
Slackia, both belonging to the phylum Actinobacteria, and
Prevotella, belonging to the phylum Bacteroidetes was decreased in untreated MS patients as detected by both sequencing platforms (Table 2; Supplementary Fig. 6). In general, the results from the two sequencing platforms were concordant, with 98% of the total microbial abundance composed of shared genera. While we were able to detect some primer bias (for example, higher
detection ofAkkermansia with the MiSeq V4 strategy compared
with the 454 V35 strategy) the MS-related changes generally remained the same (Supplementary Fig. 7).
Effect of therapy on gut microbiota. We then asked whether immunomodulatory therapy was associated with an altered microbiota in treated versus untreated MS patients. We found
that treated patients had increases in the Prevotella and
Sutterellaas detected by Roche 454 and by Illumina sequencing (Fig. 2c, Table 2, Supplementary Fig. 8). Since these genera are either significantly reduced or show a trend of reduced
Table 1 | Demographics of study population.
Healthy Multiple sclerosis
N¼43 N¼60
Age 42.2±9.61 49.7±8.50 Male (%) 6 (14%) 19 (32%) Female (%) 37 (86%) 41 (68%) Body mass index 26.4±6.3 27.2±4.7
Caucasian 43 58
Black 0 2
Hispanic 0 1
Disease Duration NA 12.8±8.3 EDSS Score NA 1.2±1.0
Untreated NA 28
Beta-interferon NA 18 Glatiramer acetate NA 14
NA, not applicable
Microbial 16s profiling Roche 454 MiSeq Illumina
Serologic analysis
Proliferation cytokines
Gene expression profiling
Methane concentration Microbe and host
assays Sample
collection
Sera
Mononuclear cells
60 Multiple sclerosis 43 Healthy controls
41 Multiple sclerosis 32 Healthy controls
Fecal DNA
Breath Study subjects
Subject demographics Dietary survey Disease characteristics
45 MS 16 HC
18 MS 18 HC 60 MS 43 HC
[image:4.595.136.460.46.376.2]41 MS 32 HC
populations in untreated patients compared with controls, it suggests that treatment with immunomodulatory therapy may normalize some of the MS-related changes in the microbiota.
The genus Sarcina was reduced in treated versus untreated
MS patients by both sequencing platforms (Fig. 2b,c).
However, Sarcina levels were similar between untreated
patients and controls, suggesting a treatment-associated effect. No significant differences in the microbiota were noted when MS patients treated with interferon therapy were compared with those treated with glatiramer acetate, although the sample sizes of
Low_abundance Akkermansia Bacteria;unclassified Mollicutes;unclassified Firmicutes;unclassified Megasphaera Dialister Erysipelotrichaceae;unclassified Clostridiales;unclassified Ruminococcaceae;unclassified Ruminococcus Faecalibacterium Ethanoligenens Unclassified Oscillibacter Lachnospiraceae;unclassified Roseburia Dorea Coprococcus Blautia Anaerostipes Gracilibacter Eubacterium Sarcina Streptococcus Bacteroidales;unclassified Alistipes Prevotella Porphyromonadaceae;unclassified Parabacteroides Barnesiella Bacteroides Bifidobacterium Methanobrevibacter
HC MS-U MS-T HC MS-U MS-T
454 MiSeq a b 454 MiSeq 0.00 0.05 0.10 0.15 Relative ab undance (%) Methanobrevibacter * ** 0 1 2 3 Relative ab undance (%) ** 0 1 2 3 4 Akkermansia ** *** 0 5 10 15 20 * * 0.00 0.05 0.10 0.15 0.20 Butyricimonas * ** 0.00 0.05 0.10 0.15 0.20 ** ** 0 1 2 3 4 Sarcina *** MS–effect Treatment–effect 454 MiSeq
MS–effect & Treatment–effect
0.00 0.05 0.10 0.15 Sutterella ** # 0 1 2 3 4 Prevotella # # 0 1 2 3 4 5 *** *** 0.00 0.01 0.02 0.03 ** # 0.0 0.5 1.0 1.5 2.0 2.5 * # 0.00 0.05 0.10 0.15 Relative ab undance (%) Euryarchaeota * * 0 1 2 3 Relative ab undance (%) Euryarchaeota * Control MS UntreatedTreated Control MS UntreatedTreated Control MS Untre ated Treated Control MS UntreatedTreated Control MS
[image:5.595.52.541.48.590.2]UntreatedTreated Control MS Untre ated Treated Control MS Untre ated Treated Control MS Untre ated Treated Control MS Untre ated Treated Control MS Untre ated Treated 0 1 2 3 4 Verrucomicrobia *** *** 0 5 10 15 20 Verrucomicrobia ** * c
these subsets were not sufficiently powered to evaluate this comparison.
To determine whether the differences we observed were related to age, gender or body mass index (BMI), we reanalysed our data using a multi-factorial model. For all MS patients (treated and untreated) compared with controls, the differences in relative
abundances for the generaMethanobrevibacter,Akkermansiaand
Butyricimonas remained significant with at least one of the sequencing platforms. We also found that treatment-related
differences in relative abundances for the genera Prevotella,
SutterellaandSarcinaremained significant.
Phylogenetic placement of 16S rRNA sequences. Validating bacterial identification is important to select the optimal bacteria to monitor in translational studies, however, partial 16S rRNA reads do not always provide sufficient information for identifi-cation to the species level. Thus, phylogenetic placement of 16S rRNA sequences was used to further identify taxa of interest
and to assess the accuracy of identification using pplacer16
(Supplementary Figs 9 and 10). The representative sequence from the most prevalent OTU was used for each taxa of interest. The Methanobrevibacter sequence from our study placed most
closely to referenceM. smithii(placement likelihood (PL)¼0.94),
Akkermansia placed most closely to A. muciniphila(PL¼1.00), andButyricimonashad a greater likelihood of identification asB. synergistica (PL¼0.83) than B. virosa (PL¼0.50). For genera found to be different between untreated MS patients and controls,
Collinsella placed most closely to C. aerofaciens (PL¼0.85),
Slackiaplaced closer toS. isoflavoniconvertens (PL¼1.0 than to
S. piriformis (PL¼0.76), Prevotella placed closer toP. stercorea
(PL¼1.0) than to two different P. copri reference strains
(PL¼0.76 and 0.81). For taxa found to be different between
untreated and treated MS patients, Sutterella could not be
resolved betweenS. stercoricanis or S. wadsworthensis(PL¼1.0
and 1.0, respectively) and sequences mapped to the genusSarcina
placed closest to S. ventriculi (two sequences placing near
S. ventriculiwith likelihoods of 0.66 and 0.85). In total, pplacer was able to identify the most likely genus and species from currently available reference databases.
Gene expression in peripheral blood T cells and monocytes. We used the Nanostring immunology panel to measure the expression of 568 immune-related genes from peripheral blood
derived CD4þ T cells and CD14þ monocytes from a subset of
18 MS patients and 18 controls subjects. Because
Methano-brevibacterwas significantly increased in MS patients compared
with healthy subjects, and since Methanobrevibacter has been
previously implicated as a proinflammatory microbe17, we
selected MS patients and healthy subjects from our cohort that
had the highest and lowest populations of Methanobrevibacter.
The demographics and disease characteristics of MS patients and healthy subjects within this subset were similar to those of the larger group (Supplementary Table 1).
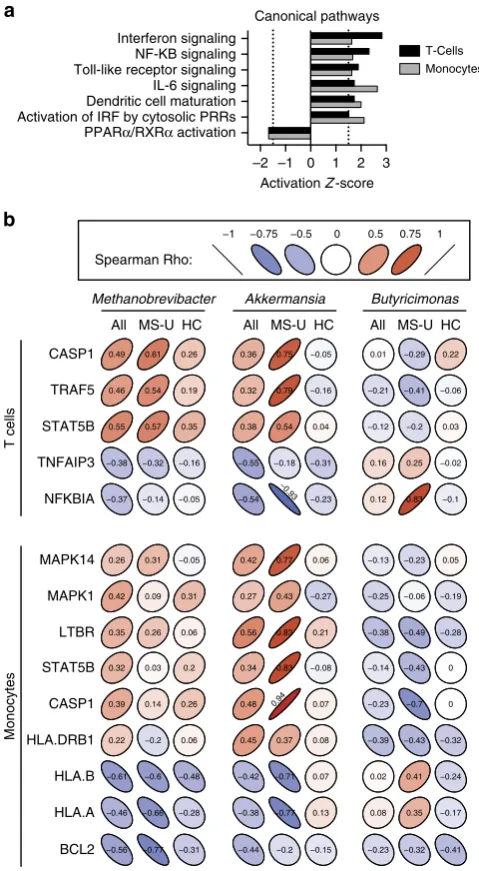
We found unique immune transcriptional profiles in T cells and monocytes from MS patients compared with healthy controls (Supplementary Fig. 11a–c). Ingenuity pathway analysis was used to identify altered canonical pathways. Both T cells and monocytes were predicted to have activated interferon, NF-KB, Toll-like receptor and IL-6 signalling pathways, and decreased
PPARa/RXRa, consistent with pathways previously correlated
with MS18–23(Fig. 3a, Supplementary Fig. 11d).
We then investigated potential associations between the MS-related microbiota and immune changes. We correlated microbial abundance with a set of significantly altered genes biologically curated from the identified canonical pathways (Fig. 3b). For T cells from all subjects, we found that both
Methanobrevibacter and Akkermansia had positive correlations
with CASP1, TRAF5 and STAT5B, while Butyricimonas had
negative correlations with these genes (Fig. 3b), which are implicated in IFN signalling, IL-2 signalling, and PPAR and RXR activation. Because the correlations between microbial popula-tions and immune expression levels could driven by the disease, we examined the correlations within untreated MS patients and within healthy controls separately. Among untreated MS patients,
we again noted that Methanobrevibacter and Akkermansia had
positive correlations andButyricimonashad negative correlations
with this set of genes, while the correlations were near
zero among healthy controls alone. Methanobrevibacter and
[image:6.595.59.553.64.276.2]Akkermansia also had negative correlations with TNFA1P3,
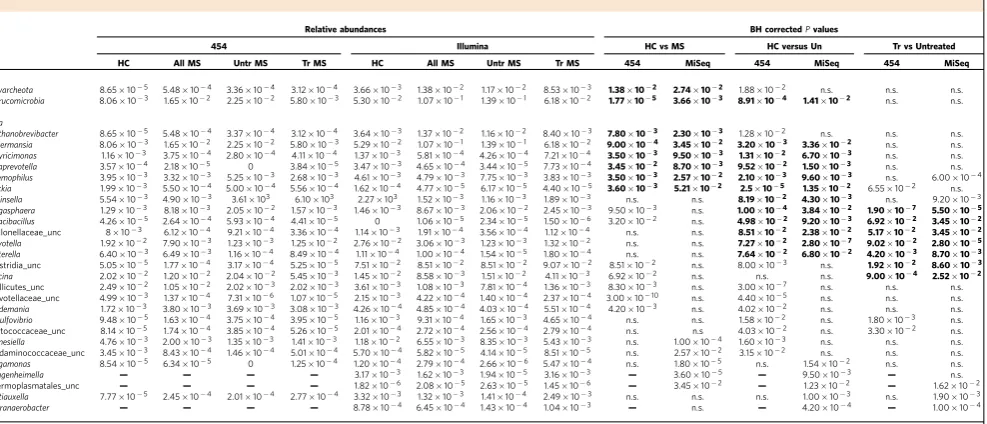
Table 2 | Multiple sclerosis and MS-treatment-associated taxa.
Relative abundances BH correctedPvalues
454 Illumina HC vs MS HC versus Un Tr vs Untreated HC All MS Untr MS Tr MS HC All MS Untr MS Tr MS 454 MiSeq 454 MiSeq 454 MiSeq
Phyla
Euryarcheota 8.65105 5.48104 3.36104 3.12104 3.66103 1.38102 1.17102 8.53103 1.38102 2.74102 1.88102 n.s. n.s. n.s.
Verrucomicrobia 8.06103 1.65102 2.25102 5.80103 5.30102 1.07101 1.39101 6.18102 1.77105 3.66103 8.91104 1.41102 n.s. n.s.
Genera
Methanobrevibacter 8.65105 5.48104 3.37104 3.12104 3.64103 1.37102 1.16102 8.40103 7.80103 2.30103 1.28102 n.s. n.s. n.s.
Akkermansia 8.06103 1.65102 2.25102 5.80103 5.29102 1.07101 1.39101 6.18102 9.00104 3.45102 3.20103 3.36102 n.s. n.s.
Butyricimonas 1.16103 3.75104 2.80104 4.11104 1.37103 5.81104 4.26104 7.21104 3.50103 9.50103 1.31102 6.70103 n.s. n.s.
Paraprevotella 3.57104 2.18105 0 3.84105 3.47103 4.65104 3.44105 7.73104 3.45102 8.70103 9.52102 1.50103 n.s. n.s. Haemophilus 3.95103 3.32103 5.25103 2.68103 4.61103 4.79103 7.75103 3.83103 3.50103 2.57102 2.10103 9.60103 n.s. 6.00104
Slackia 1.99103 5.50104 5.00104 5.56104 1.62104 4.77105 6.17105 4.40105 3.60103 5.21102 2.5105 1.35102 6.55102 n.s.
Collinsella 5.54103 4.90103 3.61103 6.10103 2.27103 1.52103 1.16103 1.89103 n.s. n.s. 8.19102 4.30103 n.s. 9.20103
Megasphaera 1.29103 8.18103 2.05102 1.57103 1.46103 8.67103 2.06102 2.45103 9.50103 n.s. 1.00104 3.84102 1.90107 5.50105
Cloacibacillus 4.26105 2.64104 5.93104 4.41105 0 1.06105 2.34105 1.50106 3.20102 n.s. 4.98102 9.20103 6.92102 3.45102
Veillonellaceae_unc 8103 6.12104 9.21104 3.36104 1.14103 1.91104 3.56104 1.12104 n.s. n.s. 8.51102 2.38102 5.17102 3.45102
Prevotella 1.92102 7.90103 1.23103 1.25102 2.76102 3.06103 1.23103 1.32102 n.s. n.s. 7.27102 2.80107 9.02102 2.80105
Sutterella 6.40103 6.49103 1.16104 8.49104 1.11104 1.00104 1.54105 1.80104 n.s. n.s. 7.64102 6.80102 4.20103 8.70103
Clostridia_unc 5.05105 1.77104 3.17104 5.25105 7.51102 8.51102 8.51102 9.07102 8.51102 n.s. 8.00103 n.s. 1.92102 8.60103
Sarcina 2.02102 1.20102 2.04102 5.45103 1.45102 8.58103 1.51102 4.11103 6.92102 n.s. n.s. n.s. 9.00104 2.52102
Mollicutes_unc 2.49102 1.05102 2.02103 2.02103 3.61103 1.08103 7.81104 1.36103 8.30103 n.s. 3.00107 n.s. n.s. n.s.
Prevotellaceae_unc 4.99103 1.37104 7.31106 1.07105 2.15103 4.22104 1.40104 2.37104 3.001010 n.s. 4.40105 n.s. n.s. n.s.
Holdemania 1.72103 3.80103 3.69103 3.08103 4.26104 4.85104 4.03104 5.51104 4.20103 n.s. 4.02102 n.s. n.s. n.s. Desulfovibrio 9.48105 1.63104 3.75104 3.95105 1.16103 9.31104 1.65103 4.65104 n.s. n.s. 1.58102 n.s. 1.80103 n.s. Peptococcaceae_unc 8.14105 1.74104 3.85104 5.26105 2.01104 2.72104 2.56104 2.79104 n.s. n.s 4.03102 n.s. 3.30102 n.s.
Barnesiella 4.76103 2.00103 1.35103 1.41103 1.18102 6.55103 8.35103 5.43103 n.s. 1.00104 1.60103 n.s. n.s. n.s.
Acidaminococcaceae_unc 3.45103 8.43104 1.46104 5.01104 5.70104 5.82105 4.14105 8.51105 n.s. 2.57102 3.15102 n.s. n.s. n.s.
Megamonas 8.54105 6.34105 0 1.25104 1.20104 2.79104 2.66106 5.47104 n.s. 1.80105 n.s. 1.54102 n.s. n.s. Guggenheimella — — — — 3.17103 1.62103 1.94105 3.16103 — 3.60105 — 9.50103 — n.s. Thermoplasmatales_unc — — — — 1.82106 2.08105 2.63105 1.45106 — 3.45102 — 1.23102 — 1.62102
Buttiauxella 7.77105 2.45104 2.01104 2.77104 3.32103 1.32103 1.41104 2.49103 n.s. n.s. n.s. 1.00103 n.s. 1.90103
Sporanaerobacter — — — — 8.78104 6.45104 1.43104 1.04103 — n.s. — 4.20104 — 1.00104
HC, healthy controls; MS, multiple sclerosis; unc, unclassified; Untr, untreated MS patients; Tr, treated MS patients.
a known potent anti-inflammatory cytokine in autoimmune demyelination, along with NFKBIA previously known to be
underexpressed in MS20,21. Butyricimonas had positive
correlations with these two genes (Fig. 3b).
In monocytes from MS patients, Methanobrevibacter and
Akkermansia had positive correlations with MAPK14, MAPK1,
LTBR, STAT5B, CASP1 and HLA-DRB1, while Butyricimonas
had negative correlations with these genes, which are implicated in dendritic cell maturation, IFN signalling and TREM
signalling pathways. Among untreated MS patients,Akkermansia
and Butyricimonas had positive and negative correlations, respectively, with this set of genes, whereas these effects were
not observed in controls (Fig. 3b). Methanobrevibacter and
Akkermansiaalso had negative correlations with HLA-A, HLA-B and BCL2 in untreated MS patients.
Since we observed correlations between the abundance of specific microbes and gene expression in monocytes and T cells from MS patients, we were interested in determining whether these organisms might drive an altered immunologic response in MS patients and controls. Because lipids derived from
Methanobrevibacter are reported to have adjuvant effects24, we
investigated Methanobrevibacter smithii induced proliferation
and cytokine production in human peripheral blood
mononuclear cells (PBMCs), but found no difference in the
response to Methanobrevibacter in MS patients versus controls
or in subjects with high Methanobrevibacter in the gut
(Supplementary Fig. 12).
Relationship of the gut microbiome to humoral responses. We then examined whether sera from MS patients and healthy
subjects contained antibodies reactive to Methanobrevibacter
or components of Methanobrevibacter. We found
anti-MethanobrevibacterIgM, IgG and IgA antibodies (titre41:64) as measured by enzyme-linked immunosorbent assay (ELISA)
against lysates ofMethanobrevibacterin 33% of MS patients and
28% of controls, with no differences in anti-Methanobrevibacter
antibody titres between the two groups.
Breath methane in MS. Because Methanobrevibacter is the dominant methane-producing microbe that inhabits the human
gastrointestinal tract, the likely presence ofMethanobrevibacterin
the gut can be measured indirectly by a breath test, which assesses
exhaled methane by gas chromatography25. Detection of 41
parts-per-million of methane in the breath reflects the presence of
at least 107–108 methanogens per gram of stool and has been
shown to be driven by Methanobrevibacter smithii26. After we
discovered increasedMethanobrevibacterin the gut by 16S rRNA
sequencing, we performed a methane breath test on a second cohort of 41 MS patients and 32 controls to determine whether we could verify the presence of methane-producing organisms by
a simple and independent in vivo measurement. The second
cohort was chosen to resemble our first cohort (Supplementary Table 2). We detected the presence of methane in 13/41 MS patients versus. 8/32 controls. MS patients had elevated
levels of breath methane versus controls (8.07±2.46 versus
1.65±0.93 ppm, (t-test,P valueo1.81102), consistent with
our observation of increased methanogens in the gut of MS patients (Fig. 4).
Discussion
Host-commensal interactions have increasingly been shown to play a role in the induction of autoimmunity both in experimental animals and human diseases including inflamma-tory bowel disease, rheumatoid arthritis, type 1 diabetes and
experimental autoimmune encephalomyelitis8,27,28. The origin of
the autoimmune process in multiple sclerosis is still poorly understood and whether the inciting factors that trigger inflammation primarily occur in the central nervous system or in the periphery is unknown. Given that disease concordance in MS is 25% in monozygotic twins, both genetic and environmental
factors likely contribute to the development of disease29, and the
gut microbiota might be one such environmental factor.
–2 –1 0 1 2 3
PPARα/RXRα activation Activation of IRF by cytosolic PRRs Dendritic cell maturation IL-6 signaling Toll-like receptor signaling NF-KB signaling Interferon signaling
Activation Z-score Canonical pathways
Monocytes T-Cells
CASP1
TRAF5
STAT5B
TNFAIP3
NFKBIA
MAPK14
MAPK1
LTBR
STAT5B
CASP1
HLA.DRB1
HLA.B
HLA.A
BCL2 −0.56 −0.77 −0.31 −0.44 −0.2 −0.15 −0.23 −0.32 −0.41 −0.46 −0.66 −0.28 −0.38 −0.77 0.13 0.08 0.35 −0.17 −0.61 −0.6 −0.48 −0.42 −0.71 0.07 0.02 0.41 −0.24 0.22 −0.2 0.06 0.45 0.37 0.08 −0.39 −0.43 −0.32 0.39 0.14 0.26 0.48 0.94 0.07 −0.23 −0.7 0 0.32 0.03 0.2 0.34 0.83 −0.08 −0.14 −0.43 0 0.35 0.26 0.06 0.56 0.83 0.21 −0.38 −0.49 −0.28 0.42 0.09 0.31 0.27 0.43 −0.27 −0.25 −0.06 −0.19 0.26 0.31 −0.05 0.42 0.77 0.06 −0.13 −0.23 0.05 −0.37 −0.14 −0.05 −0.54
−0.93
−0.23 0.12 0.83 −0.1 −0.38 −0.32 −0.16 −0.55 −0.18 −0.31 0.16 0.25 −0.02 0.55 0.57 0.35 0.38 0.54 0.04 −0.12 −0.2 0.03 0.46 0.54 0.19 0.32 0.79 −0.16 −0.21 −0.41 −0.06 0.49 0.61 0.26 0.36 0.75 −0.05 0.01 −0.29 0.22 a
b
All MS-U HC
Methanobrevibacter Akkermansia Butyricimonas
T cells
Monocytes
−1 −0.75 −0.5 0 0.5 0.75 1
Spearman Rho:
[image:7.595.306.546.51.487.2]All MS-U HC All MS-U HC
We undertook studies to define the community structure of the faecal microbiome in MS patients using high-throughput 16S rRNA gene sequencing. We found alterations at the phylum level with increases in Euryarchaeota and Verrucomicrobia. At the genus level, more specific shifts were observed, including
increases ofMethanobrevibacterandAkkermansiaand reduction
in Butyricimonas. Given that discrepancies may occur due to variability in primer selection and sequencing reads, we utilized two separate sequencing methodologies and observed that the majority of taxonomic shifts were consistent in both platforms.
Several of the organisms identified in this study as being altered in MS have been demonstrated to drive inflammation or have
been associated with autoimmunity. The archaeon
Methanobre-vibacter has been implicated in inflammation by its capacity to
recruit inflammatory cells and activate human dendritic cells17
and its role in inflammatory diseases, including periodontitis,
asthma and inflammatory bowel disease24,30,31. In addition,
archaeosomes derived from Methanobrevibacter have potent
adjuvant properties secondary to their unique lipid
structure and have been used as adjuvants for vaccines32.
Methanobrevibacter is distributed throughout the small bowel and colon and is tightly adherent to the mucosa via regulated expression of adhesin-like proteins, placing it in close proximity
to the gut-associated lymphoid tissue33. Consequently, when
mucosa-associated (rather than luminal) microbiota were studied
in inflammatory bowel disease, Methanobrevibacter smithii was
increased more than threefold in mucosal samples from patients with both Crohn’s disease and ulcerative colitis compared to
controls30. Methanobrevibacter smithii is also recovered more
frequently in children with obesity, a known risk factor for the
development of MS in adult life34. Furthermore, in a pilot
study of pediatric multiple sclerosis, children colonized with
Methanobrevibacter had a shorter time to relapse35.
We also found that the phylum Verrucomicrobia was increased
in MS patients and was driven by the genusAkkermansia, which
was also reported in a pilot study of 7 MS patients36. In contrast
to our findings in MS, Akkermansia species have been reported
to be decreased in other autoimmune diseases including
psoriatic arthritis37. Akkermansia has been reported to have
both regulatory and inflammatory properties, and is a mucin-degrader that converts mucin to short-chain fatty acids
that may mediate the immunoregulatory effects38. Alternatively,
Akkermansia has been correlated to proinflammatory pathways including upregulation of genes involved in antigen-presentation, B- and T-cell receptor signalling, and activation of complement
and coagulation cascades39. These proinflammatory features may
be related to its ability to degrade mucus, leading to breakdown of the gut barrier and increased exposure of resident immune cells
to microbial antigens40.
We found lower abundances of Butyricimonas, a
butyrate-producing genus, in MS patients. Butyrate is a short-chain fatty acid produced by microbes that induce colonic regulatory
T cells41. Reductions in colonic butyrate can disrupt barrier
function and promote inflammation. Similar to our findings, reductions in butyrate producers have been noted in numerous autoimmune and inflammatory diseases including inflammatory
bowel disease, rheumatoid arthritis and type 1 diabetes5,42,43.
We investigated untreated MS patients, to examine the microbiota independent of MS disease-modifying therapy. We found that the genera that were altered in the entire MS cohort (Methanobrevibacter,AkkermansiaandButyricimonas) were also altered in the untreated population, suggesting that these effects are not specifically correlated with therapy. Furthermore, within the untreated MS subset, we observed reductions in genera
belonging to the family Coriobacteriaceae, including Collinsella
andSlackia. Reductions in Coriobacteriaceae have been reported
in relatives of patients with inflammatory bowel disease44.
Patients on disease-modifying therapy had increased
abundances of the genera Prevotella compared with untreated
patients. AlthoughPrevotellahas been reported to be increased in
rheumatoid arthritis and inflammatory bowel disease5,Prevotella
has been previously correlated to the intake of high-fibre diets, whose primary substrate, fibre, can drive the generation of the
immunoregulatory metabolite butyrate45. We found that
Prevotella was low in untreated MS, and that treatment with disease-modifying therapy was associated with increased relative
abundance of Prevotella. In a smaller cohort of 20 MS patients
compared with 40 controls in Japan, the authors detected a
decrease in Prevotella11 in MS. Given this consistent finding,
future studies investigating the role of Prevotella in MS are
warranted.
We also observed increases in the genus Sutterella and
decreases in Sarcina in MS patients on therapy. Sutterella was
found to be increased in healthy controls compared to patients
with new-onset Crohn’s disease46.Sarcinaspecies are reported to
be increased in the gut microbiota of autistic patients47. Since
immunomodulatory treatment in MS was associated with
increases in relative abundances ofPrevotellaandSutterellaand
decreases in Sarcina, it is conceivable that treatment may act to
normalize a proinflammatory microbiota.
Our finding that some of MS patients have elevated exhaled
methane, a surrogate for levels ofMethanobrevibacterin the gut,
is consistent with our 16S rRNA sequencing results; it would be
interesting to use this rapid, in vivo test to investigate
Methanobrevibacter in larger populations of MS patients. While
we did not measure stool abundance of Methanobrevibacter in
this second cohort, previous studies have shown that the amount of breath methane strongly correlates with the quantity of
M. smithiiin the stool26. In other anatomical sites, the presence of particular microbial species can be identified based on their metabolic activity, as is routinely done for diagnosing
Helicobacter pylori presence with a positive gastric urease test. Future studies employing simultaneous collection of breath, faecal and blood samples in MS patients will address the potential role of breath methane as a biomarker in MS.
The gut microbiota are known to modulate host immune gene expression either by direct contact with cell wall components, or by secretion of factors that can signal through host receptors
0 1 10 100
Breath methane (p.p.m.)
P < 0.018
[image:8.595.329.523.49.211.2]MS HC
or through epigenetic modifications that may alter methylation or
acetylation of transcriptional promoters48. Microbial colonization
by a single organism or by groups of organisms into the gut of germ-free mice can modulate the expression of innate and adaptive immune genes as early as 4 days after microbial
inoculation in varying cellular compartments48. In a study of
inflammatory bowel disease in humans, associations between microbes and host gene expression were found in innate and
adaptive immune pathways49.
We examined relationships between microbial abundance and immune genes implicated in MS pathogenesis. Consistent
with the inflammatory properties of Methanobrevibacter and
Akkermansia32–34,36,45–46, we found positive correlations with these organisms and gene expression in T cells and monocytes involved in key pathways previously implicated in MS pathogenesis, including increased expression of the MAPK family in monocytes (MAPK1 and MAPK14), genes directly involved in both the initiation phase of innate immunity and
activating adaptive immunity50. In T cells, Methanobrevibacter
and Akkermansia positively correlated with TRAF5, a known regulator of T-cell activation and known to be overexpressed in MS, as well as STAT5B, whose expression is indispensible for the
encephalitogenicity of autoreactive CD4þ T cells in EAE50,51.
Methanobrevibacter or Akkermansia negatively correlated with TNFAIP3, previously shown to have reduced expression in
studies of the MS transcriptome21,50. In the case ofAkkermansia,
these relationships were even stronger among untreated MS
patients alone. Butyricimonas had negative correlations with
genes known to be increased in MS among T cells and monocytes,
suggesting that reduction in Butyricimonas is associated
with increased proinflammatory gene expression, however, directionality cannot be determined from this study. These correlations were observed among all subjects and in untreated MS patients, but not in controls alone, suggesting that the relationship between microbial abundance and gene expression was MS-specific, but not solely driven by differences between controls and MS patients. Although we could detect correlation, we cannot determine the causal direction or conclude whether the microbes drive immunological changes, or whether the disease or altered immunity drives changes in the microbiota.
While our investigation of the gut microbiota in MS provides initial insights into understanding the potential role for the microbiome in this disease, our study has certain limitations. First, we cannot assign a direct cause to the associations we describe in the gut microbiome and the MS immunophenotype. The altered microbes may play a role in disease-related immunological changes, or MS-related changes in physiology
may drive microbial alterations.Methanobrevibacter, for example,
is recovered more frequently from individuals with
constipation-variant irritable bowel disease52; while we excluded patients with
irritable bowel disease from our study, it is possible, for example, that subtle changes in gut motility or in the enteric nervous system in MS patients or co-existing constipation may produce conditions favourable for the growth of this microbe. Second, our findings could be influenced by cohort-specific confounders. To minimize the effects of confounders, we used strict
exclusion criteria eliminating the potential influence of
antibiotics, pregnancy or other autoimmune or gastrointestinal conditions. Medications taken before the window of our study—such as prior courses of steroids—may also influence gut microbial populations. Furthermore, MS patients often consume alternative diets that might favour the growth of
particular microbial niches53. Although we did not find any large
differences in dietary intake in our cohort, more sensitive assays may reveal dietary variation that may be responsible for the observed changes in the gut microbiome in our disease
population. Although the methodology used to collect stool samples was relatively uniform, variability in time of sample collection and interval of previous dietary intake may have also contributed to changes in microbes recovered. While age, gender and BMI have been previously shown to drive changes in the microbiome, our multi-factorial model suggests that these factors did not confound the observed microbial differences between the groups. Although we did not find a relationship between changes in the gut microbiome and clinical parameters such as disease duration or disability, most of our patients had low levels of disability (average EDSS 1.2). Future studies with larger cohorts and longitudinal collection of samples will be required to investigate these clinical associations, including subjects with progressive forms of the disease. Third, we analysed the microbiota using primers targeting the 16S rRNA gene. While this is useful for providing taxonomic information, shotgun metagenomic, metatranscriptomic and metabolomic profiling of faecal samples may reveal changes in the abundance of microbial genes, their expression or the presence of microbial metabolites that would complement phylogenic and taxonomic data. Finally, our study is limited by the fact that we collected samples after disease onset. It is possible that critical changes in the gut microbiome in MS may occur in early or preclinical stages of disease. For example, in type 1 diabetes, changes in the gut microbiome were apparent before the onset of illness in high-risk individuals with the concomitant appearance of anti-islet
antibodies54. Investigation of the microbiota in paediatric or
early-onset MS may provide further evidence of associations between the composition of the gut microbiome and MS pathogenesis.
In summary, we have found alterations of the human gut microbiome in MS that correlate with changes in the immune transcriptome and treatment. It is possible that treatment strategies of MS in the future may include therapeutic interventions designed to affect the microbiome such as probiotics, faecal transplantation and delivery of constituents of organisms isolated from the
microbiome10, although more work is required. In addition,
characterization of the gut microbiome in MS may provide biomarkers for assessing disease activity and could theoretically be an avenue to prevent MS in young at-risk populations.
Methods
Study population.Relapsing–remitting MS patients were recruited from the Partners MS Center at Brigham and Women’s Hospital and healthy subjects from the Brigham and Women’s Hospital PhenoGenetic project (http://dejager_lab. bwh.harvard.edu/?page_id=2317). Untreated patients were treatment naive or with no steroid treatment in the previous month, no beta-interferon/glatiramer acetate treatment in the previous 3 months, and no other treatments over the prior 6 months. None of the MS patients had an active relapse at the time of sampling. Patients with a history of using other immunosuppressive medications including teriflunomide, cyclophosphamide, mitoxantrone, rituximab, intravenous immunoglobulin, daclizumab, basiliximab, azathioprine, methotrexate or mycophenolate mofetil were excluded. Treated patients in the cohort were those who had received beta-interferon or glatiramer acetate for at least 6 months. Exclusion criteria for both MS subjects and healthy control subjects were as follows: no antibiotic use in the prior 6 months; no probiotic use; corticosteroids; history of gastroenteritis; or travel outside of the country in the prior month. No history of irritable bowel syndrome, bowel surgery, inflammatory bowel disease or other autoimmune disease. Pregnancy was also an exclusion criteria. A dietary survey was administered to all subjects before collection of samples (Supplementary Table 3). The protocol was approved by the Partners Human Research Committee and informed consent was obtained from all subjects.
Preparation of DNA and sequencing protocols.For Roche 454 pyrosequencing, DNA was extracted using the PowerSoil DNA Isolation kit (MO BIO Laboratories, Carlsbad, CA, USA) with the Human Microbiome Project modifications to the manufacturer’s protocol56. DNA quality and yield were evaluated via agarose gel and Qubit fluorometer (Life Technologies Corporation, Carlsbad, CA, USA). The 16S rRNA gene libraries were generated by the Center for Metagenomics and Microbiome Research at Baylor College of Medicine, using the V3–V5 (357F/926R) primer in accordance with standard Human Microbiome Project protocols55. The 16S rRNA libraries were sequenced by the Human Genome Sequencing Center at Baylor College of Medicine using a Roche 454 GS FLXþinstrument (Roche, Indianapolis, IN) operated with Titanium chemistry.
For Illumina MiSeq 16S rRNA sequencing, methods were adapted from the protocol developed for the NIH-Human Microbiome Project55. Briefly, bacterial genomic DNA was extracted using the MO BIO PowerSoil DNA Isolation Kit (MO BIO Laboratories). The 16S rRNA V4 region was amplified by PCR and sequenced on the MiSeq platform (Illumina) using the 2150 bp paired-end protocol. The primers used for amplification contain adaptors for MiSeq sequencing and dual-index barcodes so that the PCR products may be pooled and sequenced directly57. Sequencing was performed at the Human Genome Sequencing Center at Baylor College of Medicine.
16S rRNA sequencing data preprocessing.Sequencing of the 105 human stool samples on the Roche 454 GS FLXþinstrument generated 1,426,326 total raw reads. Raw reads were processed using the mothur software package (v.1.34.2)14 (ref. 15), which performs demultiplexing and denoising, quality filtering, alignment against the ARB Silva reference database of 16S rRNA gene sequences, and clustering into OTUs (at 97% identity; Supplementary Fig. 1). In total, 4317 OTUs were generated. After filtering OTUs that failed to have a mean number of reads per sampleZ1 in at least one cohort, 426 OTUs were available for further analysis.
Sequencing of the samples on the Illumina MiSeq instrument generated 11,498,168 total forward raw reads. Preprocessing was performed using the mothur software package. The mothur MiSeq SOP was followed, except we used a custom Python script to perform base quality trimming (sliding window size of 50 nt with average quality score435); this modification was employed to improve the quality of sequencing reads used for OTU clustering, since the standard mothur SOP assumes longer sequencing reads than generated by our MiSeq protocol. 10,620 OTUs were generated, with 1,191 OTUs available for further analysis after filtering using the same procedure as described for the Roche 454 data (Supplementary Fig 1).
16S rRNA sequencing data analysis.A measure of alpha diversity, the Shannon entropy58was calculated for the samples, and the nonparametric Wilcoxon rank-sum test59was applied for hypothesis testing. To visualize differences in overall microbial community structure, the unweighted and weighted UniFrac measures were calculated between all pairs of samples, and Principal Coordinates Analysis plots were generated using custom R scripts60. Analysis of molecular variance was used for statistical hypothesis testing of differences in overall microbial community structure between cohorts as assessed with the UniFrac measures61.
To statistically test for differences in the relative abundances of microbial taxa (phyla or genera) the DESeq2 software package was employed62,63. To control for covariates (gender, age and BMI) of interest, we used the multi-factorial model in DESeq2. The DESeq2 multi-factorial model requires categorical values if41 covariate is included, so we discretized age and BMI values. For BMI, we used standard World Health Organization (WHO) categories of normal, overweight, and obese. We reclassified one subject with a BMI of 18.1 as normal, as this is at the borderline of the WHO underweight classification (o18.5) and would have resulted in only one subject in the underweight category. For age, we divided the range of study subjects’ ages (27 to 63 years) into four categories, with each category spanning a 9-year increment. Eight subjects were missing the clinical data. These subjects were excluded from analyses controlling for covariates.
For all statistical testing for 16S rRNA data analysis,Pvalues were adjusted for multiple hypothesis testing using the method of Benjamini and Hochberg64.
To more accurately identify the microorganisms present in samples and their phylogenetic relationships to known species, the pplacer software package was used to perform phylogenetic placement16. Pplacer uses a likelihood-based methodology to place short sequencing reads of 16S rRNA amplicons on a reference tree, and also generates taxonomic classifications of the short sequencing reads using a least common ancestor-based algorithm. The reference tree required for phylogenetic placement was generated using full-length or near full-length (41,200 nt) 16S rRNA sequences of type strains from the Ribosomal Database Project (RDP)65. 9,563 16S rRNA sequences were downloaded from RDP-11-1, representing 8,719 type strains with 375 sequences from Archaea and 9,188 sequences from Bacteria strains. Filtering was performed using custom Python scripts with the following criteria: (1) only one sequence per species (if the species had more than one sequence, then the longest sequence was chosen); (2) non-environmental species (using key words); (3) no sequences with unclear taxonomic lineage information; (4) no redundant sequences. 7,890 16S rRNA sequences were retained for constructing the phylogenetic tree. Multiple sequence alignment was performed using Muscle66. Per the pplacer manual (http://matsen.github.io/pplacer/
generated_rst/pplacer.html), the 16S rRNA reference tree was constructed using FastTree with parameter ‘-nt –gtr’ (ref. 67). FastTree infers phylogenetic trees using an approximate maximum likelihood-based approach, and generates local support values to estimate the reliability of each split in the tree by using the Shimodaira–Hasegawa test on the three alternate topologies (NNIs) around that split, counting the fraction of 1,000 resamples that support a split over the two potential NNIs around that node. Local support values of40.95 are considered to strongly support splits, and those40.70 are considered to moderately support splits. To generate the phylogenetic placement figures in the main manuscript (Supplementary Figs 9 and 10), representative sequences for each species within the genus of interest were chosen (the most abundant unique sequence assigned to that species by pplacer).
Methane breath testing.A separate cohort of subjects was utilized for methane breath testing. The inclusion and exclusion criteria used to recruit patients was identical to that described above. Breath samples were collected from subjects after an overnight fast. All subjects brushed their teeth following the 8-hour fast then produced end-expiratory breath samples into provided collection tubes. Collection tubes were sent to Commonwealth Labs (Salem, MA) where gas chromatography was performed to assess the presence of exhaled methane as described previously26.
Immunologic assays.TheMethanobrevibacter smithiitype strain (ATCC 35061) was cultured at the University of Massachusetts using methods previously described68. Assesment of antibodies againstM. Smithiiwas performed by ELISA. Lysates ofMethanobrevibacterwere prepared from sonicates of
Methanobrevibactercultures. PBMCs were isolated as previously described69. PBMCs were stimulated withMethanobrevibacter smithii, tetanus toxoid or anti-CD3/CD28 in 15 healthy donors and 14 MS patients.Methanobrevibacter smithiiwas cultured in a ratio of 1 bacteria to 1, 10, 100 or 1,000 PBMCs. Thymidine incorporation was measured 4 days following stimulation. Cytokine production was measured by Luminex assay (Miltenyi Biotec). Monocytes and T cells were sorted from PBMCs from 20 MS patients and 20 healthy controls (see below) using a Miltenyi Biotec (Alburn, CA) selection kit. Total RNA was extracted using Norgen RNA purification kits (Norgen Biotek Corp., norgenbiotek.com). NanoString expression of immune genes was detected by NanoString array (nCounter, Gene expression code set, Human Immunology kit) as previously described69.
Statistical analyses of gene expression and microbiome associations.T cells and monocytes were sorted from PBMCs from 20 MS patients and 20 healthy subjects. These participants were chosen from the larger cohort by selecting 10 MS patients with the highestMethanobrevibacterrelative abundance, 10 MS patients with the lowestMethanobrevibacterrelative abundance, 10 healthy subjects with the highestMethanobrevibacterrelative abundance and 10 healthy subjects with the lowestMethanobrevibacterrelative abundance. Of these samples, T cells and monocytes from two MS patients and two healthy subjects either had low viability of low recovery of RNA thus these samples were excluded from further analysis. Count data were normalized using the nSolver Analysis software (Nanostring), significant differences were detected byt-test andPvalues were adjusted for multiple comparisons using the Benjamini–Hochberg correction to assess significance at the 0.05 level.
Pathway annotations were conducted using the Ingenuity Pathway Analysis (Qiagen) and canonical pathways that had an activation score41.5 oro1.5 in either T cells or monocytes were reported. Spearman’s correlations between microbial abundance and immune gene expression was calculated in the R statistical framework70using the cor.test in the stats package and plotted using the ellipse package71.
Data availability.The high-throughput sequence data have been deposited in the National Center for Biotechnology Information (NCBI) BioProject database with project number PRJNA321051. The data from the 16S rRNA sequencing on the MiSeq and 454 platforms have been deposited in the NCBI Sequence Read Archive, and linked to the mentioned BioProject number. T-cell and monocyte gene expression data obtained using the Nanostring immunology panel have been deposited in the NCBI Gene Expression Omnibus (GEO) database under accession number GSE81279. The authors declare that all other data supporting the findings of this study are available within the article and its Supplementary Information files, or from the corresponding author on request.
References
1. Lozupone, C. A., Stombaugh, J. I., Gordon, J. I., Jansson, J. K. & Knight, R. Diversity, stability and resilience of the human gut microbiota.Nature489, 220–230 (2012).
2. McDermott, A. J. & Huffnagle, G. B. The microbiome and regulation of mucosal immunity.Immunology142,24–31 (2014).
4. Alkanani, A. K.et al.Alterations in intestinal microbiota correlate with susceptibility to type 1 diabetes.Diabetes64,3510–3520 (2015). 5. Scher, J. U.et al.Expansion of intestinal Prevotella copri correlates with
enhanced susceptibility to arthritis.Elife2,e01202 (2013).
6. Berer, K.et al.Commensal microbiota and myelin autoantigen cooperate to trigger autoimmune demyelination.Nature479,538–541 (2011).
7. Ivanov, IIet al.Induction of intestinal Th17 cells by segmented filamentous bacteria.Cell139,485–498 (2009).
8. Lee, Y. K., Menezes, J. S., Umesaki, Y. & Mazmanian, S. K. Proinflammatory T-Cell responses to gut microbiota promote experimental autoimmune encephalomyelitis.Proc. Natl. Acad. Sci. USA108(Suppl 1): 4615–4622 (2011). 9. Round, J. L. & Mazmanian, S. K. Inducible Foxp3þregulatory T-cell
development by a commensal bacterium of the intestinal microbiota.Proc.
Natl. Acad. Sci. USA107,12204–12209 (2010).
10. Ochoa-Reparaz, J.et al.A polysaccharide from the human commensal Bacteroides fragilis protects against CNS demyelinating disease.Mucosal
Immunol.3,487–495 (2010).
11. Miyake, S.et al.Dysbiosis in the gut microbiota of patients with multiple sclerosis, with a striking depletion of species belonging to clostridia XIVa and IV clusters.PLoS ONE10,e0137429 (2015).
12. Machiels, K.et al.A decrease of the butyrate-producing speciesRoseburia
hominisandFaecalibacterium prausnitziidefines dysbiosis in patients with
ulcerative colitis.Gut63,1275–1283 (2014).
13. Varrin-Doyer, M.et al.Aquaporin 4-specific T cells in neuromyelitis optica exhibit a Th17 bias and recognize Clostridium ABC transporter.Ann. Neurol.
72,53–64 (2012).
14. Jacobs, B. C.et al. Campylobacter jejuniinfections and anti-GM1 antibodies in Guillain-Barre syndrome.Ann. Neurol.40,181–187 (1996).
15. Schloss, P. D.et al.Introducing mothur: open-source, platform-independent, community-supported software for describing and comparing microbial communities.Appl. Environ. Microbiol.75,7537–7541 (2009). 16. Matsen, F. A., Kodner, R. B. & Armbrust, E. V. pplacer: linear time
maximum-likelihood and Bayesian phylogenetic placement of sequences onto a fixed reference tree.BMC Bioinformatics11,538 (2010).
17. Bang, C., Weidenbach, K., Gutsmann, T., Heine, H. & Schmitz, R. A. The intestinal archaea Methanosphaera stadtmanae andMethanobrevibacter smithii
activate human dendritic cells.PLoS ONE9,e99411 (2014).
18. Cao, Y.et al.Functional inflammatory profiles distinguish myelin-reactive T cells from patients with multiple sclerosis.Sci. Transl. Med.7,287ra274 (2015).
19. Schneider, A.et al.In active relapsing-remitting multiple sclerosis, effector T Cell Res.istance to adaptive T(regs) involves IL-6-mediated signaling.Sci.
Transl. Med.5,170ra115 (2013).
20. Miterski, B.et al.Inhibitors in the NFkappaB cascade comprise prime candidate genes predisposing to multiple sclerosis, especially in selected combinations.Genes Immun.3,211–219 (2002).
21. Gilli, F.et al.Learning from nature: pregnancy changes the expression of inflammation-related genes in patients with multiple sclerosis.PLoS ONE5, e8962 (2010).
22. Miranda-Hernandez, S. & Baxter, A. G. Role of toll-like receptors in multiple sclerosis.Am. J. Clin. Exp. Immunol.2,75–93 (2013).
23. Fernandez-Paredes, L., de Diego, R. P., de Andres, C. & Sanchez-Ramon, S. Close encounters of the first kind: innate sensors and multiple sclerosis.Mol. Neurobiol. doi:10.1007/s12035-015-9665-5 (2016).
24. Blais Lecours, P.et al.Immunogenic properties of archaeal species found in bioaerosols.PLoS ONE6,e23326 (2011).
25. McKay, L. F., Eastwood, M. A. & Brydon, W. G. Methane excretion in man--a study of breath, flatus, and faeces.Gut26,69–74 (1985).
26. Pimentel, M.et al.Methane production during lactulose breath test is associated with gastrointestinal disease presentation.Dig. Dis. Sci.48,86–92 (2003).
27. Haberman, Y.et al.Pediatric Crohn disease patients exhibit specific ileal transcriptome and microbiome signature.J. Clin. Invest.124,3617–3633 (2014).
28. Dunne, J. L.et al.The intestinal microbiome in type 1 diabetes.Clin. Exp.
Immunol.177,30–37 (2014).
29. Oksenberg, J. R., Baranzini, S. E., Sawcer, S. & Hauser, S. L. The genetics of multiple sclerosis: SNPs to pathways to pathogenesis.Nat. Rev. Genet.9, 516–526 (2008).
30. Verma, R., Verma, A. K., Ahuja, V. & Paul, J. Real-time analysis of mucosal flora in patients with inflammatory bowel disease in India.J. Clin. Microbiol.
48,4279–4282 (2010).
31. Yamabe, K.et al.Distribution of Archaea in Japanese patients with periodontitis and humoral immune response to the components.FEMS Microbiol. Lett.287,69–75 (2008).
32. Krishnan, L., Sad, S., Patel, G. B. & Sprott, G. D. The potent adjuvant activity of archaeosomes correlates to the recruitment and activation of macrophages and dendritic cells in vivo.J. Immunol.166,1885–1893 (2001).
33. Samuel, B. S.et al.Genomic and metabolic adaptations ofMethanobrevibacter
smithiito the human gut.Proc. Natl. Acad. Sci. USA104,10643–10648
(2007).
34. Mbakwa, C. A.et al.Gut colonization withMethanobrevibacter smithiiis associated with childhood weight development.Obesity (Silver Spring)23, 2508–2516 (2015).
35. Tremlett, H.et al.Gut microbiota composition and relapse risk in pediatric MS: A pilot study.J. Neurol. Sci.363,153–157 (2016).
36. Cantarel, B. L.et al.Gut microbiota in multiple sclerosis: possible influence of immunomodulators.J. Invest. Med.63,729–734 (2015).
37. Scher, J. U.et al.Decreased bacterial diversity characterizes the altered gut microbiota in patients with psoriatic arthritis, resembling dysbiosis in inflammatory bowel disease.Arthritis Rheumatol.67,128–139 (2015). 38. Derrien, M., Vaughan, E. E., Plugge, C. M. & de Vos, W. M.Akkermansia
muciniphilagen. nov., sp. nov., a human intestinal mucin-degrading bacterium.
Int. J. Syst. Evol. Microbiol.54,1469–1476 (2004).
39. Derrien, M.et al.Modulation of mucosal immune response, tolerance, and proliferation in mice colonized by the mucin-degraderAkkermansia muciniphila.Front. Microbiol.2,166 (2011).
40. Ganesh, B. P., Klopfleisch, R., Loh, G. & Blaut, M. CommensalAkkermansia
muciniphilaexacerbates gut inflammation inSalmonella typhimurium-infected
gnotobiotic mice.PLoS ONE8,e74963 (2013).
41. Furusawa, Y.et al.Commensal microbe-derived butyrate induces the differentiation of colonic regulatory T cells.Nature504,446–450 (2013). 42. Wang, W.et al.Increased proportions of Bifidobacterium and the Lactobacillus
group and loss of butyrate-producing bacteria in inflammatory bowel disease.
J. Clin. Microbiol.52,398–406 (2014).
43. de Goffau, M. C.et al.Aberrant gut microbiota composition at the onset of type 1 diabetes in young children.Diabetologia57,1569–1577 (2014).
44. Joossens, M.et al.Dysbiosis of the faecal microbiota in patients with Crohn’s disease and their unaffected relatives.Gut60,631–637 (2011).
45. Wu, G. D.et al.Linking long-term dietary patterns with gut microbial enterotypes.Science334,105–108 (2011).
46. Gevers, D.et al.The treatment-naive microbiome in new-onset Crohn’s disease.Cell Host Microbe15,382–392 (2014).
47. De Angelis, M.et al.Fecal microbiota and metabolome of children with autism and pervasive developmental disorder not otherwise specified.PLoS ONE8, e76993 (2013).
48. Levy, M., Thaiss, C. A. & Elinav, E. Metagenomic cross-talk: the regulatory interplay between immunogenomics and the microbiome.Genome Med.7,120 (2015).
49. Morgan, X. C.et al.Associations between host gene expression, the mucosal microbiome, and clinical outcome in the pelvic pouch of patients with inflammatory bowel disease.Genome Biol.16,67 (2015).
50. Achiron, A., Gurevich, M., Friedman, N., Kaminski, N. & Mandel, M. Blood transcriptional signatures of multiple sclerosis: unique gene expression of disease activity.Ann. Neurol.55,410–417 (2004).
51. Sheng, W.et al.STAT5 programs a distinct subset of GM-CSF-producing T helper cells that is essential for autoimmune neuroinflammation.Cell Res.24, 1387–1402 (2014).
52. Kim, G.et al. Methanobrevibacter smithiiis the predominant methanogen in patients with constipation-predominant IBS and methane on breath.Dig. Dis. Sci.57,3213–3218 (2012).
53. Riccio, P., Rossano, R. & Liuzzi, G. M. May diet and dietary supplements improve the wellness of multiple sclerosis patients? A molecular approach.
Autoimmune Dis.2010,249842 (2011).
54. Giongo, A.et al.Toward defining the autoimmune microbiome for type 1 diabetes.ISME J.5,82–91 (2011).
55. Human Microbiome Project, C. A framework for human microbiome research.
Nature486,215–221 (2012).
56. Human Microbiome Project, C. Structure, function and diversity of the healthy human microbiome.Nature486,207–214 (2012).
57. Caporaso, J. G.et al.Ultra-high-throughput microbial community analysis on the Illumina HiSeq and MiSeq platforms.ISME J.6,1621–1624 (2012). 58. Shannon, C. E. W. W. A Mathematical Theory of Communication.Bell Syst.
Tech. J.27,379–423 (1948).
59. D. F., Bauer Constructing confidence sets using rank statistics.J. Am. Stat. Assoc.67,687–690 (1972).
60. Lozupone, C. & Knight, R. UniFrac: a new phylogenetic method for comparing microbial communities.Appl. Environ. Microbiol.71,8228–8235 (2005).
61. Excoffier, L., Smouse, P. E. & Quattro, J. M. Analysis of molecular variance inferred from metric distances among DNA haplotypes: application to human mitochondrial DNA restriction data.Genetics131,479–491 (1992). 62. Love, M. I., Huber, W. & Anders, S. Moderated estimation of fold change and
dispersion for RNA-seq data with DESeq2.Genome Biol.15,550 (2014). 63. McMurdie, P.J. & Holmes, S. Waste not, want not: why rarefying microbiome
64. Benjamini, Y. & Hochberg, Y. Controlling the false discovery rate: a practical and powerful approach to multiple testing.J.R. Stat. Soc. B57,289–300 (1995). 65. Cole, J. R.et al.Ribosomal Database Project: data and tools for high throughput
rRNA analysis.Nucleic Acids Res.42,D633–D642 (2014).
66. Edgar, R. C. MUSCLE: a multiple sequence alignment method with reduced time and space complexity.BMC Bioinformatics5,113 (2004).
67. Price, M. N., Dehal, P. S. & Arkin, A. P. FastTree: computing large minimum evolution trees with profiles instead of a distance matrix.Mol. Biol. Evol.26, 1641–1650 (2009).
68. Miller, T. L., Wolin, M. J., Conway de Macario, E. & Macario, A. J. Isolation of
Methanobrevibacter smithiifrom human feces.Appl. Environ. Microbiol.43,
227–232 (1982).
69. Mazzola, M. A.et al.Identification of a novel mechanism of action of fingolimod (FTY720) on human effector T cell function through TCF-1 upregulation.J. Neuroinflamm.12,245 (2015).
70. R Development Core Team. R: a Language and Environment for Statistical Computing. https://www.R-project.org/ (2015).
71. Murdoch, D. & Chow, E. D. ellipse: Functions for Drawing Ellipses and Ellipse-Like Confidence Regions. Cran Repository. Version 0.3-8 (2013).
Acknowledgements
Funding support for this work included grants from the NIH (R01 NS087226 and R21NS087867) from The National Multiple Sclerosis Society, and from The Harvard Digestive Disease Center (Grant P30-DK034854 subcontracted to the Center for Clinical and Translational Metagenomics, Department of Pathology at Brigham and Women’s Hospital).
Author contributions
S.J., R.G., L.C, F.Q., N.L., G.G., L.B. and H.W. designed the study. S.J., R.G., B.G., S.C., F.S., K.M., P.N., P.K., T.C., P.D. and H.W. collected the samples. N.L, L.C, R.Y., B.P., S.J., R.G. and G.G. performed statistical analyses. S.J., R.G., L.C, N.L., G.G., P.D., L.B. and H.W. wrote the manuscript. S.J., R.G., F.G., M.M., S.L., S. T., B.T., J.H. and K.S. performed laboratory experiments.
Additional information
Supplementary Informationaccompanies this paper at http://www.nature.com/ naturecommunications
Competing financial interests:The authors declare no competing financial interests.
Reprints and permissioninformation is available online at http://npg.nature.com/ reprintsandpermissions/
How to cite this article:Jangi, S.et al.Alterations of the human gut microbiome in multiple sclerosis.Nat. Commun.7:12015 doi: 10.1038/ncomms12015 (2016).