European
Investment
Bank
Research Department
Investment in the
Community in 1976
and
CONTENTS
Introduction
Chapter 1 - Investment 3
1.1 The economic background to investment 3
1.2 Investment in the Community countries by sector: capital
expendi-tures, housing construction, and public authorities' investment 9
Chapter 2 - Financing of Investment 19
2.1 The financial background 19
2.2 Financing in the Community countries by sector: personal and corpo-rate savings, new capital issues on domestic markets, bank and other
credits to the non-government sector 28
2.3 Debt issues by Community borrowers on the Swiss and U.S. markets 41
Chapter 3 - International Capital Markets 43
3.1 Public bond issues on the European international market and issues by
non-residents on national markets 43
3.2 International medium-term credits 46
Conclusion 48
CONVERSION
OF NATIONAL CURRENCIES
All statistical data published in this Report are provisional for 1976 and often for 1975 as well. Throughout this Report data for the Community as a whole refer to the present nine member countries: statistics for years prior to 1973 have been adjusted to add data for the three new Member Countries to those of the original "Six".
For 1972 and 1973 the unit of account equivalent of national currencies has been calculated at ex-change parities or central exex-change rates as appropriate. For currencies which began floating in 1972, exchange parities declared to the International Monetary Fund were replaced as from mid-1972, initially by the middle closing rate on 29 December 1972. For the currencies which be-gan floating in early 1973, exchange parities were replaced initially by the middle closing rate on the 19th or 20th March, as appropriate. The conversion rates for currencies with floating
ex-change rates were subsequently altered whenever the monthly average of market rates vari~d by
more than 5 per cent from the conversion rate in use. In each of the years 1972 and 1973 a weighted average of these conversion rates in force during the year was applied to the available statistical material.
Statistics relating to 1974, 1975 and 1976 have been derived from rates of conversion between na-tional currencies and the new European Unit of Account based on a "basket" of Member States' currencies. The composition of this basket is such that, as at 28 June 1974, the sum of the com-ponent currencies would have been equal in value to the International Monetary Fund's Special Drawing Right. For 1974, conversion rates into the new European Unit of Account as at 30 De-cember 1974 have been applied. The conversion rates applicable to statistics for 1975 and 1976 have been based on the average of quarterly rates, the latter being those obtaining on the last working day of the previous quarter. The average conversion rates applicable for 1976 between the European Unit of Account, its component currencies and the U.S. dollarwere as follows:
1 unit of account
=
OM 2.86357 £ 0.611212 Bfrs 43.8998
Ffrs 5.29738 £1r 0.610789 ·urs 43.8998
Lit 906.824 Fl 3.00802 Dkr 6.83439
INTRODUCTION
The economic recovery which began around the middle of 1975 continued in the Member Coun-tries of the European Economic Community during 1976 but not without signs of stress and strain. Rates of growth in the various countries were uneven and at times faltering. Despite the in-crease in output, most economies were running well below capacity and unemployment remained obdurately high. Although some progress was made in the struggle against inflation, by the end of the year the rise in prices was beginning to quicken again in a few countries. The problems of pro-moting economic growth and controlling inflation were made more difficult by bouts of weakness in foreign exchange markets of several Community currencies, notably the Italian lira, the French franc and the pound. Where authorities were obliged to defend the external values of currencies, the steps they took in the form of tightening credit and raising interest rates had unhelpful reper-cussions on economic growth and the investment climate.
The promotion of investment by the business sector as well as by public authorities was however clearly seen to be an essential ingredient of plans for economic recovery in the European Com-munity. In addition to helping towards restoring economic growth, increasing business invest-ment offered a means of tackling the serious unemployinvest-ment problem which existed in most coun-tries. Nevertheless businesses whose propensity to invest had suffered from low profit margins for a number of years remained to a large extent hesitant to increase their fixed investment while surplus productive capacity existed and the outlook remained uncertain. It should not be a matter for surprise therefore that gross fixed investment fell in volume in some Member Countries during 1976 and in some others rose less than output.
The conditions for the financing of investment varied between countries as much as growth rates and rates of inflation but there was no correlation apparent between the cost of finance and in-vestment performance. Denmark for example achieved a higher rate of growth of fixed inin-vestment in 1976 than any other country in the Community and also experienced a faster rise in interest rates to a level above those prevailing elsewhere in the Community. In the Benelux countries on the other hand, interest rates increased by only a little and towards the end of the year were fall-ing, while fixed investment declined in volume. As a general rule interest rates tended to rise in countries which experienced a weakening of the exchange values of their currencies: this meant in particular Italy, the United Kingdom and Ireland but applied also to France, Belgium and, in the middle period of the year, to the Netherlands. In Germany on the other hand short and long-term interest rates declined for most of the year. Share markets were less affected by the movement of exchange rates than by the low level of confidence and uncertainty about the economic outlook. Consequently share prices tended downwards, taking 1976 as a whole, on all markets in the Com-munity, except in Luxembourg.
2
Ofo
14
12
10
8
6
4
2
0
-2
Chart 1 - The Community's economic performance
1972- 1976
1\
I \
I \
I \
I \
I \
I \
I \
II \
I \
I I I
GOP prices 11
(I. h. scale) 1
I I
,-'
,-'
;*'
1972 1973
GOP, volume (l.h. scale)
19'74 1975 1976
See "Principal Sources" 1.a and b.
Persons unemployed (r. h. scale)
Persons unemployed
Mio
6
5
4
3
2
CHAPTER 1
INVESTMENT
1.1 THE ECONOMIC BACKGROUND
TO INVESTMENT
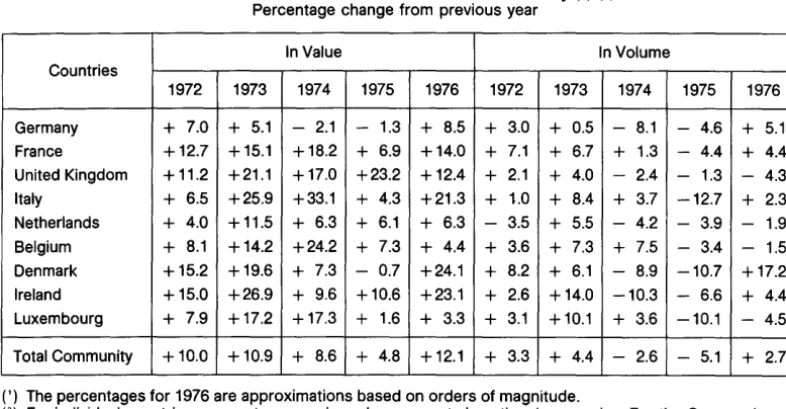
In 1976, gross fixed investment increased in volume in five countries, Denmark, Germany, France, Ireland and Italy. However, owing to the declines in new investment in these countries in the previous two years, it was only in France that the level of investment in real terms in 1976 exceed that of 1973. In Denmark, the rise in the volume of capital expenditures in 1976 was remarkable, although some retrenchment is expected in the current year. The increase in fixed investment in Germany on the other hand was more solidly based. In Ireland and Italy, the modest rise in investment that occurred last year did little to erase the very sharp reduction experienced in 1975. The volume of new invest-ment declined further last year in four coun-tries, the United Kingdom, the Netherlands, Belgium and Luxembourg. However, in all Member Countries there was a rise, sometimes quite appreciable, in investment in value terms last year, with price inflation continuing to be a problem in some countries.
The growth in volume of fixed investment dur-ing 1976 followed a decrease of 5 per cent in the previous year; in value terms fixed invest-ment was 12 per cent higher in 1976. The turn-around in investment was encouraged by an in-crease in volume of the Gross Community Pro-duct of 4.3 per cent last year though the
accu-mulation of stocks, contributing about
one-third of the total growth in economic activ-ity, featured more prominently in the expansion than fixed investment. The rebuilding of stocks tended to lose momentum by mid-year, how-ever, and correspondingly less progress tow-ards economic recovery was made in the sec-ond half of 1976. Successes were achieved here and there in controlling price inflation, leaving more scope for tackling the problem of unemployment which, however, continued to worsen.
It can be seen from Table I that there was a considerable divergence among the Communi-ty countries as to the performance of fixed capital expenditures. Some countries experi-enced a resumption in the growth of invest-ment in real terms last year; certain other countries suffered a decrease in new invest-ment volume in 1976, continuing the decline of the previous year and sometimes of the previ-ous two years.
In Denmark, as in a number of other
Communi-ty countries last year, the economic recovery
of late 1975 and Spring 1976 tended to peter away into stagnation by the middle of the year. However, the benefits of earlier, stimulative policies contributed to a rise in Gross National Product 1n real terms of 4.9 per cent. The strong growth of personal expenditures and the rebuilding of stocks were major factors in encouraging an increase in industrial output and hence the incentive to raise investment. The volume of total fixed capital expenditures rose by 17 per cent in 1976, following a decline of about 10 per cent in 1975. But the shift in emphasis of economic policies in the third quarter clouded the business outlook once more towards the end of the year and the pro-spects for investment in 1977 are not auspi-cious.
The recovery had been initiated by the expan-sion of export demand and the buoyancy of consumer spending induced largely by the
temporary reduction - until 1st March - of
asso-Table 1 - Gross fixed investment in the Community(') (2 ) Percentage change from previous year
In Value In Volume
Countries
1972 1973 1974 1975 1976 1972 1973 1974 1975 1976
Germany + 7.0 + 5.1 - 2.1 - 1.3 + 8.5 + 3.0 + 0.5 - 8.1 - 4.6 + 5.1
France +12.7 + 15.1 +18.2 + 6.9 +14.0 + 7.1 + 6.7 + 1.3
-
4.4 + 4.4United Kingdom + 11.2 +21.1 +17.0 +23.2 +12.4 + 2.1 + 4.0 - 2.4 - 1.3 - 4.3
Italy + 6.5 +25.9 +33.1 + 4.3 +21.3 + 1.0 + 8.4 + 3.7 -12.7 + 2.3
Netherlands + 4.0 + 11.5 + 6.3 + 6.1 + 6.3
-
3.5 + 5.5 - 4.2 - 3.9 - 1.9Belgium + 8.1 +14.2 +24.2 + 7.3 + 4.4 + 3.6 + 7.3 + 7.5 - 3.4 - 1.5
Denmark +15.2 +19.6 + 7.3 - 0.7 +24.1 + 8.2 + 6.1 - 8.9 -10.7 +17.2
Ireland +15.0 +26.9 + 9.6 +10.6 +23.1 + 2.6 +14.0 -10.3 - 6.6 + 4.4
Luxembourg + 7.9 +17.2 +17.3 + 1.6 + 3.3 + 3.1 + 10.1 + 3.6 -10.1 - 4.5
Total Community +10.0 +10.9 + 8.6 + 4.8 + 12.1 + 3.3 + 4.4 - 2.6 - 5.1 + 2.7
(') The percentages for 1976 are approximations based on orders of magnitude.
(2) For individual countries, percentages are based on amounts in national currencies. For the Community
to-tal, amounts in national currencies have been converted into units of account at exchange rates prevailing in the relevant year.
See "Principal Sources" 1.a, 2.b, 3.b, 4.b, 5.b, 6.b, 7.c, 8.b, 9.b, 10.a.
ciated with these policies, in terms of a sub-stantially higher budget deficit, a resurgence of price inflation and an influx of imports, could not long be supported and were causing strains both on domestic financial markets and externally for the exchange rate.
For 1976 as a whole the consumer price index
rose by 13.1 per cent compared with 4.3 per
cent in 1975, although the underlying growth
rate of prices, excluding VAT rate changes,
was less severe at 9.5 per cent. Thus, in
Au-gust the emphasis of fiscal policy was turned towards curbing the growth of nominal in-comes and to an increase in indirect taxes on a number of consumer products. This step was further reinforced by restrictive prices and in-comes measures adopted by Parliament in De-cember. These measures were felt necessary to cut excess consumer demand and hence the accompanying rise in imports of consumer
goods, which in 1976 as a whole were a major
factor behind the increase in the current ac-count deficit of the balance of payments to an
amount four times as large as in 1975. Probably
by the end of 1976 the new restrictions were
beginning to exert a discouraging influence on investment plans.
Economic and investment growth in Germany in 1976, on the other hand, laid the foundations for a further advance. In spite of weakness, particularly in the summer and autumn of last year, the upturn in economic activity which
be-gan in the autumn of 1975 was sustained
dur-ing 1976. The volume of the Gross National
Product increased by 5.7 per cent in 1976
fol-lowing the 2.5 per cent decline in the previous year. Among the main sources of this growth seem to have been higher demand from the private sector, emanating in particular from the revival of new investment in machinery and equipment but partly also from a larger volume of consumption. A further contribution came from stockbuilding 1md from a substantial growth in orders from export markets. Nev-ertheless the effect of official measures to stimulate the economy began to wear off in the summer months. Unemployment remained ex-ceptionally high and seemed likely to be re-duced only to a small extent in the near term ..
An important development in the economic recovery last year was the improvement in bus-iness sentiment. Major factors contributing to this improvement were the rise in industrial
[image:8.481.59.452.78.282.2]general increase in demand. The higher output was achieved with, on average, a smaller labour force and so productivity per man-hour rose sharply by 5.5 per cent. At the same time the increase in wages and salary costs of 5.9 per cent in 1976 was considerably less than in 1975 and led to a significant improvement in com-pany profits.
These factors were important in enabling en-terprises to compete more effectively and through such competition they contributed towards a reduction in the rate of price infla-tion. In this context the appreciation of the Deutschemark against all other currencies off-set a substantial part of the rise in the cost of imports. The annual rate of increase in the cost of living index which had declined to 3.9 per cent by December 1976, was not surprisingly the lowest rate of inflation in the Community.
The improvement in the profits of enterprises was reflected in an expansion of certain
cate-gories of business investment - more in the
installation of machinery and equipment, for example, than in new construction. The smaller difference between the real and nominal in-creases in investment (including residential construction and public authorities' capital spending) compared with 1975 reflects the lower rate of price inflation affecting capital goods; the value of capital investment in 1976 was 8.5 per cent higher than in the previous year, whereas the volume increase was 5.1 per cent.
Rates of real growth of output and investment in France were similar to those in Germany but were not achieved without strain on the prices and balance of payments fronts. The revival of economic activity which followed the introduc-tion of stimulatory mf3asures in September 1975 continued into 1976. Even though the pace of the recovery slowed from the spring of 1976 onwards, for the year as a whole the Gross Domestic Product was 5 per cent higher than in 1975. However a lack of balance in this growth, stemming as it did largely from a strong expansion of private consumption, led to a speeding up of the rise in prices and to a deterioration in the balance of payments. The
effect of the increase in domestic consumption was augmented by a recovery in the volume of exports which in 1976 as a whole grew by a lit-tle more than 9 per cent. The increase in indus-trial output, while substantial, covered only a part of the rise in total demand and conse-quently the volume of imports rose by over 19 per cent, despite the depreciation of the franc against a number of major currencies. The de-terioration of the external trade deficit in 1976 was accentuated by the effect of the serious drought during the middle of the year both on exports and imports of, in particular, food-stuffs. Taking into account these various pres-sures on the economy, an anti-inflationary plan bearing the name of the prime minister, M. Barre, who was its author, was introduced dur-ing the autumn.
Gross fixed investment rose in volume almost in step with the domestic product but this was largely because of the investment projects of public enterprises and of the public authorities which were implemented as part of the pro-gramme to restimulate the economy. Enter-prises in the private sector also increased their investment, particularly in the first half of the year, but the existence of surplus capacity and difficulties in obtaining the finance they needed tended to cause them to postpone their invest-ment plans. Housing investinvest-ment, which fell sharply in volume during 1975, declined again during 1976.
movement, an increase in fixed capital invest-ment and a rise of 17 per cent in the volume of industrial exports. The volume of gross fixed investment rose by 4.4 per cent in 1976 under the stimulus of higher business and public au-thorities' capital expenditures, following a de-cline of 6.6 per cent in 1975.
A major concern of the business sector and the public authorities was the threat of a gressive loss of competitiveness of Irish pro-ducts through increased labour costs and prices. Indicative of the problem, the consumer price index rose by 20.6 per cent over the twelve months to November 1976. The need to restrain incomes growth received general sup-port in negotiations leading towards a renewal of the National Pay Agreement. However, the Associated Banks' employees, not in fact covered by the Pay Agreement, sought through industrial action to improve their posi-tion; this action closed the major part of the banking system between late June and early September.
With agricultural exports depressed last year following the sharp expansion in 1975, the value of total merchandise exports grew at a
slower pace than that of imports - in part due
to the increase in capital goods imports - and led to the worsening of the current account
deficit of the balance of payments from £ lr. 18
million in 1975 to £ lr. 150 million last year. The
depreciation of the Irish pound of 8.7 per cent on a trade-weighted basis in 1976 had a two-fold effect; in external trade it helped to offset to some extent the effects of the domestic rate of inflation and so to maintain the competitive-ness of Irish exports but internally it raised the prices on the domestic market of imported goods.
The investment climate in Italy was also
ad-versely affected by a high and rising rate of flation and, as in Ireland, most of the volume in-crease in fixed investment was attributable to the capital expenditure programmes of the public authorities. The rise in the volume of Gross Domestic Product in Italy last year of 5.6 per cent was one of the most rapid in the Com-munity, being in part a rebound from the
steep-ness of the recession in the previous year. In-dustrial output was 12 per cent higher in 1976 but even this gain was insufficient to compen-sate for the decrease in 1975. The rebuilding of finished product stocks in the first half of 1976 contributed significantly to the economic re-covery but tended to fade later in the year. The strength of consumer demand on the other hand remained considerable throughout 1976 and led to a rise of some 38 per cent in the val-ue of merchandise imports. Largely as a result, the current account deficit of the balance of payments deteriorated from under Lit 400 milli-ard in 1975 to almost Lit 2 400 millimilli-ard last year.
This deterioration was largely responsible for the decline in the year to December 1976 of the exchange rate for the Lira averaging 20 per cent against the currencies of Italy's main trad-ing partners, weighted accordtrad-ing to their im-portance. As a result of the severe deprecia-tion of the Lira and the rundown of foreign cur-rency reserves, the previously stimulative budgetary policy, largely involving investment incentives, had to be reversed. Furthermore, one of the commitments entered into at the
time of the granting by the EEC of a $ 1 milliard
loan to Italy in March of last year, was that the public sector deficit would be limited to Lit 13 800 milliard in 1976. The tightening of economic policies, and more particularly the austerity programme introduced in October which involved increased indirect taxes and higher public service charges, was linked to the need both to contain the growth of the public sector deficit, and hence the proportion financed by an expansion of the monetary base, and to reduce the growth of imports.
groups, wage compensation per employee in 1976 as a whole averaged some 21 per cent more than a year earlier. Under such condi-tions of accelerating inflation, uncertainties as to future economic policies and recurring pres-sure on the exchange rate, business invest-ment was relatively subdued last year. While to-tal investment in the economy rose by some 2.3 per cent in volume terms, the major thrust behind capital spending derived from the pub-lic sector's investment programmes.
As in Italy exchange rate problems in the
Unit-ed Kingdom imposUnit-ed constraints on policy
which rendered the control over the rate of in-flation and the stimulation of economic activity, including investment, more difficult. The rate of inflation in the U.K., as indicated by the in-crease in the retail price index, declined during 1976 to just over 15 per cent compared with about 25 per cent a year earlier. Even so the rate remained higher than those of most other trading partners. Moreover, the initial slowing of inflation in the first seven months of 1976, in response to the Government's wage restraint
policy, was checked and even reversed in ~he
latter part of the year as import prices ex-pressed in terms of sterling rose as a result of the depreciation of the currency.
The ensuing problems were reflected in a slackening of economic growth after a relative-ly buoyant first quarter and for 1976 as a whole the Gross Domestic Product was only 1.0 per cent higher in volume than in 1975. Personal disposable incomes declined in real terms for the second successive year and the business sector's confidence remained low. The num-bers of unemployed increased further during the course of the year and averaged 5.4 per cent of the labour force compared with 3.9 per cent in 1975. The visible trade deficit worsened sharply in the second quarter and, together with the comparatively high inflation rate, had an adverse effect upon the confidence of non-resident holders of sterling and contribut-ed to a sharp depreciation in the exchange value of the pound against the currencies of the United Kingdom's main trading partners. These developments limited the scope for
sti-mulative action and made even more impera-tive the continuation of existing anti-inflationary policies.
The voluntary restraint on wage and salary in-creases, which was introduced for one year in August 1975 and came to be known as "stage one" of the current incomes policy, succeeded in restraining the increase in hourly earnings in manufacturing to some 15 per cent during its period of operation. "Stage two" of the in-comes policy sought to consolidate this im-provement and reduce earnings growth even further, to 8 per cent in the August 1976-July 1977 period. Reductions in direct taxes,
amounting to some £ 900 million, which were
announced with the April 1976 Budget as con-ditional upon the general acceptance of the new proposals for the restraint of increases in incomes, helped the Government in the pursuit of its policy. Both public and private spending on fixed investment were reduced in 1976 -the former because of -the need to limit -the growth in the public sector's financing require-ment, and the latter because of the slow growth and consequent doubts about the need for further capacity and about being able to earn an adequate return. As a result, the vol-ume of total fixed capital investment fell by 4.3 per cent during 1976, the third consecutive year of decline.
consump-8
tion and a movement to rebuild stocks. Ex-ports grew rapidly and also contributed to-wards the general recovery. Fixed investment, however, remained depressed but fell less in volume than in 1975.
As in other countries in the European Commu-nity, the Government was confronted with the need to reconcile its attempts to provide a fresh stimulus for the economy with its efforts to reduce inflation. The increase in the Govern-ment's current expenditures occasioned by the introduction of a series of stimulative mea-sures during the year, coupled with the larger transfer payments resulting partly from the high level of unemployment, widened the bud-get deficit. In addition to developing new tech-niques for borrowing, the Government raised the rate for VAT on 1 October by 2 per cent though this, however, increased prices further. The increase in VAT had originally been planned for 1 July but was postponed so as not to impair too seriously the Government's main strategy in tackling inflation through controls over prices and incomes, rather than through reducing liquidity with a consequent risk of ex-erting an undesired upward pressure on inter-est rates. The limitation of price increases in-troduced in earlier years was continued during 1976, but with a permitted leeway. Wages and salaries were frozen at their real levels in No-vember 1975 for a period of six months (com-pensation for price increases being allowed), but as from July 1976 controls over pay in-creases began to be relaxed so as to allow an increase in the real income and purchasing power of those earning lower incomes. The continuation of wage restraint resulted in the increase in average wages per employee being held to 8 per cent in the twelve months to De-cember 1976 compared with a rise of 12 per cent in the previous year.
The influences on prices were rather more complex. The smaller rise in wage costs was a significant element in 1976 and to a certain ex-tent the appreciation of the external value of the guilder (despite the depreciation against the Deutschemark within the European curren-cy snake in October 1976) against most
cur-rencies helped to lower the cost in guilders of imported goods. Both these developments contributed to the effectiveness of the policy of price restraint and as a result prices rose less in the Netherlands in 1976 than in all other Member Countries except Germany. The con-sumer price index, for example, levelled out af-ter the increase in VAT in October and its rise in the twelve months to December 1976 was thereby curtailed to 8.3 per cent.
After experiencing a squeeze on profits for several years, the profitability of enterprises improved a little in 1976 but business senti-ment remained dull. Domestically the scope for further increases in profits was severely limit-ed. Externally exports were more competitive than in the previous year, thanks to the relative improvement in costs of production, but here also the scope for increasing prices and profit margins was limited by the rise in the exchange value of the guilder against the currencies of several of the Netherlands' trading partners. Because there appeared to be little prospect of an improvement in profitability either in the domestic market or in exporting and because of the persistance of a considerable amount of unused productive capacity, the incentive in 1976 for enterprises to invest was low. Largely as a result of this, gross fixed capital formation rose modestly in value by 6.3 per cent which, translated into terms of volume, represented a fall of 1.9 per cent, only slightly less of a de-cline than in 1975.
In Belgium last year the business outlook im-proved a little from t.ime to time as industrial production rose to almost the level attained two years earlier, and profitability tended to recover. Fixed investment declined but by a lit-tle less than in the Netherlands.
in the second half of the year the re-stocking movement largely ceased. The growth in de-mand both from manufacturers (for raw materi-als) and from consumers led to a faster growth of imports in 1976 than exports and hence to a deterioration in the visible trade balance which in turn had a weakening effect on the currency and, through this, on the capital market.
Government incomes policy, and more specif-ically the April stabilization measures (including the temporary suspension of indexation for in-comes above a certain level, the freezing of rents and professional incomes, and the reduc-tion of permitted dividend disbursements) con-tributed to the slowing of the growth in money incomes and prices. Average hourly earnings of industrial and transport workers increased by only 9.5 per cent during 1976 as compared with a rise of 17.4 per cent in the previous year. Owing largely to the rise in manufacturing out-put, productivity per man-hour rose by an esti-mated 9 per cent in the first half of 1976 and the increase in salary costs per unit of output fell sharply compared with the previous year. The impact of this improvement is evidenced both by the progressive curbing of the rate of price inflation (to an annual rate of 7.6 per cent at the end of 1976 as against 11 per cent a year earlier) and a simultaneous improvement in company profits. However, this was not enough to overcome the pessimism regarding the economic outlook which deepened in the second half of the year and fixed capital forma-tion by businesses fell further. Mainly because of this fall, total fixed investment declined in 1976 by about 1 per cent after having been re-duced by 3 per cent the previous year.
The decline in the volume of investment in
Lux-embourg of 4.5 per cent in 1976, after a
steep-er decline in the previous year was the most serious in the Community. The signs of the be-ginnings of a recovery in markets for steel pro-ducts in early 1976 proved short-lived and con-sequently the growth of the Luxembourg econ-omy which depends heavily on steel tended to slacken in the second half of the year. The de-cline in output in the steel industry of 1.3 per cent last year was offset to some extent by the
expansion of production in the chemicals and rubber industries and by a continuation of the rapid growth of the services sector. The vol-ume of Gross Domestic Product increased by about 3 per cent in 1976 after having declined by 8 per cent in the previous year. This re-covery stemmed from the growth in exports of goods and services (particularly of invisible re-ceipts associated with the financial sector) while domestic demand in real terms remained weak. Consumer spending rose only slightly, even after the stimulus to purchases of con-sumer durables occasioned by the removal in April of restrictions on hire-purchase credit, and investment expenditures continued to lag behind the economy as a whole.
Because the Luxembourg economy is so open and susceptible to international influences, with most domestic industries producing prin-cipally for export, Government policies have been directed more towards limiting the ad-verse effects of such influences, such as compensation for partial employment, rather than introducing stimulative counter-cyclical policies which would tend to draw in imports. However, the authorities resorted to special public works programmes and to fiscal incen-tives for the encouragement of new investment by the steel industry.
The rise in prices tended to be moderated. The consumer price index, taken as a whole, rose by 8.5 per cent in 1976 largely because a rela-tively small increase in the cost of imported ar-ticles coupled with a freeze on the retail mar-gins of selected food items offset an accelera-tion in the rate of increase in the prices of oth-er domestically produced goods.
1.2 INVESTMENT IN THE COMMUNITY COUNTRIES BY SECTOR: CAPITAL
EXPENDITURES, HOUSING CONSTRUCTION AND PUBLIC AUTHORITIES' INVESTMENT
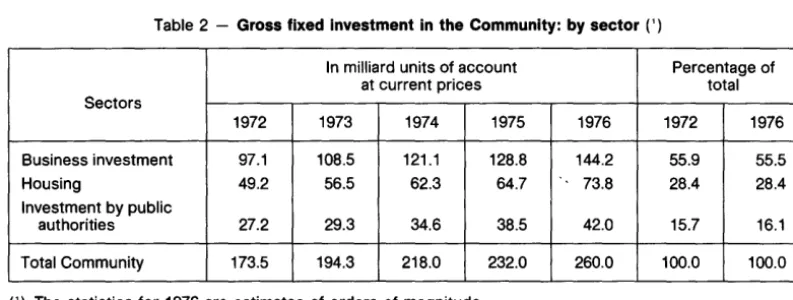
or so recorded at the beginning of the decade. The sectoral breakdown of gross fixed invest-ment outlined in Table 2 indicates that the ac-celeration of investment in 1976 was limited to the business and housing sectors.
Business capital expenditures rose by 12.0 per cent in 1976 compared with a gain of 6.4 per cent in the previous year. Taking the Communi-ty as a whole, it seems probable that fixed in-vestment by businesses rose moderately in volume in 1976. The reasons for this seem to have been the gradual improvement in the bu-siness climate and outlook as the various economies began to recover from recession. A slowing of the rise in costs and higher capacity utilization resulted in many instances in an en-couraging increase in profitability. To this was added an improvement in the prospects for sales.
Housing construction expanded even faster than business investment, rising by 14.1 per cent in value in 1976. In general the housing market in many countries entered into a ten-tative recovery phase after the pressures of the last few recessionary years in which the extent of unsold housing units tended to inhibit the resumption of growth in new house construc-tion. In a number of countries a movement away from multi-unit housing towards single family dwellings, probably represented the ef-fect of rent controls which discouraged the construction of housing for rental.
While public authority capital expenditures grew faster than other forms of investment in 1975, this situation was changed in 1976 when public authority investment in rising by only 9.1 per cent was less buoyant than that of other sectors. In a number of countries the coun-ter-cyclical stimulative programmes of Govern-ments continued to exert an upward influence on capital expenditures but began to taper off during the year.
Chart II indicates the extent of changes in indi-vidual sectors of investment for the members of the Community, while Table 3 outlines the proportions of each sector of investment in re-lation to the whole. From this table, one can clearly see the effect of the decline in the pub-lic authorities' investment in the United King-dom and Germany in 1976. The counterpart was a rise of 1 - 2 percentage points in the proportion of business investment to total in-vestment in these two countries.
The main weakness of fixed investment during 1976 in a number of Member Countries ap-pears to have been hesitancy on the part of the business sector to increase productive capaci-ty. This applies particularly to Belgium, Luxem-bourg and the Netherlands in which business investment declined in volume. The United Kingdom also experienced a decrease in the volume of business investment though this decrease was smaller than in investment by the public authorities.
Table 2 - Gross fixed investment in the Community: by sector(')
In milliard units of account Percentage of
at current prices total
Sectors
1972 1973 1974 1975 1976 1972 1976
Business investment 97.1 108.5 121.1 128.8 144.2 55.9 55.5
Housing 49.2 56.5 62.3 64.7 73.8 28.4 28.4
Investment by public
authorities 27.2 29.3 34.6 38.5 42.0 15.7 16.1
Total Community 173.5 194.3 218.0 232.0 260.0 100.0 100.0
(') The statistics for 1976 are estimates of orders of magnitude.
[image:14.486.53.450.495.645.2]In Italy, on the other hand, the growth of invest-ment by the public authorities far outweighed the modest rise in business investment; this pattern occurred in a less pronounced form in Ireland. In France, Germany and Denmark busi-ness investment increased faster in volume than the domestic product.
As mentioned earlier, business expenditure in
Belgium on fixed capital investment declined in
volume by 11.4 per cent in 1976 following a drop of 4.3 per cent in the previous year. While
the underlying business situation was
strengthened last year, the faltering of the re-covery in the second half tended to inhibit the expansion of new business investment.
On a number of fronts, however, the founda-tions were being laid for a future increase in in-vestment activity. The counterpart to the rise in manufacturing output was the improvement in capacity utilization which increased from a low point of 71 per cent in October 1975 to 76.6 per cent in May 1976, when however it stabi-lized. In addition, the very small increase in unit wage costs of production, in relation to poten-tial price gains, enabled the average enterprise to recoup some of the profitability which had been severely eroded during the recession. Nevertheless profit margins in certain key sec-tors of industry such as steel, non-ferrous me-tal products, chemicals, paper and textiles, continued to be under pressure owing to the weak order position.
In contrast, the volume of housing construction increased by 5 per cent in 1976 and, after tak-ing into account the rise in prices of new hous-ing, rose by 24 per cent in value terms. Major factors in this substantial surge in activity were the carry-over of unsatisfied demand from the previous year, the ready availability of mort-gage funds at reasonable rates and, to a cer-tain extent, the temporary raising (until early 1976) of the amount of grants available to sti-mulate new construction activity in certain re-gions of the country. New building permits in-creased so rapidly in the first half of 1976 that the authorities felt compelled to restrict the availability of new mortgages in order to avoid
excess pressure on the construction industry and on financial resources.
The volume of investments by the public au-thorities grew in 1976 by almost 5.5 per cent, largely because the counter-cyclical accelera-tion of Government construcaccelera-tion programmes which began in 1975 remained in force last year.
Luxembourg while benefiting similarly from
special public works programmes, also experi-enced a fall in the volume of business invest-ment which declined by about 7 per cent in 1976. This was the third consecutive year of contraction but, on this latest occasion, the weakness of the steel industry's markets was not to blame, since steel investment increased by an estimated 44 per cent in value last year. In view of the importance of the industry to the Luxembourg economy (contributing 30 per cent of total business investment), the Govern-ment initiated fiscal incentives in December 1975, which were the key factor in stimulating an expanded investment programme. New bu-siness construction by the rest of the econo-my, however, was very much lower than in 1975; indicative of this, the usage of cement was reduced by some 16 per cent last year. With a view to encouraging investments in gen-eral, the Government has decided to raise the rate of investment premiums from 9 per cent to 12 per cent, but this measure will only take ef-fect in 1977.
New residential construction also declined, by some 13.5 per cent in volume terms, reflecting the lower demand for housing which has pre-vailed in recent years. As in 1975, the fall in construction was centred on new apartments since demand for houses appears to have stabilized. One effect of the reduced activity has been to bring the rate of price inflation in the residential construction sector more into line with the rest of the economy than in recent years.
works programme instituted by the Govern-ment as an employGovern-ment stimulant was a major
factor which added roughly 13 per cent to the
value of capital expenditures by public
authori-ties between September 1975, when the
pro-grammes started, and March 1977.
In spite of the granting of substantial invest-ment allowances and their increase as from the month of June, the volume of business capital
expenditure in the Netherlands declined by a
further 4.5 per cent in 1976 or to the same
ex-tent as during the previous year but rather less than that in its Benelux partners. The lack of growth in new productive investment stemmed directly from a relatively high degree of unuti-lized capacity and uncertainty as to whether business conditions would improve. Under such circumstances new investment tended towards the installation of labour-saving ma-chinery and equipment rather than extensions to capacity through new construction.
A problem for the residential construction sec-tor in recent years has been the saturation of the market and the need for the industry to ad-just its size to the reduced level of household formation. There is some evidence that a new
state of balance had been reached in 1976
fol-lowing years of decline in new construction. Although the number of dwellings completed
was lower in 1976, that of housing starts was
moderately higher than a year earlier. Capital spending on new housing increased by about
11 per cent in value and by about 2 per cent in
terms of volume. The pattern of demand in the Netherlands, as in a number of other countries in the European Community, appears to have shifted towards detached dwellings rather than apartments.
The volume of public authority investment
in-creased by 3.5 per cent in 1976, roughly as in
the previous year. This expansion reflected the continuing emphasis of the public authorities on providing new employment opportunities, particularly in the depressed 90nstruction in-dustry.
The United Kingdom authorities have also
sought to expand job opportunities, aiming to
achieve this by encouraging productive invest-ment. The reduction of some of the higher
rates of VAT in the April 1976 Budget was
ex-pected to stimulate consumer expenditure and so to create a climate in which domestic output might rise, bringing idle productive capacity in-to use. In August, a revision of the Price Code to allow applications to raise prices to take a greater part of the cost of investment into ac-count probably eased the financial position of companies. The significant increase in the
value of trading profits in 1976 might have been
less but for these two measures.
On the other hand, business sentiment was ad-versely affected to some extent by the raising of social security contributions payable by em-ployers. Greater discouragement, however, came from the slow growth of industrial
pro-duction which, for 1976 as a whole, was only
0.5 per cent higher than a year earlier. The
vol-ume of new business investment declined by
3.1 per cent in 1976; but after reaching a low
point in the present investment cycle in the first quarter, capital expenditures moved irre-gularly higher during the remainder of the year. Indicative of the need for an improvement in the business climate was the volume of new in-vestment in manufacturing industries which
reached a low in 1976 some 22 per cent below
that of 1970. In contrast has been the
contin-ued high rate of investment connected with the North Sea oil programme.
The volume of new residential construction
was virtually unchanged from that of 1975.
However, this result derived from the carry-over of dwellings in course of construction
from the end of 1975 and in the earlier part of
1976; after this, activity in both the private and public housing sectors was very depressed
and housing starts in the fourth quarter of 1976
were 32 per cent lower than a year earlier. In the private sector, the rise in interest rates in
the second half of 1976 posed problems for
%
0
Germany
Chart II - Elements of gross fixed investment (1)
Percentage change 1976/1975 at current prices,
based on amounts in national currencies
France United Kingdom Italy Netherlands Belgium Denmark Ireland Luxembourg
Housing
investment ~ ~ lnve~tment public authorities of
(1) Estimates based on orders of magnitude.
See "Principal Sources" 2.b, 3.b, 4.b, S.b, 6.b, 7.c, 8.b, 9.b, 10.a.
%
40
30
20
10
14
Uncertainty over the availability of funds for fi-nancing new construction tended to limit the willingness of private builders to construct housing without sales being assured. In the public sector, the introduction in July of curbs on local authorities' housing schemes, which were part of the more general controls on pub-lic sector expenditure, were a significant con-straint on new public authority housing in the latter part of 1976.
The volume of public authority expenditure on other forms of fixed investment declined by some 14.5 per cent in 1976 and was almost at the same level in real terms as a decade earlier. The reduction last year was due to two factors; the series of decisions to curtail central and lo-cal Government expenditures taken from late 1975 onwards bore most heavily on discretion-ary capital expenditures and secondly the suc-cess of the revised system of administrative controls on departmental budgets which held expenditures within the reduced budgets.
The curtailment of capital expenditure by the U.K. public authorities was in sharp contrast to the policy followed in Italy, where public au-thority capital expenditures increased by some 32 per cent in value in 1976, continuing the very rapid expansion of investment by the public sector in recent years. A major stimulative pro-gramme announced in August 1975, intro-duced a new series of public works projects and unlike changes of policy in some other Community countries which have sought to restrain investment by the public sector, there was no cutback in capital spending in Italy in response to commitments to limit the growth of the public sector deficit.
Business capital expenditures rose rather less than those of public authorities. The increase was 20.1 per cent in value terms in 1976 which implies, if one excludes the rise in prices, only a marginal increase of perhaps 1 per cent in volume. Conflicting trends limited a clear-cut advance in business investment, despite the severe decline in real terms in the previous year. On the one hand, industrial output and exports were particularly buoyant in 1976, the first rising by over 12 per cent in volume and
the second by some 33 per cent in value terms. At the same time it appears that company prof-itability rose during the course of 1976, albeit from a very low base, due in part to a rise in de-mand which enabled prices to be increased and in part to the much slower growth in labour costs per unit of output. It has also been the case that the rise in labour costs in recent ye-ars and, furthermore, the high potential costs involved in any eventual redundancies have en-couraged companies to increase their capital intensiveness without necessarily adding to their work-force. A by-product has been the continued rise in unemployment in 1976. De-spite the increase in output, capacity utilization remained relatively low at about 75 per cent at end-1976 compared with 68 per cent in the fourth quarter 1975. Similarly, it was clear that much of the rise in industrial output was linked to a once-for-all rebuilding of business invento-ries which, correspondingly, overemphasized the recovery in underlying demand. A further factor which may well have influenced invest-ment decisions at the margin, was the very high interest rates (more than 20 per cent for most of the second half of 1976) payable on new bank loans by businesses.
New residential construction last year contin-ued to be affected, as in 1975, by rent controls. Total housing investment rose by almost 18 per cent in value, which implied a small decline in real terms of about one per cent. A factor in this decline was undoubtedly the very high rates payable on mortgage loans which, with the rent freeze, offset the incentives for private proprietors to expand investment in accommo-dation for renting. But in total the volume of re-sidential construction, both in the public and private sectors, was stimulated by the Govern-ment programmes introduced in mid-1975. Public sector housing, although contributing a small share of total residential construction, showed the strongest growth as a result of the injection of public funds for social housing pur-poses.
poli-Table 3 - Shares of capital Investment In Community countries C)
Gross fixed investment Gross
Domestic Sectoral shares in O/o
Countries Product As Ofo of gross
at current domestic Business Housing Investment
market prices product investment construction by public
authorities
Germany, OM milliards
1975 1 029.4 21 54 27 19
1976 1121.3 21 55 28 17
France, Ffrs milliards
1975 1 437.1 23 51 34 15
1976 1657.4 23 51 33 16
United Kingdom, £ millions
1975 103 294 20 65 20 15
1976 120 911 19 67 20 13
Italy, Lit milliards
1975 114 215 21 55 29 16
1976 142128 20 55 28 17
Netherlands, Fl milliards
1975 205.4 21 58 24 18
1976 232.9 20 56 25 19
Belgium, Bfrs milliards
1975 2289.4 22 57 28 15
1976 2544.4 21 51 33 16
Denmark, Dkr milliards
1975 203.7 20 62 21 17
1976 232.8 22 62 23 15
Ireland, £1r millions
1975 3666 24 54 26 20
1976 4473 24 55 25 20
Luxembourg, Lfrs milliards
1975 81.7 29 47 28 25
1976 87.5 28 46 25 29
Total Community 1975 1 086.1 21 56 28 16
u. a. milliards 1976 1 237.8 21 56 28 16
(') This table is based on estimates, at current prices, of orders of magnitude. Strict comparisons of gross fixed investment cannot validly be made because of differences of definition and composition from one Member Country to another.
See •principa/Sources"2.b, 3.b, 4.b, 5.b, 6.b, 7.c, 8.b, 9.b, 10.a.
cies aimed at reducing unemployment. Nev-ertheless the Irish authorities' capital expendi-ture did not expand to the extent budgeted for the year.
The weak point in investment was the volume of new residential construction which decltned by perhaps more than 5 per cent in 1976 but in-creased in value by 18 per cent. The volume decline was shared by the private and local au-thority housing sectors, both of which experi-enced a decrease in the numbers of houses
started and completed. The closure of the As-sociated Banks during the summer months may have contributed to the difficulties of the housing market, both from the point of view of builders operating on borrowed funds and of house-owners unable or unwilling to conclude financial commitments at such an uncertain time.
[image:19.483.26.427.67.460.2]terms of about 24 per cent. Much of this up-surge consisted in the inflation of capital goods prices, and it appears that a few large projects formed the bulk of the growth in business vestment. There was a notable expansion of in-vestment in the agricultural sector which may have been associated with the increase of farm incomes in 1975. The substantial increase in export orders for industrial products may also have required some extension of capacity for certain industries even though the seriousness of the unemployment situation suggests that many firms were not working close to full ca-pacity. A further contribution to new invest-ment no doubt derived the success in attract-ing new industry from abroad by means of gen-erous investment and tax credits particularly for industries engaged in production for ex-port.
Business investment played an even more
im-portant role in France. The growth in the
vo-lume of business investment (excluding hous-ing) in France during 1976 of 7.3 per cent, which followed a decline of 7.2 per cent in 1975, was very largely due to the stimulation of investment by public enterprises through the apportionment, ·under the plan introduced in September 1975 for promoting economic re-covery, of FF 13 milliard of budgetary funds for purchasing plant and machinery for the public sector. In the same plan a stimulus was also given to private enterprises through the grant of tax concessions for investment in produc-tive capacity amounting to FF 2.8 milliard. ln-verment activity by private enterprises as well as by public enterprises consequently rose during the first half of 1976. The vehicle con-struction industry, and the distributive and ser-vice industries increased their fixed investment during 1976 more than other industrial sectors. Later in the year, however, the outlook for prof-it margins became more uncertain; wage costs continued to rise strongly - hourly wage rates
increased by 15 per cent in 1976 - even after
prices were frozen until the end of the year un-der the "Barre" anti-inflationary plan and creases in interest rates put up the cost of in-vestment at a time when there was surplus productive capacity in most industrial sectors.
Not surprisingly private enterprises tended to defer the implementation of their investment plans.
Possibly as a consequence of the decline in in-vestment in dwellings during 1975 the number of housing completions fell in 1976. However, the number of authorizations for building new dwellings began to rise again from the first quarter of 1976 onwards. This upswing was not particularly vigorous because of the uncertain economic outlook and generally low level of confidence and so investment in housing con-tinued to decline in volume last year. As in a number of other Member Countries of the Eu-ropean Community, however, the demand for individual housing units increased while that for apartment blocks fell.
Fixed investment by the public authorities, which had expanded rapidly, by 10.5 per cent in volume, during 1975 as part of the effort to restimulate the economy, fell back to an annual rate of 5.4 per cent during 1976 and was slow-ing even more towards the end of the year. The pace of this expansion appears to have been accompanied by an increase in building costs of about 14 per cent in 1976 after having risen by just over 7 per cent the previous year. One of the main elements in the inflation of costs was hourly wages of construction workers, which had increased by 14 per cent during 1975 and rose by a further 19 per cent last year.
The growth of business investment in Germany
end of 1976, and the value of imported capital goods increased by 19 per cent in the fourth quarter 1976 compared with a year earlier.
Industrial firms were on average operating at 81.2 per cent of capacity in October 1976; while this represented some improvement compared with a year earlier, the degree of un-utilized capacity acted as a constraint on new construction in some industries. The invest-ment premiums on new construction offered by the Government (until mid-1977 or a year longer than a similar concession on capital equipment) encouraged a rapid rise in the first half of 1976 in permits to build, but these de-clined later in the year. In 1976 as a whole, however, the volume of new business con-struction rose by rather more than a year earli-er.
New housing construction rose in volume terms by 6.7 per cent in 1976; but this improve-ment only partly compensated for the 10.4 per cent reduction experienced by this sector of investment in 1975. The turn-around neverthe-less indicated a rise in demand from families for housing and the effects of the provision of public funds for modernisation. In general, there do not appear to have been any con-straints from the financing point of view as mortgage funds were in plentiful supply at low-er intlow-erest rates than for many years. The patt-ern of new house construction shows a contin-uation of the shift away from multi-unit housing and towards detached and semi-detached dwellings. Demand for multi-unit housing again fell, probably because the current rent act pre-vents property companies or individual lan-dlords from charging rents sufficient to cover costs.
The volume of new capital expenditures by the public authorities contracted by almost 4 per cent in 1976 and even in value terms was 1.4 per cent lower than in the previous year. The public authorities have sought to contain discretionary expenditures so as to achieve a further reduction in the heavy cash deficits which were largely the result of lower tax reve-nues and social security contributions during the recession and of steeply rising expenditure
on extensive programmes for sustaining econ-omic activity as well as on social security dis-bursements by the Federal, Lander and munici-pal authorities during 1975 and 1976. As capital projects constitute a major portion of discre-tionary expenditures, the impact of budgetary curbs on the investment programmes of the public authorities has been particularly heavy. In addition certain infra-structural investment such as in hospitals and schools appears to be catching up with demand.
Fiscal incentives in Denmark aimed at reducing unemployment resulted in a higher growth in the volume of business investment than else-where in the Community. The rise of about 18 per cent in volume terms, however, followed a sharp decline in 1975 of 14 per cent. Industrial output increased by about 8 per cent in 1976 in response to the rapid expansion of consumer demand on the home market and the rise of export sales of about 7 per cent in volume terms. This increase was accompanied by a gain in profitability in 1976 after a depressing year for company earnings in 1975. As a result, there was increased willingness on the part of businesses to envisage additions to capacity and to commit funds for new investment. These factors were reinforced by the tax reliefs on new investment (up to 20 per cent reduc-tion on taxable profits for investments made before end-1976), subsidies and loan guaran-tees granted by the Government in the autumn of 1975 and extended further in August 1976. Since these fiscal incentives are to be reduced in 1977, this may tend to dampen the pattern of .investment in the current year. Unlike in anum-ber of other Community countries where the recovery in investment has been directed mainly towards additions to machinery and equipment, the expansion of new capital ex-penditures in Denmark last year occurred equally in the construction sector. The amount of new industrial and commercial buildings un-der construction was 27 per cent higher in 1976 than in the previous year.
18
1976 the housing sector was favourably influ-enced by the lower VAT rate applicable at that time and by the longer payment periods avail-able temporarily on mortgages for houses commenced before the 1st April. Subsequent-ly, the number of starts on new housing units declined from the rate of the previous year, perhaps partly as a consequence of the high mortgage interest rates charged in the second half of 1976. However, the number of dwelling units under construction was generally rather higher than in 1975 and the volume of new re-sidential investment rose by about 27 per cent in 1976. Statistics of expenditure on housing
include reconstruction work which expanded considerably last year.
CHAPTER 2
FINANCING OF INVESTMENT
2.1 THE FINANCIAL BACKGROUND
In early 1976 the scene was set for a high rate of activity on capital markets as monetary poli-cies were accommodating, short-term interest rates and bond yields were on a downward trend, and capital markets were receptive to the flow of new issues. However, pressures soon developed on currency exchange rates then prevailing throughout the Community, and indeed the Italian foreign exchange market was closed for 6 weeks early in the year, such that capital markets were constrained by the back-wash of events and the reactions of monetary policy to these essentially external difficulties. Currency pressures occurred mainly during two periods of the year, from mid-January to March and from late August to mid-October. Furthermore, it became evident during the year that the stimulative Government policies intro-duced during the economic recession were raising the size of the public sector's financing requirement in some Member Countries.
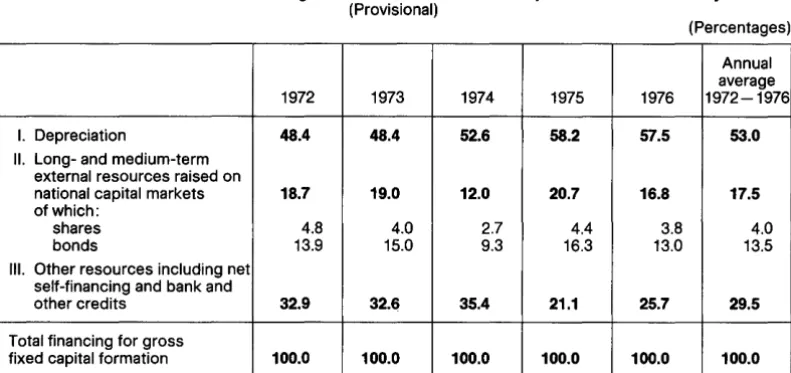
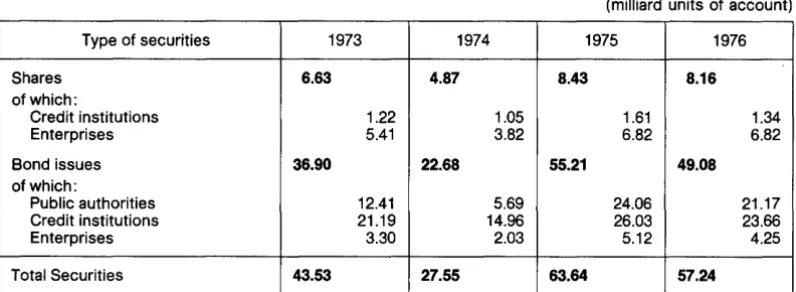
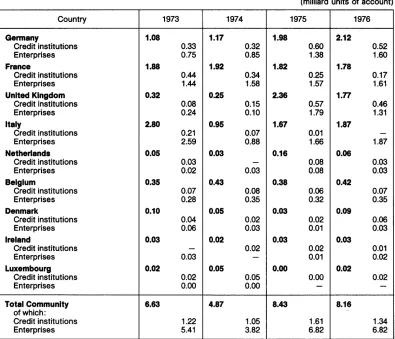
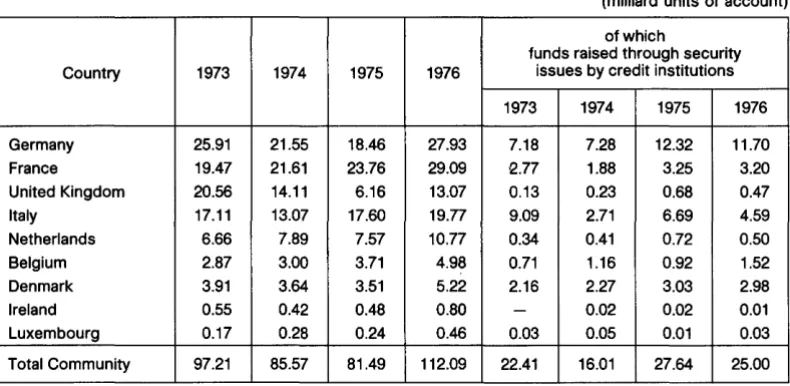
In many countries short-term money market rates rose higher than long-term bond yields and at such times investors tended to neglect the bond markets as funds moved into more profitable, shorter term instruments. It is hardly surprising, therefore, that total issues of secu-rities in 1976 did not quite match the very large amount of issues in the previous year. With sometimes difficult issue conditions prevailing on capital markets during periods of the year, the proportion of bank credits in the total of fi-nancing in 1976 increased in relation to that of new bond and share issues - as can be seen in Table 5. In contrast, new public bond issues on the "European" international market rose by 105 per cent in 1976 in response to the declin-ing trend of yields on that market and an abun-dance of funds seeking investment outlets.
Stimulative Government policies, while achiev-ing their objective of raisachiev-ing economic growth,
also resulted in some instances in higher im-port propensities and a deterioration of the current account deficit of the balance of pay-ments. At the same time latent inflationary pressures were aggravated in some countries either by the economic expansion or by the in-creased cost in domestic currency of imported goods resulting from the decline in exchange rates. Consequently, monetary policy in a num-ber of Memnum-ber Countries had to be tightened during the year, despite the continued exis-tence of high unemployment.
20
bond yields showed a clear-cut decline over the balance of the year.
In the opening months of 1976 the external and domestic monetary situation in the United
Kingdom was relatively stable, buttressed by a
drawing on the International Monetary Fund oil facility. Interest rates declined during the first two months of the year and a sizeable amount of bond and share issues was absorbed by capital markets.
But from early March until the end of May the external value of sterling slid rapidly, losing some 12 per cent whether valued against the U.S. dollar or a trade-weighted basket of other currencies. This slide was checked in early June by the announcement that the
Govern-ment had arranged a
$
5 300 million stand-bycredit over three months (but extendable) from major creditor countries. In the meantime, the monetary authorities sought to rebuild the short-term interest rate differential in favour of the U.K. so as to discourage capital outflows.
During this period of rising interest rates the market in fixed interest securities turned hesit-ant. Concern also began to be shown that the growth of the public sector financing require-ment would add to inflationary pressures. Influ-enced by this, the Government announced plans in July to limit the growth of expenditures (mostly capital spending) in the 1977-78 fiscal year and to hold the expansion of the money supply, broadly defined, to about 12 per cent for the year to end-March 1977. By September it was becoming evident that the money stock was increasing at a rate greatly in excess of this target, due to the slowing of gilt-edged sales to th·e non-bank public during the sum-mer months and to more lending by the banks. The resultant blow to confidence brought ster-ling under renewed pressure in September and October when the exchange rate fell by a fur-ther 10 per cent on a trade-weighted average.
A further tightening of monetary policy was therefore found to be necessary. Two separate increases in special deposits were required to be made by the banks with the Bank of
Eng-land, amounting to £ 750 million between late
September and early November; but, while these measures severely reduced banks' li-quidity, they did not immediately constrain bank lending. Also in November came the rein-troduction of a system (known as the "corset") of supplementary reserve requirements against the growth of interest-bearing deposits with severe penalties on any growth above a given ceiling. This measure was aimed at discourag-ing too rapid a rate of increase in the money stock and in bank lending, without necessarily raising interest rates. During the same month, in a move to strengthen sterling, new lending to finance trade between third countries in the former Sterling Area was prohibited. The fur-ther step taken by the Government to agree in December the terms and conditions for obtain-ing a S.D.R. 3 360 million stand-by credit, draw-able in stages over a two year period, had little impact on the capital market in what remained of 1976 but was one of the main influences in the restoration of confidence in early 1977.