Contents
Editorial note 2
Evolution de l'utilisation de l'ordinateur du
Centre de Calcul 1973-1977 3
Statistics of computing installation utilization - January 14
Utilization by objectives and accounts- January 15
Table of equivalent time, summary per month
and cumulative 16
Note of the Editor The present Newsletter is
published monthly except for August and December.
The Newsletter includes:
• Developments, changes, uses of installations
• Announcements, news and abstracts on initiatives and accomplishments. The Editor thanks in advance those who want to contribute to the Newsletter
by sending articles in English or French
to one of the following persons of the Editorial Board.
Editorial Board
I
Comite de Redaction H. de Wolde, D.G. lspraC. Pigni, C.C. lspra J. Pire, C.C. lspra
Consultant: S.R. Gabbai, D.G. lspra
Computing Centre References
Manager Adjoined Computer Room Adjoined Peripherals System Group Adjoined Informatics Support
o General Information o Program Information Service
Adjoined
o Graphics and Support to Users Adjoined
Application Packages Programming Languages
Note de Ia Redaction
Le present Bulletin est publie mensuelle-ment excepte durant les mois d'aout et decembre.
Le Bulletin traite des:
• Developpements, changements et emploi des des installations
• Avis, nouwlles et resumes concernant les initiatives et les realisations. La Redaction remercie d'avance ceux qui wulent bien contribuer au Bulletin en envoyant des articles en anglals ou fran~is 4 l'un des membres du Comite de Redaction.
Room
J. Pire 1816
G. Gaggero 1874
P. Tomba 1857
A. Binda 1857
G. Nocera 1825
D. Koenig 1839
P.A. Moinil 1841
G. Gaggero 1874
G. Hudry 1873
G. Gaggero 1874
S. leo Menardi 1884
H.l.deWolde 1890
A. Pollicini 1882
A. lnzaghi 1887
C. van den Muyzenberg 1848 Tel. 732 787 797 797 767 742 704 787 787 787 721 753 743 755 781
Editor : Jean Pire Layout Paul De Hoe
Evolution de !'utilisation de l'ordinateur
du Centre de Calcul 1973 - 1977
J. Pire
II y a maintenant plus de cinq ans que l'ordinateur IBM 360-165 est en service au Centre de Calcul d'lspra. II peut litre interessant de suivre !'evo-lution de son utilisation au cours des annlles 1973
a
1977.Nous avons pense que quelques graphiques seraient plus parlants qu'un long discours.
Chacun des brefs paragraphes ci-dessous n'est qu'un commentaire de l'un des graphiques publies en fin de cet article.
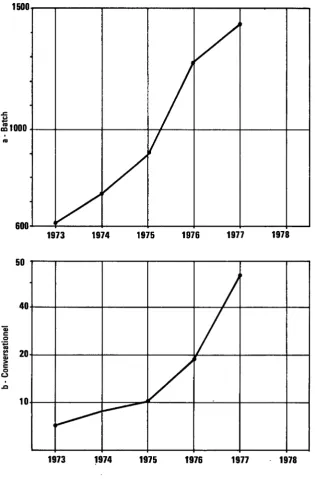
1. Heures CPU en mode probl~me batch (fig. 1.a)
Le facteur d'accroissement exponentiel annuel moyen est de 1.24. L'enorme accroissement constat~ en 1976 est
a
mettre en correlation avec !'augmentation de Ia taille de Ia m~moire. Entre 1973 et 1975 le facteur d'accroissement exponentiel etait de 1.20.2 Heures CPU en mode prob/eme conversationnel (fig. 1.b)
L'accroissement exponentiel annuel moyen est de 1.61, c'est cependant seulement au cours de 1977 que !'utilisation a fortement augment~e
(double par rapport
a
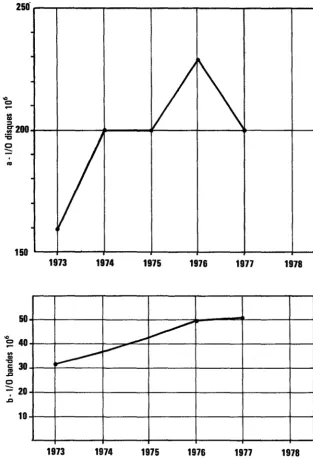
1976) par suite de Ia mise en service de I MS. Une augmentation spectaculaire peut litre attendue en 1978 avec !'intro-duction de T.S.O.3. 1/0 disques (fig. 2.a)
Le nombre d'l/0 disques a connu une pointe en 1976 par suite d'un usage intensif du syst~me CO RIG de Ia part de !'administration.
En 1978 l'augementation de l'acivite due
a
T.S.O. sera probablementcompens~e en partie par une nouvelle diminution de !'utilisation de CO RIG.
4. 1/0 bandes (fig. 2.b)
Le nombre d'l/0 bandes est en augmentation, mais semble s'@tre stabi-lisee en 1977. Le rapport des travaux demandant le montage des bandes et des travaux sans montage est en nette diminution. En 1973 il etait de 0.33, il est maintenant environ 0.25.
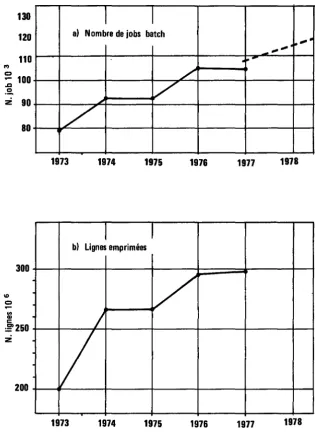
5. Nombre de travaux pn!senttJs (fig. 3.a)
L'augmentation du nombre de travaux est constante, mais faible: en moyenne de 6000 travaux par an.
6. Lignes imprimees (fig. 3.b)
Le nombre de lignes imprim6es a augment6 spectaculairement en 1974, lors de !'introduction du syst~me CORIG et en 1976 Iars de !'exploi-tation intensive du mi!me svsteme.
L'introduction de systemes conversationnels devrait stabiliser ce para-metre sur Ia valeur de 1977 sinon le faire d6crortre dans les annees il venir.
7. Cartes lues (fig. 3.c)
Le nombre de cartes lues est
a
peu pr~s stable depuis 1974 alors qu'il 6tait en forte croissance au cours des ann6es pr6cedentes. II diminuera probablement dans l'avenir.B. Cartes perforees (fig. 3.d)
Le volume des cartes perforees par l'ordinateur est en constante dimi-nution. Nous esp6rons que ce phenomene continuera et mi!me s'accentuera encore.
Caract6ristiques des travaux pr6sent6s
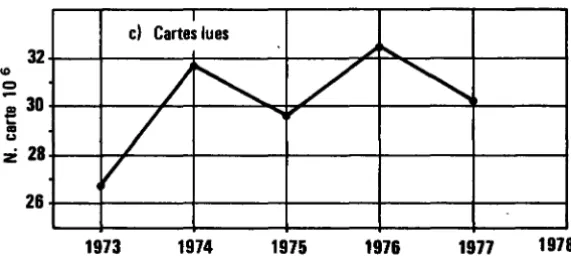
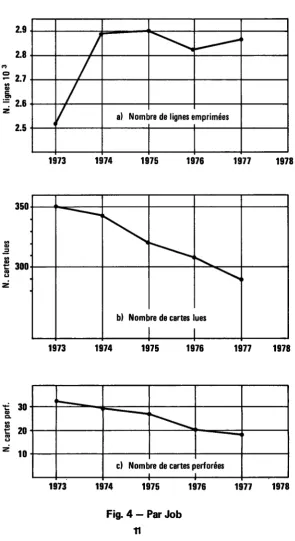
9. Nombre de /ignes imprimtJes par travail (fig. 4.a)
Apres une croissance forte en 1974, cette valeur s'est stabilisee
a
environ 2850 !ignes par travail.10. Nombre de cartes lues (fig. 4.b)
II est en constante diminution, de plus en plus les cartes sont m6mo-ris6es sur disques; il est passe de 350
a
290 cartes par travail; Ia securite des travaux en est accrue.11. Nombre de cartes perforees (fig. 4.c)
II est diminue de pres de Ia moitie entre 1973 et 1977. La diminution a etA de 33
a
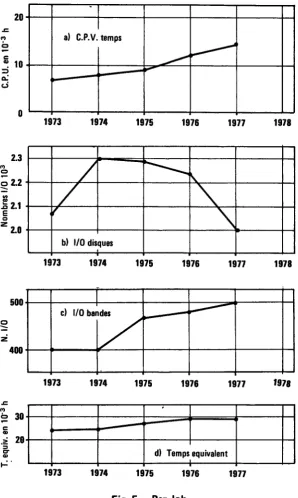
18 cartes en moyenne par travail.12. Le temps CPU en mode probleme (fig. 5.a)
1500
.c ::! ~1000
...
600
50
40
"ii c Q ·.;:;
...
e 20
"'
> c Q
(,)
..a
10
/
I
v
/
1973 1974 1975 1976 1977 1978
I
1/
v
~
~1973 ~974 1975 1976 1977 . 1978
[image:6.411.47.363.58.538.2]13. Le nombre d'l/0 disques (fig. 5.b)
Apres une forte augmentation en 1974 (CORIG) il est en diminution, car les travaux scientifiques augmentent et les travaux administratifs diminuent.
14. Le nombre d'l/0 bandes par travail (fig. 5.c)
II est en l~ere augmentation; Ia proportion des travaux exigeant des bandes thant en diminution, nous en concluons que les bandes requises contiennent des fichiers plus volumineux que ceux utilises dans le passe.
15. Temps dquivalent par travail (fig. 5.d)
II augmente r~gulierement; non seulement le nombre des travaux augmente, mais aussi leur ampleur.
16. L 'importance du temps CPU par rapport au temps equivalent
(fig. 6. - 8)
II est en augmentation depuis 1974. Apres !'explosion des travaux
ad-ministratifs, les travaux scientifiques reprennent le dessus.
17. Occupation mt!moire d'un travail moyen (fig. 6.a)
Nous voyons que Ia tendance
a
!'augmentation s'est nettement accen-tuee en 1976 par suite de l'agrandissement de Ia memoire centrale. Une analyse plus fine de Ia tendance montre qu'elle ne fait que s'accen-tuer.18. Perforation manuelle de cartes (fig. 6.b)
La quantit~ de cartes perforees manuellement a touche son maximum (environ 800.000 cartes) en 1973, elle diminue r~ulillrement jusqu'en -1977 (625.000).
Depuis 1975 les variations sont faibles: environ 380.000 cartes pour I' administration et 200.000 cartes pour les travaux scientifiques.
Nous esperons que Ia decroissance reprendra en 1978.
19. Utilisation du Centre de Calcul par les difft!rents objectifs
Une petitte analyse de Ia Table 1 montre que le travail pour !'admi-nistration en 1977 n'a plus repr~entl! que 16% du total contre plus de 30% en 1975.
250. - -...
---..----.----..,..----,r---r---.,
...
c;! ::I
~200+-~~----~----~~----+---~---+-_,
:c; 0
--
..
.
150
~-+---,~---4---~---~~---4-~50
"'
~ 40"' a>
-g
30jg 0
::;: 20
10
1973
1974
1975
1976
1977
1978
_....
~
~
~1973
1974
1975
1976
1977
1978
[image:8.416.48.361.58.517.2]TABLE I : Utilisation des installations de calcul
Projets/Comptes d' Affectation Contrats
Su rete des reacteu rs Comb. au Pu & Act. Dechets nuch~aires
Energie solaire Hydrogene Etudes fusion
Environnement & ressources M.E.T.R.E.
lnformatique Gestion mat. fiss. Serv. gen. admin. Serv. gen. techn.
L.M.A. ESSOR
Support Commission Contrats avec tiers Total
Conclusions
IBM 370/165 · Janv. ·Die. 1977
1.200,3933 38,9332 29,9069 9.4351 1,4658 25,0923 222,2175 39,5052 532,2901 12,7417 461,5748 15,5119 0,2127 106,6061 79,3654 227,7090 3.002,9610
Les demandes de travaux pr~sent~es au Centre de Calcul au cours des cinq derniAres ann~es sont en constante augmentation tant en nombre qu'en dur6e d'edcution et en taille de memo ire requise.
Les op~rations periph~riques requises ont atteint un plafond ou sont en diminution.
L'introduction des facilit~s conversationnelles, dont !'utilisation s'intensifie de fac;:on tres satisfaisante, accentuera encore tres probablement ces deux tendances.
[image:9.411.48.355.67.282.2]..,
c
130
120
110
.- 100
.c .!a
z
90"'
"'
c
80
300
~250
z
200
I
I
a) Nombre de jobs batch
~
....
·
...
•
~o..
/
v
~
L
1973
1974
1975
1976
1977
1978
I
I
b) lignes emprimees
/
J
v
1973
1974
1975
1976
1977
1978
[image:10.414.51.367.53.487.2]10
Cl
32
:; 30
...
"'
...
z
2826
10
~ 3.0
t.)
z
2.0
v
1973
...
1973
I
c) Cartes lues
~ ~
J
"'
/
~
/
1974 1975 1976 1977 1978
I
d
I
Cartes perforeesr---_
1974 1975 1976 1977 1978
[image:11.414.71.357.136.268.2]2.9
2.8
..,
~
2.7
"'"'
a.
=:
2.6
z
"'
"'
.2
2.5
350
~
...
300
...
z
...:
...
"'
Q."'
"'
....
...
...
...
z
30
20
10
/
~
---I
I
v
1973
1973
-1973
a) Nombre de lignes emprimees
1974
1975
1976
1977
---
~
~
~""-..
b) Nombre de cartes lues
I
I
1974
1975
1976
-
~
c) Nombre de cartes perforees
[image:12.410.73.369.38.580.2]1974
1975
1976
Fig. 4 - Par Job
1977
1977
1978
1978
..c:
..,
b
c
20
~ 10
:::1 0.: c,j
..,
c 0 2.30 2.2
--
"' m.Ei 2.1
E
Q
z 2.0
500 0
--400 ..c:..,
b
30
c
m
>
·:; 20
CT
m
....,:·
-I
a) C.P.V. temps
__.,..,-
~
-1973 1974 1975 1976 1977
/
~
1\.
/
~
I('
'\
b) 1/0 disques
1973
c)
1973
1973
.
1974 1975 1976 1977
-I/O
boo/
~---1974
1974
1975 1976
.
d) Temps equivalent
.
1975 1976
Fig. 5 - Par Job
1977
1977
1978
1978
[image:13.410.55.354.56.555.2]...
Cl-400
1000
.
.
.
.
I
I
I
a) Dccupttion mimoi,. d'un job
m~;/
~
v
-1973 1974 1975 1976 1977 1978
I
I
b) Cartes perfor6es manuellement
Total
[image:14.412.46.360.52.531.2]'
...
...
....
....
Trav. scientifiques ' ..
'
,
...
",
....
""'
...
"'
'"
'
'
'
---'
> ... -
---,
...
-
'
'
;I'
'
---;I'
....
Administr .
...
_
...
1973 1974 1975 1976 1977 1978
Statistics of computing installation utlization
Report of computing installation exploitation for the month of January
YEAR 1978 Number of working days
Work hours from 8.00 to 24.00 for Duration of scheduled maintenance Duration of unexpected maintenance Total maintenance time
Total exploitation time CPU time in problem mode
Conversational Systems:
22.50 d 352.00 h
24.08 h 18.43 h
42.51 h 337.57 h 132.07 h
CPU time 1/0 number Equivalent time Elapsed time
2.20 h
427,000 5.10 h
293.00 h Batch processing:
Number of jobs 8,952
Number of cards read 2,240,000
Number of cards punched 167,000
Number of lines printed - - - 26,817,000
Number of pages printed 602,000
YEAR 1977 20 d 16.00 h 27.00 h 86.10 h 113.10 h 206.90 h
71.36 h
1.10 h 136,000
2.00 h
75.00 h
6,246 1,827,000 96,000 16,478,000 364,000 BATCH PROCESSING DISTRIBUTION BY REQUESTED CORE MEMORY SIZE
100 200 300 400 600 800 1000 1400 total Numller of jobs 2323 2975 17&7 1235 215 78 63 8657 Elapsed time (hrsl 51 143 183 204 46 19 27 0.3 673 CPU time (hrs) 2.5 19 35 44 14 5 11 0.1 131 Equivalent time (hrs) 16 49 72 84 21 10 16 0.2 268 Turn around time (hrsl 0.4 0.7 1.2 1.6 2.3 3.6 3.0 1.9 0.9
PERCENTAGE OF JOBS FINISHED IN LESS THAN
TIME 15' 30' 1h 2h 4h sh
,o
~:P
,p
Utilisation of computer center by the objectives and appropriation accounts for the month of January
1.20.2 General Services- Administration - lspra
1.20.3 General Services- Technical- lspra
1.30.4 L.M.A.
1.90.0 ESSOR
1.92.0 Support to the Commission
2.10.1 Reactor Safety
2.10.2 Plutonium Fuel and Actinide Research
2.10.3 Nuclear Materials
2.20.1 Solar Energy
2.20.2 Hydrogen
2.20.4 Design Studies on Thermonuclear Fusion
2.30.0 Environment and Resources
2.40.0 METRE
2.50.1 Data Processing
2.50.3 Safeguards
TOTAL
1.94.0 Services to External Users
TOTAL
IBM 370/165 equivalent time in hours
50.83
1.02
15.07
1.52
150.35
1.15
1.94
1.29
2.16
8.86
2.21
24.00
3.00
263.40
12.61
EQUIVALENT TIME TABLE FOR A l l JOBS OF THE GENERAL SERVICES· Monthly and Cumulative Statistics
January February March April May June July August September October November December
Year 1977 44 74 78 32 26 36 27 25 27 31 40 34
accumulation 44 118 196 228 254 290 317 342 369 400 440 474
Year 1978 51 accumulation 51
EQUIVALENT TIME TABLE FOR THE JOBS OF A l l THE OBJECTIVES AND GENERAL SERVICES· Monthly and Cumulative Statistics January February March April Mav June July August September October November December
Year 1977 135 218 312 193 180 269 244 196 277 275 284 179
accumulation 135 353 665 858 1038 1307 1551 1747 2024 2300 2584 2763
Year 1978 211 accu mu I at ion 211
EQUIVALENT TIME TABLE FOR THE JOBS OF THE EXTERNAL USERS· Monthly and Cumulative Statistics
January February March April May June July August September October November December
Year 1977 13 14 18 16 13 22 19 18 27 25 21 20
accumulation 13 27 45 61 74 96 115 133 160 185 206 226
Year 1978 12 accu mu I at ion 12
EQUIVALENT TIME TABLE FOR A l l JOBS OF ALL USERS- Monthly and Cumulative Statistics
January February March April May June July August September October November December
Year 1977 158 241 314 242 202 294 266 217 299 299 318 235
accumulation 158 399 713 955 1157 1451 1717 1934 2233 2532 2850 3085
Programming Foundations
W. Boettcher, R. Jaarsma,
A.A.
Pollicini
The following article has been written as a summary of the course "Pro-gramming Foundations" as was organized by CREST, /RIA and the University of Toulouse, December 1977.
We considered the contents of importance for all programmers and decided to publish the article here. Other summaries of conferences, if there are of general interest, are also welcome.
The Editors
The title "Programming Foundations" suggests the presentation of basic and commonly agreed principles of programming. However the course was not so well structured and there were no connections between the lectures. It became clear that there is a great distance between the world of aca-demic computer scientists and the world of daily computer users which look for solutions of real problems and work mainly with the software tools supplied by the computer companies.
Nevertheless many practical problems were discussed and also methods which can be well applied in practice were taught.
We think that the following headings cover the greatest part of that was said.
1. Software Development Management 2. Better Languages
3. Program Verification and Correctness Proofs.
The preliminary documents are available at the Computing Support Library (Mrs. A. Cambon).
It is planned by the I R lA to publish a book, based on this course, next autumn.
It was amazing to discover that there are now so many students at univer-sities who study informatics as an adult, independent discipline.
Software Development Management
The actual need of Software involves a big amount of investments. Fur-thermore the ratio between Software and Hardware costs is continuously increasing, as shown in pictorial form by the Boehm's curve (1975).
%of 100 relative costs
80 HARDWARE
60
40
20
SOFTWARE MAINTENANCE
0
1955 1970 1985
These economical considerations lead to look at Software development as an engineering activity to be organized, let us say as the production of a car.
A series of lectures were dedicated to the global Software cycle. This topic was mainly illustrated by M. Jastrabsky, who represented the indus-try.
Software development may benefit by planning methodologies like PERT, already applied to control complex projects of other nature. The first need in doing that is to split the project into well defined subtasks, clearly ordered in time and interfaced by disciplined use of the resources.
Secondly, proper tools must be provided to carry out the project. Four main phases are identified in each Software project:
- Analysis of the requirements and problem definition, · Design of the solving process,
- Coding the solution in a computer acceptable form, Integration and testing the computer program.
Each phase requires:
· Separate estimates in time and resources, · Periodical reviews and progress reports,
As for any other application product, Software must be preserved from failures, therefore error checking must be applied at any stage of the project.
The most expensive errors are the ones made in the design phase, especial· ly when they are only detected in the production phase. Therefore the design should be the crucial point in the project, in order to build a well formed final product, containing as less as possible conceptual errors. This means that programmers become engineers and their job must firstly and mainly consist in thinking and finding solutions, while writing state· ments becomes a less important task of their profession.
In the lectures of M. Galinier the emphasis was put on the design phase. The design starts with a global view of the problem which is developed step by step in more detail.
Each step may identify a level of abstraction of the problem. Design methodologies can be based on this concept and the one developed at the Toulouse University was described.
· The most external entity is called Project and is composed by a hierar· chy of Abstract Machines (AM).
• Each AM covers a well defined action, assigning it some resources and operations on them.
· Software resources are classed in internal ones, which are defined in the AM itself (using a PASCAL-like data type mechanism), and external ones which are defined in AM of higher levels ..
. Operations are grouped in units called Modules, which may be internal if used only within the AM defining it, or external if activated by Modules belonging to AM of higher levels.
· Software resources needed by a Module must be declared as parameters classed in input only, output only and input plus output, so that the entire data flow is explicitly evident.
A Language for Abstract Machines Design Approach (LAMDA) was defined and a processor implemented to obtain a documented support of the design.
Starting from the codified design produced by LAMDA, by means of an interactive processor for semiautomatic program generation, a PL/1 pro-gram is developed.
Another series of lectures was devoted by P. Henderson to the use and management of libraries to support the development of large Software Systems.
The principles of such a data base were discussed and some data models described:
- A developmental model which represents the relationships among dif-ferent components concurring in a program development process. When a component has to be modified, this model points out directly what other components will become invalid as well as the needed pro-cesses to generate a valid copy of them.
- A structural model dealing with components of separate versions of a system.
When a specified configuration of the system is requested, this model picks up all the components to build it and even the specific case data to test it may be selected from the library.
Better languages
A programming language can be seen as a tool to describe algorithms. In general, solutions of problems are expressed in algorithms and algorithms are translated into programs, which are executed by a computer. Most of the programming languages are strongly computer directed and program-ming is mainly: "Adapting an algorithm to constraints and facilities of a computer". If however accuracy and design efficiency become more important than computer efficiency, then new concepts of programming languages are possible.
The lectures of J. Arsac, A.M. Burstall, R. Dewar and M. Griffiths were (partly). dedicated to the subject of better languages. Principles as modu-larity and structuring are evident and also valid in these higher level lan-guages.
The Newsletter is available at:
Mrs. A. Cambon Support to Computing Bldg. 36- Tel. 730
Des exemplaires du Bulletin sont disponibles chez:
Mme A. Cambon Support to Computing
The basic working methods may become:
Use a very high level language to write a correct program, which is perhaps not an efficient program. The language should permit easy and rapid programming (compare APL). The program is close to the pro· blem (and is remote from the machine level).
Prove correctness and modify in this version.
Transform the program correctly into a more efficient program executable by a computer. The correctness-preserving transformation may be done in different ways.
In the ideal case there is a compiler or preprocessor to do the job. However transformation may be done (stepwise) by hand applying correctly transformation rules until the program is in a form which can be coded in a known language.
J. Arsac proposed an assignment free language. Correctness proofs can then be constructed by applying the mathematical concept of substitution. Such a language is in general not implemented on a computer.
A program must therefore be transformed preserving its meaning. The method and rules to do so are an integral part of the language.
R.M. Burstall explained a system of rules for transforming programs, with the programs in the form of recursion equations. He proposed a simple functional programming language and listed explicitly those features of a language for writing correct and flexible programs. He advocated e.g. maxi· mum use of user defined types. Thus type "data" or type "pressure" rather than type "real". Also no assignment, thus a real specification lan· guage.
A refined system of type declarations was also backed by M. Griffiths, who proposed a lot of practical improvements in languages and compilers. E.g. a compile time checks on ranges of variables and tests on complete· ness of possibilities should be executed.
Program Verification and Correctness Proof
In spite of a big amount of papers devoted to this subject in the last 20 years, the ideas of program proving seems to have no important impact on current programming practice. One of the reasons for this may be that a truly practical program verification technology has been slow to develop, and that the extra work to carry out a formal program verification using existing techniques is still too much.
On this subject there were the 2 presentations from J.T. Schwartz and O.J. Dahl. Both are based on the inductive assertion technique of FLOYD/HOARE. In this approach, one attaches 2 predicates to the given program text: an input assumption (pre-condition) and an output asser-tion (post-condiasser-tion).
A pragmatic approach of J.T. Schwarts.
A program should not so much have proved correct as developed in such a way as to make its correctness evident. Therefore, rather than starting with large program texts and attempting to prove their correctness, we should prefer to work systematically with generally small units of program text. Such small units express some fundamental and essentially indecomposa-ble element of algorithmic technique and are known to be correct. The
rules for the manipulation and combination of correct program text units lead then to what Schwartz calls "the correct program technology". This
technique should open the way to an interactive, correct program mani-pulation system, in which a group of algorithm developers could enter "ROOT" programs to be used and combined into larger programs by the application programmers.
The more theoretic approach of O.J. Dahl.
In this presentation, emphasis was put on the design and proof of abstrac-tion mechanisms. By this it is possible to represent the semantics of an external program description by means of an abstract function. On the
other hand, the given program text leads to a concrete functional
descrip-tion.
The persons interested in receiving regularly the "Computing
O!ntre Newsletter" are requested to fill out the following form
and to send itto:
Mrs. A. Cambon Support to Computing Building 36, Tel. 730
Nom ..•.•.••••••••••..••.••.•.•••••.. • •• • ••• • •• ••• •••
Address ....••••.•.•.••••..•••••.••...•••.••.••••••..•.
Tel •..••••..••..•.•
EIN PRESENTATION
There will be a presentation and demonstration of the EIN Network on Wednesday 5th April, in the Amphitheatre of Building 36. This demonstration will be a milestone in the project and will take place simultaneously in 11 centres throughout Europe.