5th Asia-Pacific Congress on Sports Technology (APCST)
Geometrically accurate 3D FE models from medical scans
created to analyse the causes of sports injuries
Nicholas J. Emerson
a*, Matt J. Carré
a, Gwendolen C. Reilly
b, Amaka C. Offiah
caDept. of Mechanical Engineering, University of Sheffield, Mappin Street, Sheffield, S1 3JD, UK bDept. of Engineering Materials, Kroto Research Institute, University of Sheffield, Broad Lane, Sheffield, S3 7HQ, UK
cAcademic Unit of Child Health, Sheffield Children's NHS Foundation Trust, Western Bank, Sheffield, S10 2TH, UK
Received 19 March 2011; revised 13 May 2011; accepted 15 May 2011
Abstract
Development of Finite Element (FE) modelling techniques has allowed the creation of 3D models based upon high resolution Computed Tomography (CT) images, which have been used to assess the mechanical properties of bone, fixation techniques, and the performance of bone micro-architecture. In this study, a semi-automated process for converting CT data into FE models has been used to investigate if the automated geometry and material properties mapping of mid-shaft cortical bone. In order to develop the process, a porcine femoral specimen was imaged with a spiral CT scanner, allowing the semi-automated creation of a 3D FE model. Inhomogeneous material properties were mapped using the Bonemat algorithm which allows automated adjustment of values from CT data. The 3D model was cropped at the start of each metaphyseal region to isolate the mid-shaft region for testing. Hand calculation of the mid-shaft was undertaken using a composite ellipse solution, which allowed the direction and magnitude of the maximum stresses, and the deflection occurring within the bone mid-shaft to be analysed with respect to the results obtained within the finite element testing. Predictions from the ellipse method correlated significantly well with the stress patterns and maximum deflections achieved within the 3D FE model, validating the modelling process for future testing. Using CT-derived FE analysis to determine failure mechanisms has great potential for use as a tool in fracture analysis. The increased geometrical accuracy has potential for use within Sports Injuries studies, where the inherent complexity of skeletal modelling and multi-factor loading conditions can often lead to errors in simplified solutions. Further understanding of failure mechanisms such as these can be used to influence the design of sports equipment and surfaces, helping to prevent sports injuries in the future.
© 2011 Published by Elsevier Ltd.
Selection and peer-review under responsibility of RMIT University
Keywords: Finite element; mechanical model; torsion; bone; porcine; femur
* Corresponding author. Tel.: +0114 227877; fax: +0114 227890. E-mail address: [email protected].
1877–7058 © 2011 Published by Elsevier Ltd. doi:10.1016/j.proeng.2011.05.108
Procedia Engineering 13 (2011) 422–427
Open access under CC BY-NC-ND license.
1.Introduction
Advances in modelling software and technology have allowed the development of geometrically accurate Finite Element (FE) models based upon high resolution three-dimensional Computed Tomography (CT) images [1]. The development of techniques has been under development for some time [2, 3] allowing significant improvement in the accuracy of modelling the construction and geometry of biological materials, in particular the reconstruction of bone. Along with the development of the technique as a research tool there has been a development in the technology used, to the extent that software is now being offered to increase the rate at which the 3D FE models can be created.
The developing accuracy of these techniques has allowed the models to be used to assess the mechanical properties of bone, the performance of its microarchitecture and even the effectiveness of treatments for bone fracture. Combining this level of geometrical accuracy with biomechanical and engineering data could be used to determine the causes of injury to athletes for a variety of situations.
2.Materials and Methods
2.1. Creation of the finite element model
Porcine Femur samples were selected for the testing process, as they offer a comparative construction and geometry to human femoral bones and are readily available, allowing good repeatability.
Four specimens were selected for CT scanning at Sheffield Children’s Hospital. The samples were individually scanned using a Lightspeed VCT CT scanner from GE Healthcare. A Calibration Phantom from Mindways was placed beneath each in order to allow comparative analysis (a Calibration Phantom is a device which includes a variety of media of known material properties which are used post-imaging to calibrate the CT data with respect to material density, and consequently used to derive the material properties of the imaged tissues).
The 3D FE model used in this paper were generated using Simpleware’s Scan IP software, which enables the segmentation and meshing of CT data ready for exportation into a finite element package. The CT data is used as a slice-by-slice source image, onto which a mask is placed corresponding with the location of pixels indicating bone material, as defined by the appropriate grey-scale value and determined by the calibration Phantom. These individually sliced masks are then amalgamated into one three-dimensional shape, which is then smoothed to minimise the occurrence of inaccurate geometry on the boundary between mask slices. Creating a 3D image in this way allows for accurate mapping of both the internal and external surfaces of the bone. The Scan FE module of the software was then employed for mesh generation, following the exportation of material property markers.
In order to further understand the behaviour of the inhomogeneous material, and to increase the validity of the finite element solution, physical testing will be undertaken in the future. This testing will take the form of controlled torsional test of isolated femoral mid-shafts, providing accurate values for maximum deflection, maximum permissible torque, and surface stress.
2.2. Material properties
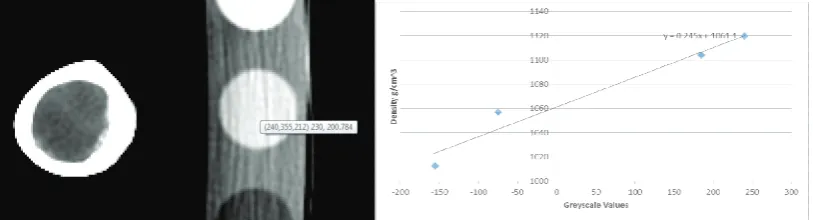
The grey-scale values used for the calculation are obtained from the source image used during the masking process, and can allow for the automated adjustment of material properties such as the mass density and the Young’s modulus of the material used within the model as shown in Figure 1. With the mid-shaft of the bone isolated from the metaphyseal regions during the testing procedures, it would be reasonable to assume that the majority of material under load would be cortical bone, however the algorithm was included to maximise accuracy and to test the procedure for future use.
Fig. 1. (a) Screen capture shows scanned bone sample and Calibration Phantom position with grey-scale values; (b) graph shows grey-scale to density relationship.
The calculation of the relationship between CT and Magnetic Resonance Imaging (MRI) and material properties has been under some investigation since the first use of the technique with subject-specific studies often providing a varied range of results [4, 5]. In this instance the equivalent water densities of known material samples from the calibration phantom were plotted against the grey-scale values obtained within the source image as shown in Figure 1.
2.3. Finite element model validation process
Validation and confirmation of the results of the FE test procedure was undertaken by comparing the outputs of the FE tests of the bones with calculations based upon a thin-walled composite ellipse solution. The testing procedure selected was that of a quasi-static torsional test to analyse torsional fractures of the bone mid-shaft. The ‘torsional’ test selected is not strictly pure torsion, but rather a ‘twist’ test, as described by Saunders et al. [6]. Within a pure ‘torsion’ test each end of the bone specimen should be equally rotated, whereas for this verification and modelling process one end of the model was constrained, whilst the ‘free end’ was rotated.
2.4. Hand calculation
Published research regarding the determination of stress within bones has shown a number of geometrical assumptions to simplify the loading cases for hand calculation [7, 8]. These range in complexity from simple beam theory of constant diameter cylinders to more involved assumptions involving mapping the geometry of a small number of slices using a Fourier series.
[image:3.561.44.451.156.266.2]with the results integrated to provide values for maximum stress, deflection and maximum permissible torque for the length of the entire bone sample.
3.Testing Procedure
3.1. Hand calculation loading parameters
The geometry of internal and external diameter of each of the 147 CT slices was recorded, and the second moment of area determined for each of these ‘slices’. The results of the slices were integrated to allow formation of results for the mid-shaft as a whole.
In order to accurately compare with the outputs of the 3D FE model, a range of parameters were tested within the hand calculation. This technique would take account of the simplification of the geometry, the varying material properties, and the effect of the boundary conditions within the FE model. The results of the hand calculation were therefore provided in the format of a range of figures, within which it was expected that the FE model would fall. The input parameters such were selected from published data with the shear modulus ranging from 2 to 4 GPa, and the applied torque from 50 Nm to 250 Nm.
Whilst there are limitations in the use of a homogenous hand calculation, the use of an integrated calculation technique mapping allows more accurate location of maximum stresses along the Z axis, and highlights regions in which maximum permissible torque is reduced. This is more desirable than an averaged solution where geometry-averaged results could mask weaker areas of the structure.
3.2. Computational loading
The testing procedure followed within the hand calculation assumption isolated the bone mid-shaft. This allowed the use of cylindrical ellipse solution and isolated the influence of the construction of the metaphyseal region and also joint and ligament connectivity. This geometry was replicated within the modelling process, where the two metaphyseal sections were again omitted. Once the Ansys input file was produced via the Scan IP software, it was loaded into the FE solver ready for analysis. With the material properties previously assigned using the Scan IP software and Bonemat algorithm, the mid-shaft model was fully constrained at one end and torsional force was applied at the other. Location and magnitude of maximum stress and maximum rotational deflection were noted.
Due to the complex geometry of the mid-shaft, application of torque was via the inclusion of opposing force couples. Adding point loads to nodes on the surface provides unwelcome local effects at the actuation site and as such, these areas were omitted from the results for surface stress. Values for surface stress were taken from the surface of the central mid-shaft, rather than the surface of ‘cut’ metaphyseal ends. The values of applied torque in the FE model matched those used within the hand calculation methodology, such that stresses could be compared directly.
4. Results
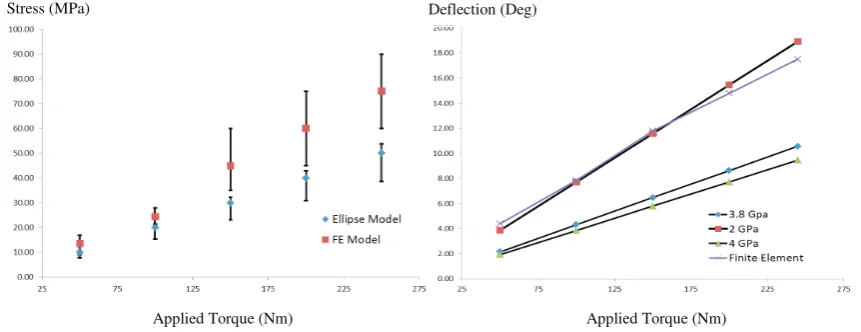
stress for the majority of the bone surface (> 65%) are shown below; the error bars represent an approximation of the maximum and minimum stresses noted in these regions on the FE model.
[image:5.561.55.486.141.307.2]The results for the ellipse model are taken from a central slice of the bone, plus and minus 12 mm from the centre point of the Z axis. Graphical values as shown in Figure 2 represent the average stress in this region, with error bars noting the maximum and minimum stresses located found.
Fig. 2. Graphs showing (a) deflection and (b) shear stress of the sample with varying torque and shear modulus.
Maximum rotation of the free end of the mid-shaft was predicted as between 3.9 and 18.9 degrees within the ellipse model for a shear modulus of 2 GPa, which correlates well with the results of the Ansys model, which showed deflections between 4.4 and 17.5 degrees.
5.Discussion
This study has been undertaken to replicate torsional fracture of bone mid-shaft. This is a complex injury, particularly in the Tibia and Fibula, and is prevalent in athletes. The injured bone can often require extensive fixation in order to repair appropriately. Whilst the general causes of this injury type are known, it is often difficult to determine the precise nature of bone injury, and this modelling technique has been developed in order to provide a more accurate method of injury analysis.
The results for shear stress of the ellipse and 3D FE models are provided in the form of a range of values, and are dependent on limiting factors such as the shear modulus which is automated in the FE model and inputted by hand in the ellipse calculation. Results obtained within the 3D FE model correlate well with the range obtained within the hand calculation methods, and were noted to be within 8% of the results for maximum deflection and within 30% of the value calculated for maximum stress. Whilst these are favourable results, the simplified ellipse model has limitations in its capability for predicting maximum surface stresses as a result of rapid geometry changes and this may account for the larger error noted here.
The use of laboratory based testing of the whole bone sample will help to better understand the behaviour of the inhomogeneous material under torsion, which will be used further validate the FE model results for surface stress as shown by Taylor et al. [9]. Meanwhile, it is also suggested that laboratory testing of sections of porcine femur be analysed in more detail, to accurately determine material parameters such as Shear modulus, which would then be inputted into the model to further refine the methodology.
Deflection (Deg)
Applied Torque (Nm) Stress (MPa)
The key aim of this body of research and the development of this technique is threefold; firstly the technique allows for better understanding of the causes of fracture via medical scanning after an incident; secondly, the technique may be used before fracture, to provide a more accurate assessment of potential injury as a result of equipment design; finally the increased accuracy in bone geometry and non-linear material property modelling allows for greater knowledge of the forces within the context of sportswear and equipment interaction with an athlete. This would be particularly useful in the design of protective apparel and footwear, in which the knowledge of transferred stresses to an athlete is of vital importance.
The ability to model complex geometry and estimate the effect of inhomogeneous material properties has a variety of uses within a sporting and athletic context.
6.Conclusion
A mechanical model based upon a thin-walled ellipse calculation has been proposed as a means to validate the results of a 3D FE model derived from CT image scans of a porcine femur. The model performed favourably, predicting maximum stress and deflection of the bone sample to be within the expected range determined by the ellipse methodology.
Further physical experimentation using a torsional rig within a controlled laboratory would improve the validation for the values of deflection and torque, whilst dissection and testing of samples of the bone could be used to validate the material properties used via the Bonemat algorithm.
An improved model incorporating the metaphyseal regions, and accounting for ligament and tissue connectivity would offer the opportunity to further enhance the accuracy of this modelling technique.
Acknowledgements
The authors gratefully acknowledge the EPSRC and Simpleware Ltd. for their assistance in this project.
References
[1] Keyak, J.H., et al., Validation of an automated method of three-dimensional finite element modelling of bone. Journal of Biomedical Engineering, 1993. 15(6): p. 505-509.
[2] Camacho, D.L.A., et al., An improved method for finite element mesh generation of geometrically complex structures with application to the skullbase. Journal of Biomechanics, 1997. 30(10): p. 1067-1070.
[3] Laib, A., et al., 3D micro-computed tomography of trabecular and cortical bone architecture with application to a rat model of immobilisation osteoporosis. Medical and Biological Engineering and Computing, 2000. 38(3): p. 326-332.
[4] Helgason, B., et al., Mathematical relationships between bone density and mechanical properties: A literature review. Clinical biomechanics (Bristol, Avon), 2008. 23(2): p. 135-146.
[5] Taddei, F., A. Pancanti, and M. Viceconti, An improved method for the automatic mapping of computed tomography numbers onto finite element models. Medical Engineering & Physics, 2004. 26(1): p. 61-69.
[6] Saunders, M.M., et al., Development of a cost-effective torsional unit for rodent long bone assessment. Medical Engineering & Physics, 2010. 32(7): p. 802-807.
[7] G A Arangio MD, D.X.P., E P Salathe PhD, Biomechanical study of stress in the fifth metatarsal. 1997. [8] Bunch, T.S.G.a.R.P., A mechanical model of metatarsal stress fracture during distance running. 1989.