ECHOCARDIOGRAPHIC EVALUATION OF LEFT VENTRICULAR SYSTOLIC AND DIASTOLIC DYSFUNCTION IN PATIENTS WITH
ACUTE MYOCARDIAL INFARCTION
submitted to
THE TAMIL NADU Dr. M.G.R. MEDICAL UNIVERSITY
CHENNAI
In partial fulfilment of the regulations
for the award of the degree of
M.D. BRANCH - I GENERAL MEDICINE
GOVT. STANLEY MEDICAL COLLEGE & HOSPITAL
THE TAMIL NADU Dr. M.G.R. MEDICAL UNIVERSITY
CHENNAI – TAMIL NADU
This is to certify that this dissertation entitled “ECHOCARDIOGRAPHIC EVALUATION OF LEFT VENTRICULAR SYSTOLIC AND DIASTOLIC DYSFUNCTION IN PATIENTS WITH ACUTE MYOCARDIAL INFARCTION” submitted by Dr. STALIN ROY .J, to the Tamil Nadu Dr.MGR Medical University is in partial fulfilment of the requirement for the award of M.D. DEGREE (BRANCH -1) and is a bonafide research work carried out by him under direct supervision and guidance.
Signature of the Unit Chief Dr. P. VIJAYARAGHAVAN M.D
Signature of the Professor and HOD Dr. S. MAGESHKUMAR M.D
Signature of the Dean
At the outset, I wish to thank our Dean Dr S. GEETHALAKSHMI M.D. Ph.D., for permitting me to use the facilities of Stanley Medical College and Government Stanley Hospital to conduct this study.
My beloved Head of the Department of Medicine, PROF. S. MAGESH KUMAR, M.D. has always guided me, by example and valuable words of advice and has always given me his moral support and encouragement throughout the conduct of the study and also during my post graduate course. I owe my sincere thanks to him.
I have great pleasure in expressing my deep sense of gratitude and respect for PROF. P. VIJAYARAGHAVAN, M.D., Additional Professor, Department of medicine and chief of medical unit III, Stanley Medical College and Hospital, Chennai, for approving this study and giving suggestions and guidance in preparing this dissertation.
My sincere thanks to the Professor and Head, Department of Cardiology, Dr. G. RAVISHANKAR M.D. D.M., for permitting to utilise the clinical material and the facilities in the Department of Cardiology and supporting me throughout my study.
I thank the postgraduates in cardiology, Dr.Sampath Kumar, Dr.Manoharan, for helping me out in the echocardiographic evaluation of my patients.
AMI Acute Myocardial Infarction
ASMI Antero Septal Myocardial Infarction
DD Diastolic Dysfunction
DT Deceleration Time
LVEF Left Ventricular Ejection Fraction
LVEDD Left Ventricular End Diastolic Diameter LVESD Left Ventricular End Systolic Diameter
IVCT Isovolumic Contraction Time
IPWMI Inferoposterior Wall Myocardial Infarction IWMI Inferior Wall Myocardial Infarction
LA Left Atrium
LVET Left Ventricular Ejection Time
MI Myocardial Infarction
MPI Myocardial Performance Index
RV Right Ventricle
RVMI Right Ventricular Myocardial Infarciton
RWMA Regional Wall Motion Analysis
RWMI Regional Wall Motion Scoring Index
TDI Tissue Doppler Imaging
1 INTRODUCTION 1
2 AIMS AND OBJECTIVES 3
3 REVIEW OF LITERATURE 4
4 MATERIALS AND METHODS 31
5 OBSERVATIONS AND DATA ANALYSIS 36
6 DISCUSSION 55
7 CONCLUSION 60
ANNEXURE
I BIBLIOGRAPHY
II ETHICAL COMMITTEE CERTIFICATE III APPENDIX I - PRO FORMA
INTRODUCTION
Acute Myocardial Infarction is one of the leading causes of death among men and women worldwide. Most of the early deaths are due to Ventricular Arrhythmias. These Arrhythmias are responsible for the sudden deaths associated with Myocardial Infarction. The late mortality associated with Myocardial Infarction is typically due to left ventricular dysfunction and its complications. Residual Left Ventricular function after Myocardial Infarction is an important prognostic marker.
Left Ventricular dysfunction can be systolic, diastolic or both. Echocardiography is the most widely used and readily available, non-invasive tool in the arsenal of cardiologist for evaluating the left ventricular function. Echocardiographic evaluation of Left Ventricular function is an integral part of evaluation of a patient with Acute Myocardial Infarction. Two – Dimensional echocardiography is useful for the assessment of systolic function, and Doppler Echocardiography is well suited for studies of diastolic function.
An acute Trans-mural Myocardial Infarction causes a loss of contractile fibres which reduces systolic function. Parallel to the effect on systolic function, a myocardial infarction also impacts diastolic function, as evidenced by the raise in left ventricular end diastolic pressure.
AIMS AND OBJECTIVES OF THE STUDY
1) To assess the prevalence of Left Ventricular Systolic and Diastolic dysfunction in patients with Acute Myocardial Infarction.
2) To study the association between Left Ventricular Systolic, Diastolic dysfunction and the variables such as Age, Sex, Smoking, Diabetes, Hypertension, Killip Class, Type of Myocardial Infarction.
REVIEW OF LITERATURE
Acute ST Elevation Myocardial Infarction – an overview
Despite the advances made in the diagnosis and management of ST Elevation Myocardial Infarction (STEMI), it continues to be a major public health problem in the industrialized world as well as in developing countries like India. [1] It has been estimated that the number of years of life lost because of an AMI is 15 years. The burden of Myocardial Infarction in developing countries is approaching those now afflicting developed countries. The scarcity of available resources to treat ST Elevation Myocardial Infarction (STEMI) in developing countries mandate major efforts on an international level to strengthen primary prevention programs.[2]
Historical phases in the evolution of coronary care
There have been several phases in the management of patients with STEMI. These phases have contributed to the gradual decline in mortality from STEMI.[7] In the first half of the 20th century, management of STEMI focussed on a detailed recording of physical and laboratory findings, with little active treatment for the infarction. This phase is known as the ―clinical observation phase‖ of coronary care. The ―coronary care unit phase‖ began in the mid-1960s and included detailed analysis and vigorous management of cardiac arrhythmias. The ―high-technology phase‖ began with the introduction of the pulmonary artery balloon flotation catheter. It helped in the bedside hemodynamic monitoring and more precise hemodynamic management of STEMI patients. The modern ―reperfusion era‖ of coronary care heralded the introduction of intracoronary and then intravenous fibrinolysis, increased use of aspirin, and the development of primary percutaneous coronary intervention. Contemporary care of patients with STEMI has entered an evidence-based coronary care phase where we are increasingly using standard guidelines and performance measures for clinical practice.[8]
activation, and vascular dysfunction. LV systolic dysfunction, its pathophysiology and prognosis after AMI have been extensively researched for several decades. Either clinical or radiographic evidence of heart failure has been found to be a powerful predictor of outcome in patients after AMI, in addition to depressed systolic function.[9] Pulmonary congestion after infarction has been attributed to raised LV filling pressures but it may be seen after what appears to be only minor myocardial damage.[10] The pathophysiological basis for raised filling pressures is incompletely understood but may involve impaired active relaxation of the myocardium and increased LV chamber stiffness. These abnormalities constitute what is known as diastolic dysfunction.
Definition and Clinical evaluation of patients with myocardial infarction
Acute Myocardial infarction (AMI) can be defined from a number of different perspectives related to clinical, electrocardiographic (ECG),biochemical and pathologic characteristics. The gold standard for diagnosing myocardial infarction has been the World Health Organization definition, [11] which requires any 2 of 3 criteria:
1. Ischemic symptoms,
Recently, a new definition that for the first time which includes elevated troponin levels have been published by the American College of Cardiology and the European Society of Cardiology published.
Clinical Features
incipient congestive heart failure or, alternatively, is an outgrowth of the patient's anxiety. Palpitations or syncope are quite uncommon, but a history of light-headedness or dizziness and presyncope often reflects the underlying vagotonia or bradyarrhythmias seen in inferior wall myocardial infarction. Ventricular tachycardia may produce syncope or an out-of-hospital arrest.
Although most of the patients have symptoms just described,these complaints may go unrecognized or may be erroneously labelledas another disease entity, such as peptic ulcer disease.Myocardial necrosis may also occur without symptoms; it maybe detected only by the Electrocardiogram, raised cardiac enzymes or other imaging studies.
Risk stratification of patients with Acute Myocardial Infarction
*
Has improved to approximately 60% with current therapy.
[image:15.595.126.475.80.250.2]Clinical classification of Myocardial Infarction [12]
The Joint Task Force of the European Society of Cardiology, American College of Cardiology Foundation, the American Heart Association, and the World Health Federation (ESC/ACCF/AHA/WHF) in 2007, has proposed the above clinical classification of myocardial infarction.
Echocardiography in Patients with Acute Myocardial Infarction
Echocardiography has several important roles, in patients with AMI:
(1) Diagnosis and exclusion of acute MI in patients with prolonged chest pain and non-diagnostic electrocardiographic findings;
(2) Estimation of the amount of myocardium at risk and final infarct size after reperfusion therapy;
(3) Evaluation of patients with unstable hemodynamic findings and detection of infarct complications;
(4) Evaluation of myocardial viability; and
(5) Risk stratification.
reperfusion. If the myocardium remains akinetic while being viable, dobutamine stress echocardiography is helpful to demonstrate its viability.[13,14]
Detection of Mechanical Complications of Acute Myocardial Infarction The mechanical complications of Myocardial Infarction can be life-threatening. Hence it is imperative that reliable and timely identification is critical for optimal management. In a patient with suspected mechanical complication or with unstable hemodynamics, Two-dimensional (2D) and Doppler echocardiography with colour flow imaging is generally the first imaging modality used. TEE (Transesophageal Echocardiogram) is of immense utility for patients in whom precordial echocardiography is not possible for various reasons. TEE can be used under the most difficult clinical situations, including in the critical care unit, in intubated patients and postoperative patients, and even during cardiopulmonary resuscitation.[15] Mechanical complication should be suspected when a critically ill or hemodynamically unstable patient has normal systolic function.
Evaluation of Systolic and Diastolic Function Systolic Functional Parameters
velocity of the mitral annulus, fractional shortening, strain, and regional wall motion analysis.
Left Ventricular Ejection Fraction
The most commonly used and universally accepted expression of global LV function is Left Ventricular Ejection Fraction (LVEF). Although LVEF has many limitations, including operator dependency, it is a strong predictor of clinical outcome in many cardiac conditions. LVEF is also used to select optimal management strategies. In clinical practice, LVEF is usually determined by visual assessment of two-dimensional echocardiographic images of the left ventricle. This method is reasonably reliable when it is performed by an experienced echocardiographer but varies widely among readers. Hence it is advisable that, LVEF should be measured more objectively whenever possible, using volumetric measurements as described by the following equation:
where LVEDV and LVESV are LV diastolic volume and end-systolic volume, respectively.
echocardiographic measurement of LV dimensions from the mid-ventricular level:
Where LVEDD and LVESD are end-diastolic diameter and end-systolic diameter, respectively.
This equation is actually calculates the percentage change in LV area, or fractional shortening of the LV short axis, which equals LVEF if the apical long-axis dimension remains the same from diastolic phase to systolic contraction. Since the apical long axis normally shortens 10% to 15% with systole, an apical correction factor is added on the basis of the contractility of the apex: 5% to 7% for normal to hyperdynamic apical contraction, 3% for hypokinetic contraction, and 0% for akinetic apex.
Fractional Shortening
Fractional shortening (FS) is the percentage change in LV dimensions with each LV contraction. This systolic function parameter is now rarely used for diagnosis or clinical decision making.
Stroke Volume
Stroke volume (SV) can be measured as the difference between LVEDV and LVESV obtained by the Simpson method or three-dimensional echocardiography. The difference will be equal to systolic volume across the LVOT (Left Ventricular Outflow Tract) if there is no valvular regurgitation. When there is mitral regurgitation (MR), regurgitant volume needs to be subtracted to obtain Stroke Volume across LVOT. The product of LVOT area and LVOT time-velocity integral also give the LVOT Stroke Volume.
Systolic Velocity of Myocardial Tissue or Mitral Annulus
Regional Wall Motion Scoring Index (RWMI)
Regional wall motion analysis is the most commonly used echocardiographic parameter to evaluate coronary artery disease. It is one of the most common uses of echocardiography.
From the parasternal, apical, and sometimes subcostal imaging windows, two-dimensional echocardiography can visualize all LV wall segments. For purposes of regional wall motion analysis, the ASE has recommended a 16-segment model or, optionally, a 17-16-segment model with an addition of the apical cap. The following numerical score is assigned to each wall segment on the basis of its contractile function as assessed visually:
1 = normal (>40% thickening with systole);
2 = hypokinesis (10% to 40% thickening);
3 = severe hypokinesis to akinesis (<10% thickening);
4 = dyskinesis; and
5 = aneurysm.
A normal left ventricle has a WMSI of 1, and the index increases as wall motion abnormalities become more severe. When two-dimensional echocardiography was performed simultaneously with sestamibi SPECT in patients with acute ST-segment MI (STEMI), the overall correlation between the WMSI and the perfusion defect was good. Patients with WMSI higher than 1.7 tend to have a perfusion defect greater than 20%. The correlation is usually better for patients with an anterior wall MI than for those with an inferior or lateral wall MI with a smaller infarct size. A small area of subendocardial ischemia may not demonstrate wall motion abnormality, but contrast echocardiography can demonstrate a rim of subendocardial perfusion defect.
Wall motion analysis can also be performed more objectively and conveniently by speckle tracking strain imaging. Moreover, Ishii and colleagues[18] elegantly demonstrated that diastolic relaxation of the ischemic myocardial segment remains abnormal long after resolution of the regional wall motion abnormality, and the diastolic relaxation abnormality can be detected by strain imaging.
Assessment of Diastolic Function
The transmitral pressure gradient or the relationship between LA and LV pressures is accurately reflected by mitral inflow Doppler velocities.[20] Diastolic filling is usually classified initially on the basis of the peak mitral flow velocity of the early rapid filling wave (E), peak velocity of the late filling wave caused by atrial contraction (A), E/A ratio, and deceleration time (DT), which is the time interval for the peak E velocity to reach zero baseline.
With myocardial relaxation, the LV cavity elongates, expands laterally, and rotates. The longitudinal motion of the mitral annulus has been shown to correlate with the rate of myocardial relaxation. The velocity of the mitral annulus can be recorded by TDI, which has become an essential part of evaluation of diastolic function by echocardiography.[21] Radial and circumferential function can also be assessed with speckle tracking strain imaging.[22]
Grading of Diastolic Dysfunction (or Diastolic Filling Pattern)
The grading of the diastolic filling pattern (or diastolic dysfunction) is based on several parameters.[24] In most (if not all) cardiac diseases, the initial diastolic abnormality is impaired relaxation. With further progression of disease and a mild to moderate increase in LA pressure, the mitral inflow velocity pattern appears similar to a normal filling pattern (pseudonormalized). With further decrease in LV compliance and increase in LA pressure, diastolic filling becomes restrictive. Most patients with restrictive filling are symptomatic and have a poor prognosis unless the restrictive filling can be reversed by treatment. However, restrictive filling may be irreversible and represent the end stage of diastolic heart failure. Therefore, diastolic dysfunction can be graded according to the diastolic filling pattern.[19]
Grade 1 (mild dysfunction) - impaired relaxation with normal filling pressure
Grade 2 (moderate dysfunction) - pseudonormalized mitral inflow pattern
Grade 3 (severe reversible dysfunction) - reversible restrictive (high filling pressure)
Grading of diastolic dysfunction by echocardiography[38]
filling pressure can still be elevated with grade 1 mitral inflow velocity pattern (E/A ratio <1.0 and DT >240 milliseconds). Because the reversibility of restrictive filling usually cannot be assessed at one clinical setting, grade 4 dysfunction was not used in the standard recommendations.[19]
Clinical Applications of Diastolic Function Assessment
Assessment of diastolic function echocardiographically has the following clinical applications and should be an integral part of an echocardiography examination.
1. Estimation of filling pressures at rest and with exercise:-
In patients with reduced LV systolic function (LVEF <35%), mitral inflow E/A ratio of 1.5 or higher and DT of 140 milliseconds or higher indicate increased filling pressures. However, these parameters do not have a good correlation with filling pressure in patients with normal LVEF and diastolic heart failure. For all degrees of LVEF, E/e′ is the best parameter to estimate filling pressure; pulmonary capillary wedge pressure (PCWP) is 20 mm Hg or more if E/e′ is 15 or higher, and PCWP is normal if E/e′ is less than 8.[19]
exertion, causing exertional dyspnea. It is feasible and reliable to estimate PCWP with exercise by recording mitral inflow and annulus velocity. In a normal population with normal diastolic function, filling pressure rarely increases with exercise. Diastolic dysfunction (or impaired myocardial relaxation) is usually a prerequisite for development of exercise-induced high filling pressure. These patients increase cardiac output at the expense of increased filling pressure. In this situation, mitral E velocity increases while annulus Ea velocity does not increase as much or at all, resulting in an increase in E/e′ ratio. E/e′ correlates well with simultaneously measured PCWP with exercise as well as during resting stage, and a ratio higher than 15 indicates PCWP greater than 20 mm Hg with exercise.[25]
2. Diagnosis of cardiomyopathies, and constrictive pericarditis:-
3. Prognosis:-
Diastolic echocardiographic parameters, E, E/A, DT, E/e′, and LA volume, have been found to be powerful prognostic indicators for various conditions.[28,29] Even in asymptomatic patients, the presence of diastolic dysfunction portends a poor clinical outcome.
Although diastolic filling is affected by various factors, the direction of its change or progression is predictable in patients with known heart disease. Therefore, assessment of the diastolic filling pattern allows LV filling pressures and LV compliance and relaxation to be estimated and understood so that optimal treatment strategies can be offered to symptomatic patients with diastolic dysfunction.
Evaluation of Cardiac Function by Cardiac Time Intervals
derived by Weissler and colleagues, which was less heart rate dependent as a measure of LV systolic function. Because LV dysfunction also affects IVRT is also affected, Mancini and colleagues incorporated IVRT into an index called the isovolumic index, derived as (IVCT + IVRT)/LVET. The sum of IVCT and IVRT was measured by subtracting LVET from the peak of the R wave on the electrocardiogram to the onset of mitral valve opening. The isovolumic index was considered more sensitive for cardiac dysfunction than the systolic time interval because it contains IVRT as well as IVCT. However, the interval from the R wave peak to the onset of mitral valve opening contains an interval of electromechanical delay, which can be pronounced in patients with left bundle branch block. With the advent of Doppler echocardiography, it has become easier to determine cardiac time intervals more reliably. Tei and colleagues proposed an index of myocardial performance with Doppler echocardiography (IMP or Tei index) that is independent of the electromechanical delay, (IVCT + IVRT)/LVET, and can be used to identify the exact onset of isovolumic contraction.[29]
myocardial relaxation is normal, the opening of the mitral valve is initiated by rapid suction of the left ventricle; hence, the onset of mitral valve opening is close to the onset of early diastolic movement (or velocity) of the mitral annulus.[32] However, if myocardial relaxation is delayed, the mitral valve opens by high LA pressure. Therefore, the onset of diastolic motion of the mitral annulus follows the onset of mitral inflow. The time interval has been correlated with the degree of impairment in myocardial relaxation and LV filling pressure. With worsening of diastolic function, the time interval lengthens.
Echocardiographic indices to assess the prognosis following Acute Myocardial Infarction
Doppler echocardiographic assessment of hemodynamics in the acute setting of AMI provides independent, rapid, feasible, and simple non-invasive method of assessing the prognostic factors. This is particularly true in the subgroup of patients who have evidence of elevated LV filling pressures despite relatively preserved systolic function.
failure.[33,34,35] Therefore, it is reasonable to predict that patients with a high WMSI have a greater chance for subsequent development of cardiac events. Most patients with Killip class II-IV heart failure after acute Myocardial Infarction have a WMSI of 1.7 or higher. In addition to the WMSI, restrictive Doppler filling variables derived from mitral inflow velocities correlate well with the incidence of postinfarction heart failure and LV filling pressures.[36,37] The E/e′ ratio, a reliable parameter to estimate PCWP, was found to be a strong predictor for long-term outcome after acute Myocardial Infarction.[36] LA volume, a surrogate for chronic diastolic dysfunction and chronic elevation of LA pressure, was also a strong predictor of outcome.[38] Stress echocardiography is sensitive in detecting residual ischemia, myocardial viability, and multivessel disease soon after Myocardial Infarction[39]. Often, however, patients are unable to exercise adequately soon after an acute Myocardial Infarction, and the myocardium may remain akinetic for a period of days to weeks after successful reperfusion of the occluded coronary artery. Demonstration of viability by augmentation of contractility (with dobutamine echocardiography) or demonstration of perfusion (with contrast echocardiography) predicts functional recovery
MATERIALS AND METHODS
Individuals who were admitted for acute Myocardial Infarction in the Intensive Coronary Care Unit, Department of Cardiology, Govt. Stanley Hospital from April 2011 to September 2011 were evaluated in this study. Their Left Ventricular Systolic and Diastolic function was assessed by 2D Doppler Echocardiography within 48 hours of admission.
Left Ventricular Ejection Fraction – the most well accepted expression of systolic Left Ventricular function is measured with the help of 2D echocardiography.
Regional Wall Motion Abnormalities are also assessed and graded as:
1 Normal
2 Hypokinesia
3 Severe Hypokinesia -akinesia
4 Dyskinesia
5 Aneurysm
On the basis of this wall motion analysis scheme, a wall motion score index (WMSI) is calculated to semiquantitate the extent of regional wall motion abnormalities:
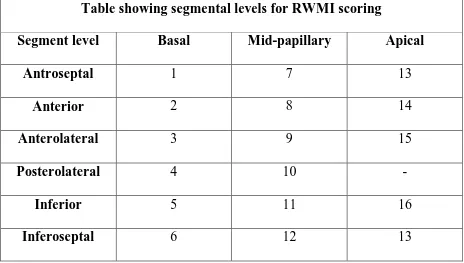
A normal left ventricle has a WMSI of 1, and the index increases as wall motion abnormalities become more severe. For purposes of regional wall motion analysis, the ASE has recommended a 16-segment model. Segments are visualised from the parasternal, apical, and subcostal imaging windows. The segments are labelled at three levels – Apical, mid-papillary, Basal. The levels are depicted below:
Table showing segmental levels for RWMI scoring
Segment level Basal Mid-papillary Apical
Antroseptal 1 7 13
Anterior 2 8 14
Anterolateral 3 9 15
Posterolateral 4 10 -
Inferior 5 11 16
Inferoseptal 6 12 13
Diastolic function is assessed by measuring the Trans-Mitral pressure gradients using Doppler Echocardiography.
Diastolic dysfunction is graded according to the filling pattern into:
Grade I – impaired relaxation with normal filling pressures
Grade III – reversible restrictive pattern
Grade IV – irreversible restrictive pattern
The systolic and diastolic dysfunction assessed by the above methods is correlated with other variables such as Age, Sex, Smoking, Type of Myocardial Infarction, Killip class.
Killip Classification:
Class I – no signs of heart failure,
Class II – crackles in lower lung fields and S3,
Class III – acute pulmonary edema,
Class IV – cardiogenic shock).
Patients were observed during daily in-hospital evolution, after receiving conventional clinical therapy (with betablockers and angiotensin converting enzyme inhibitors). All patients received reperfusion therapy by streptokinase as per standard guidelines.
INCLUSION CRITERIA
- Patients of both sex, aged between 30 and 60 with Acute Myocardial Infarction (STEMI) who are admitted in the Intensive Coronary Care Unit.
- Patients undergoing thrombolysis using streptokinase.
EXCLUSION CRITERIA
- Patients with Non ST elevation myocardial infarction.
- Patients who have contraindications for thrombolysis.
- Patients with previous history of myocardial infarction.
- Patients with complete heart block.
- Patients with atrial fibrillation.
- Patients with prior history of heart failure symptoms.
- Patients with valvular heart disease.
- Patients with cardiomyopathies.
Statistical analysis
OBSERVATIONS AND DATA ANALYSIS
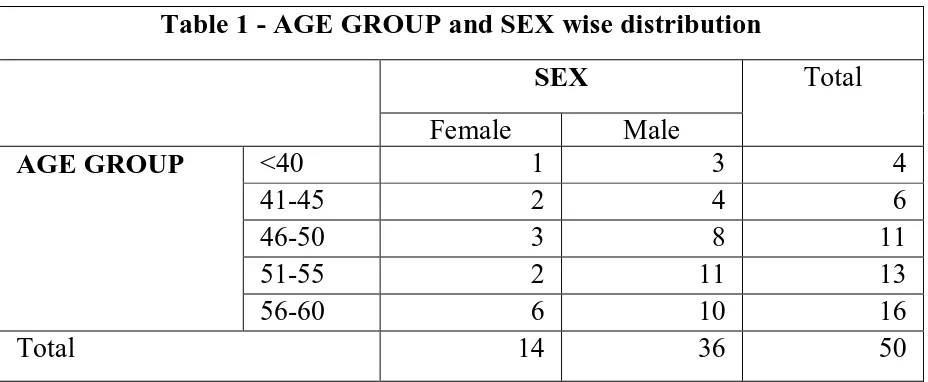
All the 50 patients included in the study presented with isolated acute ST elevation Myocardial Infarction. All the patients had regional wall motion abnormalities in their Echocardiogram and underwent thrombolysis. The study group included 36 males and 14 females. The difference in sex wise distribution is obvious, as only patients between the age of 30 and 60 were included in the study and in this age group STEMI is more common in males.
[image:42.595.67.531.524.715.2]The age wise distribution chart shows that the incidence of STEMI increases as the age advances. It is also seen that the maximum number of female patients are in the 56-60 group, implying that the risk for MI increases during the post menopausal period.
Table 1 - AGE GROUP and SEX wise distribution
SEX Total
Female Male
AGE GROUP <40 1 3 4
41-45 2 4 6
46-50 3 8 11
51-55 2 11 13
56-60 6 10 16
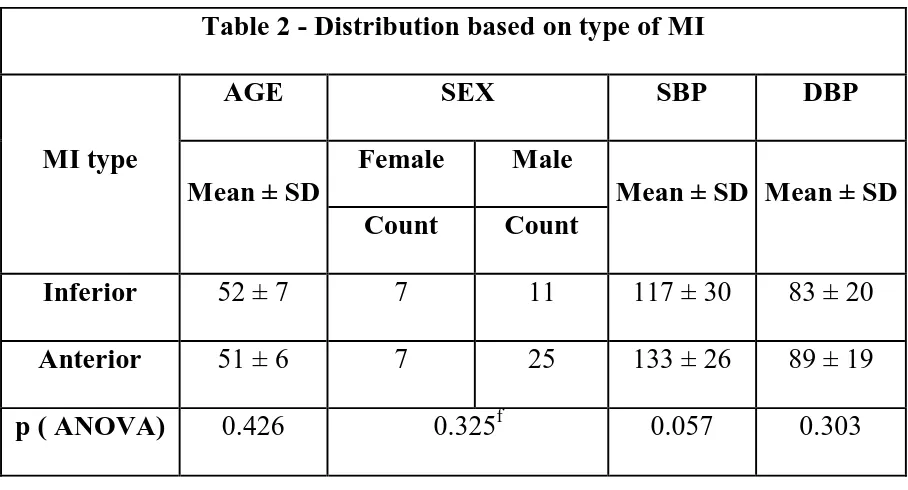
Table 2 compares the MI location with age, sex and admission blood pressure. There was no significant difference in age or sex wise distribution between the two groups mean age in the Anterior MI group was 51 years compared to a mean age of 52 in the Inferior MI group. Males had higher incidence of Anterior MI compared to females in whom the incidence of anterior and inferior was same. However the difference was not statistically significant when compare with a fisher exact test (p=0.325f). The mean systolic blood pressure was higher in the Anterior MI group (133 ± 26 vs 117 ± 30) however the difference did not reach statistical significance (p>0.05). The diastolic blood pressure was not much different (83mmHgcompared with 89mmHg) in both the groups (p>0.05).
Table 2 - Distribution based on type of MI
MI type
AGE SEX SBP DBP
Mean ± SD
Female Male
Mean ± SD Mean ± SD Count Count
Inferior 52 ± 7 7 11 117 ± 30 83 ± 20 Anterior 51 ± 6 7 25 133 ± 26 89 ± 19
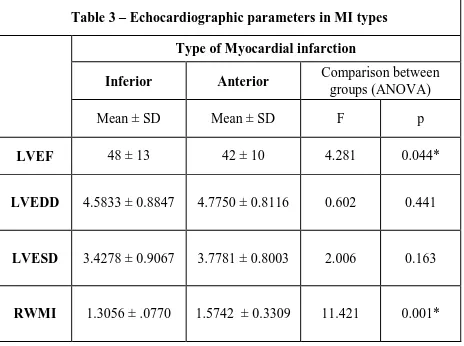
Table 3 – Echocardiographic parameters in MI types Type of Myocardial infarction
Inferior Anterior Comparison between groups (ANOVA)
Mean ± SD Mean ± SD F p
LVEF 48 ± 13 42 ± 10 4.281 0.044*
LVEDD 4.5833 ± 0.8847 4.7750 ± 0.8116 0.602 0.441
LVESD 3.4278 ± 0.9067 3.7781 ± 0.8003 2.006 0.163
RWMI 1.3056 ± .0770 1.5742 ± 0.3309 11.421 0.001*
was statistically significant (p<0.05) and can be explained by the difference in infarct dimensions among the groups.
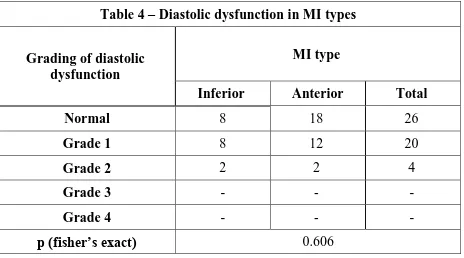
Table 4 – Diastolic dysfunction in MI types
Grading of diastolic dysfunction
MI type
Inferior Anterior Total
Normal 8 18 26
Grade 1 8 12 20
Grade 2 2 2 4
Grade 3 - - -
Grade 4 - - -
p (fisher’s exact) 0.606
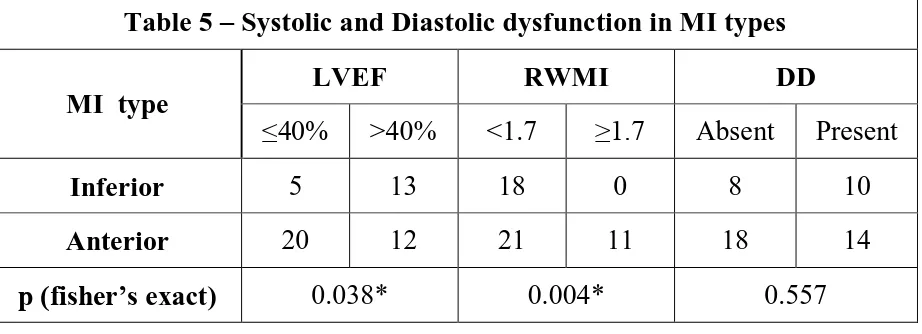
Table 5 – Systolic and Diastolic dysfunction in MI types
MI type
LVEF RWMI DD
≤40% >40% <1.7 ≥1.7 Absent Present
Inferior 5 13 18 0 8 10
Anterior 20 12 21 11 18 14
[image:46.595.70.531.75.242.2]p (fisher’s exact) 0.038* 0.004* 0.557
Table 6 – Systolic and Diastolic dysfunction in males and females
Sex
LVEF RWMI DD
≤40% >40% <1.7 ≥1.7 Absent Present
Female 4 10 12 2 10 4
Male 21 15 27 9 16 20
p (fisher’s exact) 0.114 0.481 0.119
[image:46.595.62.533.317.488.2]Table 6 shows the sex wise distribution of echocardiographic indices. There was no significant difference between the sexes.
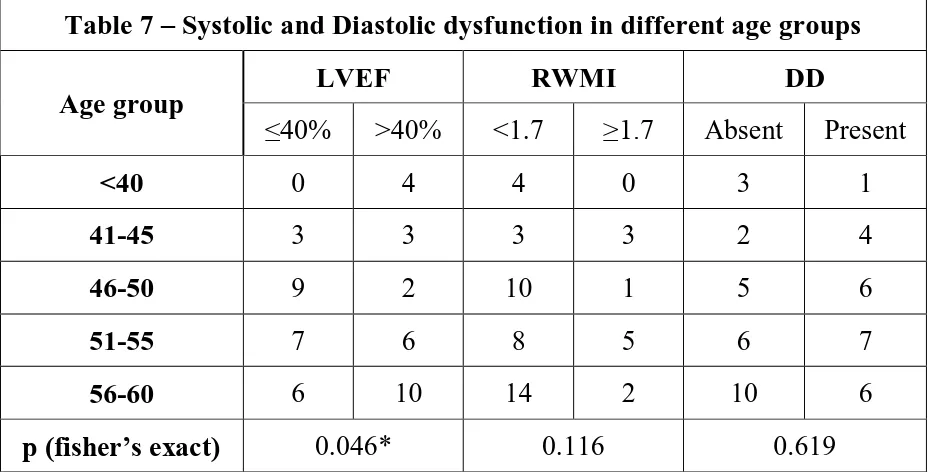
Table 7 – Systolic and Diastolic dysfunction in different age groups
Age group
LVEF RWMI DD
≤40% >40% <1.7 ≥1.7 Absent Present
<40 0 4 4 0 3 1
41-45 3 3 3 3 2 4
46-50 9 2 10 1 5 6
51-55 7 6 8 5 6 7
56-60 6 10 14 2 10 6
p (fisher’s exact) 0.046* 0.116 0.619
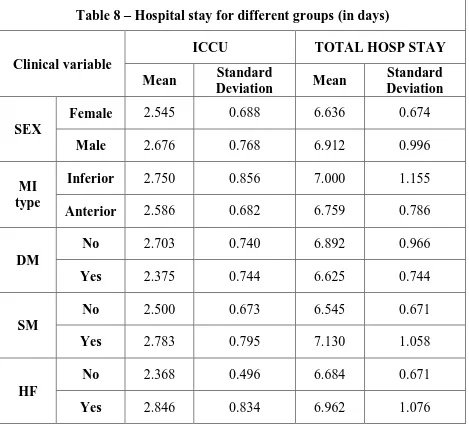
Table 8 – Hospital stay for different groups (in days)
Clinical variable
ICCU TOTAL HOSP STAY
Mean Standard
Deviation Mean
Standard Deviation
SEX
Female 2.545 0.688 6.636 0.674
Male 2.676 0.768 6.912 0.996
MI type
Inferior 2.750 0.856 7.000 1.155
Anterior 2.586 0.682 6.759 0.786
DM
No 2.703 0.740 6.892 0.966
Yes 2.375 0.744 6.625 0.744
SM
No 2.500 0.673 6.545 0.671
Yes 2.783 0.795 7.130 1.058
HF
No 2.368 0.496 6.684 0.671
Yes 2.846 0.834 6.962 1.076
Analysis of early in hospital congestive heart failure in AMI patients:
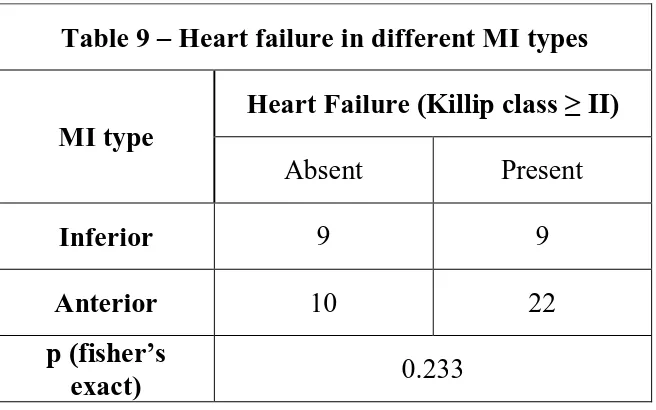
All the 50 patients were monitored for development of early in-hospital congestive heart failure (defined as Killip class ≥ II). The highest class during the hospital stay was considered for analysis.
[image:49.595.135.463.275.480.2]
Table 9 – Heart failure in different MI types
MI type
Heart Failure (Killip class ≥ II)
Absent Present
Inferior 9 9
Anterior 10 22
p (fisher’s
exact) 0.233
Table 10 – Heart failure in different age groups
Sex
Heart Failure (Killip class ≥ II)
Absent Present
<40 3 1
41-45 3 3
46-50 4 7
51-55 3 10
56-60 6 10
p (fisher’s
exact) 0.425
Table 11 – Heart failure in different sex groups
Sex
Heart Failure (Killip class ≥ II)
Absent Present
Male 11 25
Female 8 6
p (fisher’s
exact) 0.110
Table 12 – Baseline Clinical variables in Heart failure groups
Clinical variables
Heart Failure (Killip class ≥ II)
P value Absent (n=19) Present (n=31)
Age (years) 50.16 ± 6.98 52.29 ± 5.23 0.336 Systemic Hypertension 6 (50%) 6 (50%) 0.496 Admission SBP 136.32 ± 29.10 121.55 ± 26.38 0.143 Admission DBP 90.53 ± 16.82 83.87 ± 20.11 0.347 Diabetes Mellitus 1 (8.3%) 11 (91.7%) 0.018*
Smoking 6 (24%) 19 (74%) 0.079
Hyperlipidemia 4 (33.3%) 8 (66.7%) 0.490
No. of days in ICCU 2.37 ± 0.50 2.85 ± 0.83 0.046* Total no. of days in hospital 6.68 ± 0.67 6.96 ± 1.08 0.514
difference was not statistically significant (p>0.05). The mean diastolic blood pressure was also marginally higher (90.53 vs 83.87) in the normal group.
Table 13 – Echocardiographic variables in heart Failure groups
Echocardiographic Variables
No Heart Failure (n=19)
Heart Failure
(n=31) P value (Mann- Whitney)
Mean SD Mean SD
LVEDD 4.28 0.72 4.96 0.80 0.003*
LVESD 3.10 0.69 3.99 0.76 <.001* LVEF 52.53 9.61 38.81 8.53 <.001*
RWMI 1.38 0.25 1.53 0.31 0.038*
Table 13 depicts the various echocardiographic parameters in the two groups. The mean Left ventricular end diastolic diameter was higher in the heart failure group with mean 4.96 ± 0.8 cm compared to the patients without heart failure who had a mean of 4.28 ± 0.72 cm. The difference was statistically significant when compared using the Mann Whitney u test (p<0.05).
Again the difference was statistically significant with a p <0.05. LV Ejection Fraction the main parameter for assessing systolic function was lower in the heart failure group 38.81 ± 8.53 vs 52.53 ± 9.61. The difference was highly significant statistically (p <0.001). The regional wall motion scoring index also was higher in the heart failure group as expected. The mean in the heart failure group was 1.53 ± 31 compared with the mean of 1.38 ± 0.25 in the normal group. The difference was statistically significant (p<0.05). From this table we can conclude that the echocardiographic parameters are significantly abnormal in the heart failure group compared with the normal group. Among the echocardiographic parameters the LV ejection fraction had the most significant difference between the groups.
Table 14 – Diastolic dysfunction in Heart failure groups
Grading of diastolic dysfunction
Heart failure
Absent Present Total
Normal 15 11 26
Grade 1 3 17 20
Grade 2 1 3 4
Grade 3 - - -
Grade 4 - - -
Table 14 shows the distribution of diastolic dysfunction between the normal and heart failure groups. 24 out of 50 patients (48%) had diastolic dysfunction as assessed by Doppler Echocardiography. 20 patients with heart failure had diastolic dysfunction, whereas only 4 without heart failure symptoms had diastolic dysfunction by echocardiography. This difference was statistically significant (with p<0.05). Out of the 24 patients with Diastolic dysfunction 20 had Grade I diastolic dysfunction and 4 had Grade II diastolic dysfunction. Among the 4 patients with Grade II diastolic dysfunction 3 had signs of heart failure. Hence it appears that diastolic dysfunction as detected by echocardiography has a significant relationship with heart failure.
Table 15 – ROC curves for LVEF and RWMI Variable Area under curve
(AUC)
Standard error
95% confidence
interval p
Table 16 – Cut off values based on ROC curves for LVEF and RWMI
Variable Sensitivity Specificity PPV NPV
LVEF ≤ 40 74.2 89.5 92.0 68.0
RWMI ≥ 1.7 20.5 94.7 86.3 42.2
Table 15 shows the ROC (Receiver Operating Characteristics) curve parameters. The ROC curve was plotted to assess the predictive (diagnostic ability of the Echocardiographic parameters in detecting heart failure).
LV Ejection Fraction had an AUC (area under the curve) of 0.862 which denotes that the LVEF has very high diagnostic accuracy in predicting heart failure (p value of <0.0001).
Wall motion scoring index had an AUC of 0.671 with a p value of <0.05 also had good ability to detect heart failure but not to the extent of LV Ejection Fraction.
Table 17 – Univariate Regression analysis for determining variables associated with early Heart Failure
Variable Odds ratio Regression coefficient
Standard
error P
Age 1.063 0.061 0.050 0.222
Sex 3.030 1.109 0.650 0.088
MI type 2.200 0.788 0.606 0.193
SBP 0.980 -0.020 0.012 0.084
DM 9.900 2.293 1.094 0.036*
SM 3.431 1.233 0.616 0.045*
LVEF ≤ 40 24.437 3.196 0.853 <0.001*
RWMI ≤ 1.7 8.571 2.148 1.097 0.049*
DD 6.818 1.920 0.676 0.005*
Among the Echocardiographic parameters LV Ejection Fraction <40 had the strongest predicting ability with an odds ratio of 24 which was statistically highly significant (p<0.001). Wall motion scoring index and diastolic dysfunction also had good ability to predict heart failure with an odds ratio of 9 and 7 respectively (p value <0.05).
Table 18 – Multivariate Logistic regression
Variable Odds ratio Regression Coefficient Standard error p
LVEF ≤ 40 14.386 2.666 0.915 0.004*
DD 5.738 1.747 0.829 0.035*
RWMI ≥ 1.7 4.862 1.581 1.514 0.218
Constant 0.212 -1.552 0.608 0.011*
failure was 14.38 ie a patient with a LVEF of less than 40% is 14 times more likely to develop heart failure symptoms than a patient with LVEF >40. The corrected odds ratio for Diastolic Dysfunction was 5.74, and it was statistically significant with a p value of 0.035.
However the Regional Wall Motion Scoring Index though had a higher odds associating it with heart failure, it was not statistically significant within the model. This paradox is likely due to the fact that LV ejection fraction and Wall Motion Scoring are highly inter-dependent variables. When both of them are included in the model it becomes superfluous. Further when we look at the univariate analysis the correlation between LV Ejection Fraction and heart failure is better than that between Regional Wall Motion Scoring Index and heart failure. This could be because of the complex and operator dependent nature of the index.
All the clinical and echocardiographic variables couldn’t be analysed in the same Multivariate Logistic Regression model, making it less robust as the sample size was small and the number of variables to sample ratio should be maintained more than at least 1:10 or preferably 1:20. So only the three main echocardiographic variables were included in the regression model.
36
14
Male
0 20 40 60 80 100 120
Inferior
Anterior
52
51
117
83
89
M
E
AN
Distribution based on type of MI
1 10
LVEF
LVEDD
LVESD
RWMI 48
4.583
3.42
1.305 42
4.775
3.77
1.574
IWMI
AWMI
1 10 100
LVEF
LVEDD
LVESD
RWMI
48
4.583
3.42
1.305 42
4.775
3.77
1.574
M
EA
N
ECHO parameters
ROC curve showing the diagnostic performance of LVEF
0 20 40 60 80 100
0 20 40 60 80 100
100-Specificity
S
e
n
s
it
iv
it
y
ROC curve showing the diagnostic performance of RWMI
0 20 40 60 80 100
0 20 40 60 80
100-Specificity
S
e
n
s
it
iv
it
y
DISCUSSION
Fifty patients with first Acute Myocardial Infarction were evaluated in the study. The study mainly focuses on the echocardiographic evaluation of patients with AMI and identification of left ventricular systolic and diastolic dysfunction in them.
In our study 50% (n=25) of the patients had systolic dysfunction (LV ejection fraction <40%). As patients with previous MI, heart failure symptoms or valvular heart disease have been excluded, the systolic dysfunction can be predominantly attributed to the index coronary event. In a similar Portuguese study by PS Mateus et al,[41] 56% had LV systolic dysfunction (they had used LEVF cut-off of 45%). The TRACE trial[42] had a more stringent cut off (LVEF<35%) and found that 40% had Systolic dysfunction. In a Kosovo study by Kocinaj D et al[43] 48% of patients with first AMI had LV systolic dysfunction. Our study results were comparable with other similar studies with similar cut-off for detecting LV systolic dysfunction.
identify patients with diastolic dysfunction. Our study which graded diastolic dysfunction based on the ASE/EAE guidelines[46] pegged the incidence of diastolic dysfunction at 48% following AMI, which was midway between the extreme ranges reported in other studies.
The age, sex wise distribution of systolic and diastolic dysfunction was not statistically significant. Systolic dysfunction was found more frequently in patients with Anterior MI compared with inferior MI. Many studies in the past had similar results comparing the site of infarction with LV ejection fraction. In the study by Mc Clements BM et al,[47] the LV ejection fraction was 8% lower for anterior compared with inferior MI.
The Regional wall motion scoring index was significantly higher in the Anterior MI group. The same has been shown in other similar studies by McClements BM et al, [47] Souza et al.[42]
Acute Myocardial Infarction trial (VALIANT) trial[48] showed an incidence of 23.1 at admission, with a higher number being discharged with a diuretic.
In our study only LVEF and presence of DD were strong independent predictors for the development of early CHF following AMI. In the Souza et al[42] study only LVEF (<45%) was a statistically significant echocardiographic index for predicting early CHF. Wall motion scoring index, when adjusted for age also was a good predictor. However in our study wall motion scoring index though correlated well in the univariate analysis did not reach statistical significance in the multivariate regression analysis. In the above study they also correlated Myocardial Performance Index (MPI) with heart failure. However even though MPI is a global myocardial performance index including both systolic and diastolic echocardiographic indices, it did not significantly correlate with development of heart failure symptoms.
Lavine[49] in a retrospective study also found that LVEF was superior to other indices in predicting development of heart failure in patients without any clinical evidence of CHF at admission during the first 15 days of admission following AMI.In the study by schwammenthal et al.[50] also reported a LVEF ≤ 0.40 as a powerful and independent predictor of poor outcome
Wall motion analysis is a complex and highly subjective quantification index with a high degree inter-observer variation. In comparison LVEF is an easily measurable echocardiographic index and is easily reproducible, thereby the errors in LVEF estimation are vey less. Similar findings were obtained in studies by Yuvasa et al [51] and DeMichele. [52]
Similar to many other studies like Souza et al, Diabetes and Smoking were predictors of early in hospital heart failure in the univariate analysis. Further studies are needed with larger study population to assess the interdependence of clinical and echocardiographic parameters.
Limitations of the study
Though extremes of age were excluded in the study to minimise the influence of age on diastolic dysfunction, the study group included a sizeable number of diabetics and hypertensives who might have pre-existing diastolic dysfunction, which might confound the results.
We couldn’t analyse all the clinical and echocardiographic variables simultaneously in the multivariate logistic regression as the study group was small and the variable to population ratio (1:10) would exceed the guidelines.
The recent global indices of systolic and diastolic function like the MPI were not included for analysis.
The individual diastolic parameters such as E/A ration, DT were not compared with heart failure.
CONCLUSIONS
In this study population of 50 patients with first AMI and without previous heart failure symptoms, the incidence of early in-hospital congestive heart failure was 62% (n=31).
48% of the patients with first AMI had diastolic dysfunction.
50% of patients had systolic dysfunction (defined as ejection fraction of ≤ 40%).
22% of patients had a Regional Wall Motion Scoring Index of ≥1.7.
Left ventricular ejection fraction was the most important predictor of early heart failure (p=0.004).
The cut off ≤ 40% of LVEF had a high predictive value (74% sensitivity 90% specificity) in detecting patients who are likely to develop heart failure symptoms.
Presence of Diastolic dysfunction also predicted early heart failure following AMI accurately (p=0.035).
Regional Wall Motion Index was inferior compared to LVEF and presence of DD in predicting heart failure (p=0.218).
Smokers were more likely to develop early in-hospital heart failure following AMI (p=0.045).
1. TA Gaziano: Reducing the growing burden of cardiovascular disease in developing world. Health Aff 2007; 26:13.
2. F Cacciatore, Napoli C: Novel pathogenic insights in the primary prevention of cardiovascular disease. Prog Cardiovasc dis 2009; 51:503. 3. K Glatfelter, RJ Goldberg, Burbank-Schmidt E et al: Trends in
community mortality due to CHD. Am Heart J 2006; 151:501.
4. CD Adams, EM Antman, Anderson JL et al: ACC/AHA 2007 guidelines for the management of patients with UA/NSTEMI: Circulation 2007; 116:148.
5. D Lloyd-Jones, Carnethon M, Adams R, et al: Heart disease and stroke statistics—2009 update: A report from the AHA Statistics Committee and Stroke Statistics Subcommittee. Circulation 2009; 119:21.
6. DR Cragg, Bonema JD, Friedman HZ, et al. Outcome of patients with acute myocardial infarction who are ineligible for fibrinolytic therapy.
Ann Intern Med 1991; 115:173-177.
7. E. Braunwald, EM Antman: Evidence-based coronary care. Ann Intern Med 1997; 126:551.
experience with 250 patients. Am J Cardiol. 1967; 20: 457–464.
10.JE Moller, K Egstrup, B Brendorp, L Kober et al: CHF with preserved left ventricular systolic function after AMI: clinical and prognostic implications. Eur J Heart Fail. 2003; 5: 811–819.
11.Anonymous: "Nomenclature and criteria for diagnosis of ischemic heart disease. Report of the Joint International Society and Federation of Cardiology/WHO task force on standardization of clinical nomenclature".
Circulation 59 (3): 607–9.
12.K Thygesen, JP Bassand, JS Alpert, et al: Myocardial infarction redefined—a consensus document of The JESC/ACC for the redefinition of myocardial infarction. J Am Coll Cardiol 36 (3): 959–69.
13.Young-Soo Lee, et al: Relationship between Post-Systolic Motion duringDobutamine Stress Echocardiographyand Functional Recovery of Myocardium after Successful PCI. Korean Circ J. 2009 Nov; 39(11): 477–481.
14.SM Park, C Miyazaki et al: Feasibility of prediction of myocardial viability with DTI following PCI for ST elevation anterior myocardial infarction. J Am Soc Echocardiogr 2009; 22:183.
diseases. J Am Coll Cardiol 2007; 49:1903.
17.S Kaul et al: Incremental value of cardiac imaging in patients presenting to the emergency department with chest pain and without ST-segment elevation: Am Heart J 2004; 148:129.
18.K Ishii, T Suyama, M Imai, et al: Exercise-induced post-ischemic left ventricular delayed relaxation or diastolic stunning: Is it a reliable marker in detecting CAD?. J Am Coll Cardiol 2009; 53:698.
19.SF Nagueh, et al: Recommendations for the evaluation of left ventricular diastolic function by echocardiography. J Am Soc Echocardiogr 2009; 22:107.
20.MR Zile et al: Diastolic heart failure: Abnormalities in active relaxation and passive stiffness of the left ventricle. N Engl J Med 2004; 350:1953 21.M Kasner, P Steendijk, D Westermann, et al: Utility of Doppler
echocardiography and tissue Doppler imaging in the estimation of diastolic function in heart failure with normal ejection fraction.
Circulation 2007; 116:637.
22.F Knebel F et al: Evaluation of longitudinal and radial two-dimensional strain imaging versus DTI in predicting long-term response to cardiac CRT. J Am Soc Echocardiogr 2007; 20:335
comprehensive two-dimensional and Doppler echocardiography. J Am Coll Cardiol 2006; 47:500.
25.MI Burgess et al: Diastolic stress echocardiography: Hemodynamic validation and clinical significance of estimation of ventricular filling pressure with exercise. J Am Coll Cardiol 2006; 47:1891.
26.M Galderisi: Diastolic dysfunction and diabetic cardiomyopathy: Evaluation by Doppler echocardiography. J Am Coll Cardiol 2006; 48:1548.
27.DW Sohn, HS Kim, YJ Kim et al: Unique features of early diastolic mitral annulus velocity in constrictive pericarditis. J Am Soc Echocardiogr 2004; 17:222.
28.JE Moller, GS Hillis et al: Prognostic importance of diastolic function and filling pressure in patients with AMI. Circulation 2006; 114:438. 29.N Rahman, KA Kazmi, MJ Yousaf: Non-invasive prediction of ST
elevation myocardial infarction complications by left ventricular Tei index. Pak Med Assoc. 2009 Feb; 59(2):75-8.
30.KT Spencer et al: Age dependency of the Tei index of myocardial performance. J Am Soc Echocardiogr 2004; 17:350.
of M-mode and pulse Doppler methods. J Am Soc Echocardiogr 2004; 17:1259.
33.H Tanaka, K Tatsumi, H Kawai, et al: Improved regional myocardial diastolic function assessed by strain rate imaging in patients with CAD undergoing PCI. J Am Soc Echocardiogr 2006; 19:756.
34.F Bursi, , Jacobsen SJ et al: Mitral regurgitation after myocardial infarction: A review. Am J Med 2006; 119:103
35.SP Wong, AM Lydon et al: Relation of left ventricular sphericity to 10-year survival after AMI. Am J Cardiol 2004; 94:1270.
36.PA Grayburn, CP Appleton et al: The Beta-blocker Evaluation of Survival Trial (BEST) - Echocardiographic Substudy Investigators: Echocardiographic predictors of morbidity and mortality in patients with advanced heart failure. J Am Coll Cardiol 2005; 45:1064.
37.MA Quinones; HA Kopelen et al. Echocardiographic predictors of clinical outcome in patients with Left Ventricular Dysfunction enrolled in the SOLVD Registry and Trials: Significance of LVH. J Am Coll Cardiol 2000; 35:1237-44.
by strain Doppler echocardiography after coronary reperfusion. J Am Coll Cardiol 2007; 49:1715.
40.JE Møller, A Patrica et al: Prognostic Importance of Diastolic Function and Filling Pressure in Patients With AMI: Circulation 2006;114:438-444.
41. PS Mateus, CC Dias, L Santos et al. Left ventricular dysfunction after AMI--the impact of cardiovascular risk factors. Rev Port Cardiol. 2005;24(5):727-34.
42. Lars Køberet et al: A Clinical Trial of the ACEI- Trandolapril in Patients with Left Ventricular Dysfunction after MI. N Engl J Med 1995; 333:1670-1676.
43.D Koçinaj, M Gashi, A Bakalli: The impact of AMI on left ventricular systolic function. Med Arh. 2011; 65(4):207-9.
44.GA Whalley, GD Gamble: Restrictive diastolic filling predicts death after AMI: systematic review and meta-analysis of prospective studies. Heart.
2006; 92(11):1588-94.
diastolic function by echocardiography. J Am Soc Echocardiogr 2009; 22:107.
47.BM McClements, JB Newell, AE Weyman AE: Echocardiographic determinants of LVEF after AMI. Am Heart J. 2000 Aug;140(2):284-9. 48.MA Pfeffer, JJ McMurray, JL Rouleau, EJ Velazquez et al: Valsartan,
captopril, or both in myocardial infarction complicated by heart failure, left ventricular dysfunction, or both. N Engl J Med. 2003 Nov 13; 349(20):1893-906.
49.SJ Lavine: Prediction of heart failure post myocardial infarction: comparison of LVEF, transmitral filling parameters, and the MPI.
Echocardiography 2003, 20:691-701.
50.Schwammenthal E, Amichai K, Behar S, Adler Y, Feinberg MS, et al: Prognostic value of global myocardial performance indices in acute myocardial infarction: comparisons to measures of systolic and diastolic left ventricular function. Chest 2003, 124:1645-51.
51.T Yuasa, C Tei, K Yuge, T Matsuoka T et al: Non-invasive prediction of complications with acute ASMI by left ventricular Tei index. J Am Soc Echocardiogr 2005, 18:20-5.
S.no:
Date:
Name:
Age:
Sex:
Address:
Contact phone no:
Occupation:
Past history of Diabetes/ Hypertension:
Family history of Coronary Artery Disease:
Presenting complaints:
Killip Class:
ECG (Type of Myocardial Infarction, Probable site of coronary occlusion):
Routine investigations:
Random blood sugar:
Serum Creatinine in mg/dl:
Blood urea nitrogen in mg/dl:
ECHOCARDIOGRAPHY
Left Ventricular Ejection Fraction:
Regional Wall motion index:
Diastolic dysfunction grade:
Clinical monitoring for Cardiac Failure during hospital stay
Day 1 Day 2 Day 3 Day 4 Day 5 Day 6 Day 7 JVP
S3, S4
2 Anthony 28504 58 M IPWMI/RVMI 120 70 + + 1 2 8 A 4.7 3.1 60 1.25
3 Arunachalam 28778 57 M IPWMI/RVMI 160 100 + 1 3 6 A 5.6 4.2 48 1.25 1
4 Durgammal 31303 59 F IPWMI/RVMI 82 56 + + 4 D 5.8 4.9 29 1.375 1
5 Periyanthevan 31772 42 M AWMI 150 90 + + 2 2 8 A 6.6 5.3 38 1.75 1
6 Rathinam 31787 50 M IWMI/RVMI 84 60 + 4 5 10 A 5.1 4.2 32 1.25
7 Anthony 32621 54 M AWMI 140 100 + 1 3 7 A 3.4 2 68 1.25
8 Rani 32954 50 F ALMI 200 110 + 1 3 6 A 4 3 48 1.375
9 Sivaraj 33002 52 M AWMI 150 100 + + 1 4 6 A 5.1 4.2 35 1.375
10 Parvathy 33062 45 F IPWMI 210 140 + 1 2 7 A 3.4 2.2 64 1.375
11 Kasi 33159 52 M ASMI 130 90 + + 2 3 8 A 4.3 3.4 37 1.25
12 Jayaraj 33215 43 M AWMI 120 100 + 1 4 8 A 5 4.2 33 1.875
13 Sundar 33446 50 M IWMI/RVMI 96 64 + + 3 D 5.1 4.3 32 1.25 2
14 Dhanalakshmi 33617 52 F AWMI 130 80 + + 1 2 7 A 5.3 3.9 53 1.375
15 Palani 33622 50 M ASMI 120 70 1 3 6 A 5 4 39 1.25
16 Mohamed Hasen 33682 58 M IPWMI 110 70 + 1 3 7 A 4.7 2.9 69 1.25
17 Kamalakannnan 33702 58 M ASMI 150 100 + + 1 3 6 A 4.8 3.6 48 1.5625
18 Lakshmi 33773 59 F IPWMI 120 90 + 1 3 6 A 4.4 2.9 60 1.375
19 Karpagam 33791 40 F IPWMI 100 70 1 3 6 A 5.1 3.7 52 1.375
20 Rajammal 33960 45 F IWMI 120 100 1 3 7 A 4 2.8 58 1.25
21 Munuswamy 34821 58 M ASMI 140 100 + 2 2 6 A 3.4 2.9 35 1.75
22 Aruldas 34883 54 M AWMI 130 90 + + 1 3 6 A 5 4 39 1.375 1
23 Manoharan 35019 53 M IWMI 120 90 + 2 3 8 A 5.6 4.2 44 1.125 1
24 Mohanlal 35167 46 M ASMI 130 90 + 1 2 6 A 4.7 3.9 35 1.25
25 Thanikachalam 35342 59 M ASMI 120 90 + + 2 2 7 A 5 4 40 1.5625
![Table adapted from Thygeson et al[12]](https://thumb-us.123doks.com/thumbv2/123dok_us/546513.73246/15.595.126.475.80.250/table-adapted-from-thygeson-et-al.webp)
