City, University of London Institutional Repository
Citation
:
Fahad, L. G., Tahir, S. F. & Rajarajan, M. (2014). Activity Recognition in Smart
Homes using Clustering based Classification. Paper presented at the 22nd International
Conference on Pattern Recognition (ICPR), 24-08-2014 - 28-08-2014, Stockholm, Sweden.
This is the accepted version of the paper.
This version of the publication may differ from the final published
version.
Permanent repository link:
http://openaccess.city.ac.uk/4475/
Link to published version
:
Copyright and reuse:
City Research Online aims to make research
outputs of City, University of London available to a wider audience.
Copyright and Moral Rights remain with the author(s) and/or copyright
holders. URLs from City Research Online may be freely distributed and
linked to.
City Research Online:
http://openaccess.city.ac.uk/
[email protected]
Activity Recognition in Smart Homes using
Clustering based Classification
Labiba Gillani Fahad
∗, Syed Fahad Tahir
†and Muttukrishnan Rajarajan
∗ ∗School of Engineering and Mathematical SciencesCity University London, Northampton Square, London EC1V 0HB, UK Email:{labiba.gillani.2, r.muttukrishnan}@city.ac.uk
†School of Electronic Engineering and Computer Science
Queen Mary University of London, Mile End Road, London E1 4NS, UK Email: [email protected]
Abstract—Activity recognition in smart homes plays an im-portant role in healthcare by maintaining the well being of elderly and patients through remote monitoring and assisted technologies. In this paper, we propose a two level classification approach for activity recognition by utilizing the information obtained from the sensors deployed in a smart home. In order to separate the similar activities from the non similar activities, we group the homogeneous activities using the Lloyd’s clustering algorithm. For the classification of non-separated activities within each cluster, we apply a computationally less expensive learning algorithm Evidence Theoretic K-Nearest Neighbor, which per-forms better in uncertain conditions and noisy data. The approach enables us to achieve improved recognition accuracy particularly for overlapping activities. A comparison of the proposed approach with the existing activity recognition approaches is presented on two publicly available smart home datasets. The proposed approach demonstrates better recognition rate compared to the existing methods.
I. INTRODUCTION
Advances in pervasive computing such as development of affordable and unobtrusive wireless sensors along with efficient data processing techniques have resulted in the development of unprecedented, cost effective and technologically driven healthcare solutions [1], [2]. One such example is assisted living in smart homes with the sensors deployed to gather information about the user and its context. The obtained information is exploited to monitor the functional ability of the resident [3]. In order to live independently, a smart home resident should be able to complete the basic activities such as grooming, eating, taking medication or meal preparation. Automated recognition of these activities is an important step towards independent living [3]. Activity recognition in smart homes has a number of prospective applications such as providing a safe environment for people with physical or cognitive impairments by timely indication of changes in their daily routine and by ensuring immediate medical aid when required [1].
[image:2.595.316.561.239.363.2]The obtained sensor data of a user and its interactions within the environment is segmented according to the activity descriptions known as activity instances. The detected activity instances are used to train an activity recognition model. The trained models are then used to classify and assign a label to a new activity instance. Activities can be recognized by using techniques such as Hidden Markov Model (HMM) [1], Ontol-ogy [2], Conditional Random Fields (CRF) [4], Naive Bayes
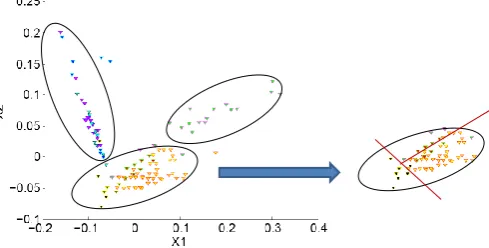
Fig. 1. An example of Activity Recognition by Clustering based Classification (AR-CbC). The axesX1andX2show the first two principal components of
features. Similar activity instances are grouped into one cluster. A learning method is applied for classification within each cluster that separates the overlapping activities.
(NB) classifier [5], Decision Trees (DT) [6], Probabilistic Neural Networks (PNN) [7], Support Vector Machines (SVM) [8] and Nearest Neighbors classifier [9]. Mis-classifications in the activity recognition may occur due to unreliable sensor information. Also activities performed at the same location and involving similar objects share common features and thus can be overlapping [10], such as kitchen activities: preparing breakfast, lunch and dinner. In addition, activities can be performed depending on a user’s preferences or lifestyle, which may not follow predefined order of sequences or steps. It is therefore important to address both inter and intra-class activity variations [1], since next level of decisions such as long term analysis [7] may depend on the outcome of these recognition systems.
activity instances of different classes grouped in one cluster, we apply the learning method Evidence Theoretic K-Nearest Neighbors (ET-KNN) that combines KNN with the Dampster Shafer Theory (DST) of evidence. The approach is evaluated using two publicly available smart home datasets: Aruba and Kasteren. The results show a better performance compared to the existing approaches on the defined evaluation measures.
The rest of the paper is organized as follows: Sec. II discusses the related work on activity recognition. In Sec. III, we discuss the proposed activity recognition approach. The datasets and experimental analysis are presented in Sec. IV. Finally, Sec. V draws conclusions.
II. RELATED WORK
Activity recognition approaches developed in the past differ from each other in the sensing modalities, applied techniques and the operating environments. Some approaches are based on wearable sensors (accelerometers, gyroscope) and are developed to recognize the physical activities such as sitting, standing, walking or falling [6], [9]. In contrast, the activity recognition approaches based on ambient or environ-ment interactive sensors (reed switches, motion, pressure and analog sensors) examine the more complex activities such as meal preparation, eating, grooming and sleeping [1], [2], [8], [11]. NB classifier is used to develop an activity recognition approach by exploiting the information of user interaction with multiple objects in a home obtained through switch state sensors [5]. A two layered hierarchical organization approach based on Switching Hidden Semi Markov Model (S-HSMM) and discrete coxian distribution is developed to recognize the daily activities and to identify the anomalies [12]. One layer represents the events and their duration, while the other layer corresponds to the higher level activities. An unsupervised approach mines the discontinuous frequent patterns and groups the similar patterns into clusters, HMM is then applied to recognize the activities [1]. HMM is compared with CRF to recognize the daily activities [4]. HMM requires a large amount of training data and unlike CRF, HMM may not be able to capture long range dependencies of sensor observations due to its strong independence assumption.
[image:3.595.312.565.119.291.2]A knowledge driven activity recognition approach uses Ontological modeling, domain knowledge and semantic rea-soning [2]. The information of activated sensors is combined to form an activity description, which is fed into the reasoning engine to infer the activity class against the activity models and profiles. PCA is used to extract significant features and a multi-class method one-versus-one SVM is applied for the classification of activities [8]. Based on self adaptive neural network, growing self organizing maps is applied to recognize the activities in a smart home [13]. Next, PNN and K-means clustering are applied to monitor the daily routine of smart home occupants and to identify anomalies [7]. An active learning approach for recognition in the presence of overlapping activities (AALO) first performs location based frequent item set mining to find the activity patterns and then DBSCAN clustering is applied to form the activity clusters [10]. In [11], the temporal information of domain knowledge is incorporated in the DST of evidence, where the start time and duration of the activity is used in the Evidence Decision Network (EDN) for the recognition. However, incorporating
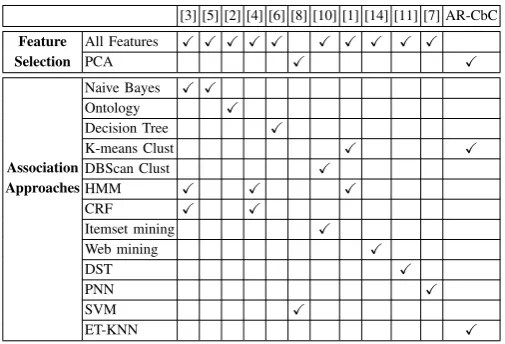
TABLE I. COMPARATIVE SUMMARY OF STATE-OF-THE-ART METHODS FOR ACTIVITY RECOGNITION. ALLFEATURES-MEAN NO EXPLICIT FEATURE SELECTION. KEY: PCA - PRINCIPALCOMPONENTANALYSIS,
HMM - HIDDENMARKOVMODEL, CRF - CONDITIONALRANDOM
FIELDS, PNN - PROBABILISTICNEURALNETWORKS, SVM - SUPPORT
VECTORMACHINE, ET-KNN - EVIDENCE-THEORETICK-NEAREST
NEIGHBOR.
[3] [5] [2] [4] [6] [8] [10] [1] [14] [11] [7] AR-CbC
Feature All Features X X X X X X X X X X
Selection PCA X X
Association
Naive Bayes X X
Approaches
Ontology X
Decision Tree X
K-means Clust X X
DBScan Clust X
HMM X X X
CRF X X
Itemset mining X
Web mining X
DST X
PNN X
SVM X
ET-KNN X
the temporal information such as activity start time, duration or definition of absolute intervals for the execution of an activity makes the approach restricted to a particular user’s way of working and thus may not represent a more general scenario. Also variations in the duration of activities performed makes temporal information less relevant.
To conclude this section, Table I summarizes and compares the activity recognition approaches in the state of the art.
III. ACTIVITY RECOGNITION
Let A = {A1, ..., Ak, ..., AK} be a set of K activity
classes andIk = {I1k, ..., Ijk, ..., IJ k}be a set ofJ activity
instances of Ak in the training data observed by R binary
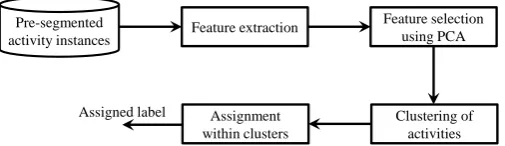
sensors installed at different locations in a smart home. We propose a two level activity recognition approach in which we perform the activity clustering from the extracted features and then the assignment is performed within each cluster. Figure 2 shows the block diagram of the proposed approach.
Each activity instance Ijk is represented by a set
Fjk = n
fr jk
oR
r=1of
Rfeatures. Each featurefr
jk represents
the number of times a sensor is activated during the activity. In the training set containingN =J×Kpre-segmented activity instances Ijk, each fjkr in the feature set is normalized such
that 0 ≤ fˆjkr ≤ 1 given as
ˆ Fjk=
n
ˆ fjkr
oR
r=1 =
(
fr
jk−minj,kfjkr
maxj,kfjkr −minj,kfjkr )
. (1)
Feature extraction Pre-segmented
activity instances
Assigned label
Feature selection using PCA
Clustering of activities Assignment
[image:4.595.42.295.57.130.2]within clusters
Fig. 2. Block diagram of the proposed activity recognition approach.
function
Ψ =
κ X
κ=1
N X
i=1
||Ii(κ)−Cκ||2, (2)
whereIi isith activity instance without the class information
and Cκ is the κth cluster center. We have κ clusters, where
κ is initially set to the number of classes, however after the clustering, empty clusters are removed. Objective function measures the distance of the activity instances from their respective cluster centers.
Once the clusters of the overlapping activity classes are obtained, we apply ET-KNN [16] within each cluster to recog-nize the activities. Since K-Nearest Neighbor (KNN) works by classifying the activity instances based on their nearest training samples in the feature space, a new activity instance X in the feature space is assigned to the Activity classAk, if it has the
minimum distance D(.) fromAk
Dmin=min{D(X, Pl)}, l∈K,ˆ (3)
wherePl are the reference patterns of each activity classAk
and Kˆ are the total number of Pl in a cluster. Euclidean
distance is usually calculated.
ET-KNN [17] extends KNN to address the issue of uncer-tainty in data. ET-KNN is based on DST of evidence [18], where each neighboring pattern is considered as an evidence supporting the hypothesis of the class membership. Consider a classification problem, where a pattern (new activity instance) Xhas to be assigned to one of theKˆ activity classes in a clus-ter. We compareX withKˆ reference patterns:P1, P2, ...., PKˆ. Each patternPl is supposed to have a degree of membership
µl
k to each classAk withP
ˆ
K l=1µ
l
k = 1. From the degree of
membership we perform the Basic Belief Assignment (BBA) for each pattern in the cluster and aggregate using Dempster’s rule of combination [18]. The parameters are optimized by the error minimizing function as in [16]. The label of the activity class with the maximum belief of membership is assigned to X.
IV. EVALUATION ANDDISCUSSION
The proposed approach (AR-CbC) is evaluated on two smart home datasets: Aruba and Kasteren. The performance measures for the comparisons are Precision, Recall, F1score and Accuracy, using True Positives (TP), False Positives (FP) and False Negatives (FN). Results are compared with the learning classifiers ET-KNN, KNN and PNN in [7], [9], [17]. Activity based comparisons of AR-CbC with two existing approaches [11] and [10] are performed using Kasteren dataset.
TABLE II. SUMMARY OF DATASETS USED IN THE EVALUATION.
Datasets Activity Activity Name of activities classes instances
Aruba 11 6477
Bed to Toilet, Eating, Enter Home, House Keeping, Leave Home, Meal Preparation, Relax, Resperate, Sleeping, Wash Dishes and Work.
Kasteren7 7 245
Breakfast, Dinner, Drink, Leave Home, Showering, Sleeping and Toileting.
Kasteren10 10 272
Breakfast, Dinner, Drink, Dish Washing, Leave Home, Toileting, Snack, Showering, Sleeping and Washing Machine.
A. Evaluation measures
Precision indicates the presence of correctly recognized instances in all the recognized instances of an activity class as
Precision = T P
T P +F P ×100. (4)
Recallis the percentage of correctly labeled instances from the total instances of that class
Recall = T P
T P+F N ×100. (5)
Recall is the ability of a classifier to return most of the correct labels out of the total correct labels. F1score combines the precision and recall and returns a single measurement that is the weighted average of precision and recall of the system given as
F1score=2×P recision×Recall
P recision+Recall . (6)
F1score returns a value in the range [0, 1]. A value closer or equal to 1 shows the best performance, while a value of 0 indicates the worst performance. Finally, the recognition Ac-curacyof the system for all the activity instances is measured as
Accuracy= T P
N , (7)
whereN is the total number of instances.
[image:4.595.303.564.68.154.2]B. Datasets
Table II shows the summary of publicly available smart home datasets: Aruba [19] and Kasteren [4] used in the evaluation. The information of the user and its interaction with the multiple objects within the environment is gathered using the binary sensors: contact switch sensors, motion sensors, absent/present status of item and door open/close status of cabinet sensors. Kasteren dataset has been used as sets of 7 and 10 activities in the state of the art. For the evaluation and comparisons we use both Kasteren7 and Kasteren10 datasets. In Aruba dataset11types of activities are performed. Total number of instances in datasets Kasteren7 (245) and Kasteren10 (272) are far less than Aruba (6477) dataset. Some of the activities are performed in the same location and share same sensors, such as ’Breakfast’, ’Dinner’ and ’Drink’ in Kasteren dataset, while ’Meal preparation’ and ’Wash Dishes’ in Aruba dataset, which may result in less discriminative information and highlight less inter-class varia-tions.
TABLE III. COMPARISON OFAR-CBCWITHET-KNN [17], KNN [9]ANDPNN [7]FORARUBA,Kasteren7ANDKasteren10SMART HOME DATASETS.
Datasets Folds Approach Precision(%) Recall (%) F1score[0,1] Accuracy (%)
Aruba Three folds
AR-CbC 79.65 76.46 0.75 91.40
ET-KNN 74.27 75.42 0.71 90.17
KNN 72.39 73.11 0.70 90.07
PNN 76.48 68.98 0.69 88.62
Kasteren7
Three fold
AR-CbC 91.76 90.48 0.90 94.71
ET-KNN 89.89 87.77 0.87 92.27
KNN 89.95 82.82 0.84 89.80
PNN 90.28 84.52 0.85 91.43
One day out
AR-CbC 96.26 95.07 0.95 96.33
ET-KNN 93.41 89.66 0.90 93.06
KNN 88.25 83.66 0.84 90.20
PNN 86.55 84.80 0.84 92.24
Kasteren10
Three fold
AR-CbC 90.29 89.88 0.89 93.36
ET-KNN 90.70 84.31 0.85 90.04
KNN 90.50 83.30 0.84 89.31
PNN 87.92 81.35 0.82 90.03
One day out
AR-CbC 88.80 90.07 0.88 93.00
ET-KNN 83.62 83.32 0.82 90.77
KNN 85.98 83.18 0.82 89.31
PNN 81.33 78.62 0.78 89.29
with the existing approaches, leave one day out cross vali-dation is applied on Kasteren7 and Kasteren10 datasets. Experiments are carried out using Matlab version 7.11 on a 3.3 Ghz dual core desktop system with 4 GB of RAM.
C. Analysis and discussion
Table III shows the comparison of AR-CbC with ET-KNN, KNN and PNN classification approaches for Aruba, Kasteren7 and Kasteren10 datasets. AR-CbC shows better performance for all evaluation measures. In Aruba, the higher precision and recall rates of79.65% and76.46% by AR-CbC shows the effectiveness of proposed approach in the correct recognition of the activity instances. F1scores of AR-CbC, ET-KNN, KNN and PNN are 0.75, 0.71, 0.70, and 0.69. The high value of F1score confirms the improved performance in both precision and recall compared to other classifiers. Finally, the accuracy of AR-CbC is 91.40%, that is 1.23%, 1.33%and2.78%higher than that of ET-KNN, KNN and PNN respectively. InKasteren7 dataset, we obtain the results for both three fold and leave one day out cross validation. AR-CbC shows an overall better performance than ET-KNN, KNN and PNN classification approaches. In the results of leave one day out cross validation, AR-CbC achieved the precision and recall values of 96.26% and 95.07%, which are respectively 2.85% and 5.41% higher than ET-KNN, 8.01% and 11.41% higher than KNN, while9.71%and10.27%higher than PNN. The performance of KNN and PNN classification approaches remain comparable to each other. The high F1score of AR-CbC indicates its better performance in the correct labeling of activity instances. Similarly, for three fold cross validation results ofKasteren7 dataset, AR-CbC outperformed the ET-KNN, KNN and PNN classifiers in the accurate identification of the activity instances. ForKasteren10 dataset, in the case
of three fold cross validation, AR-CbC obtained a high F1score (0.89) and accuracy (93.36%), which shows its effectiveness in the correct classification of activity instances to one of the pre-defined activity classes. For leave one day out cross validation, F1score of AR-CbC is0.88. The accuracy of AR-CbC is93%, which is2.23%,3.69%and3.71%higher than ET-KNN, KNN and PNN approaches. The above results show that AR-CbC obtained better performance on both three fold and leave one day cross validation in comparison to the ET-KNN, KNN and PNN approaches.
Figure 3(a) shows the comparison of AR-CbC with [11] usingKasteren7 dataset by applying leave one day out cross validation. The evaluation measure used is F1score. AR-CbC shows higher F1score on all the activities in comparison to Evidence Decision Network (EDN), No time EDN, Naive Bayes (NB) and J48 Decision Tree (DT) with an overall accuracy of 96%. In Fig. 3(b) AR-CbC is compared with AALO [10] using Kasteren10 dataset and the evaluation measure accuracy. It can be observed that AR-CbC achieved a higher accuracy in the activities of ’Leave Home’, ’Toilet’, ’Shower’, ’Breakfast’, ’Snack’, ’Drink’, ’Washing machine’ and ’Dish Washing’ compared to AALO. The slightly less accuracy is observed in the ’Sleep’ and ’Dinner’ activities. AR-CbC obtains an overall improved performance than the existing approaches and is more effective in the accurate recognition of both separated and overlapping activities. We further analyze the performance of AR-CbC using the confusion matrix of the performed activities in Aruba andKasteren7 datasets.
Leave home Toilet Shower Sleep Breakfast Dinner Drink 0
0.1 0.2 0.3 0.4 0.5 0.6 0.7 0.8 0.9 1
Activities
F1score
AR−CbC Temporal EDN No time EDN Naive Bayes J48 Decision Tree
(a) F1score comparison usingKasteren7dataset
Leave Toilet Shower Sleep Bfast Dinner Snack Drink WashingDwash 50
55 60 65 70 75 80 85 90 95 100
Activities
Accuracy
AR−CbC AALO
[image:6.595.51.556.53.250.2](b) Accuracy comparison usingKasteren10dataset
[image:6.595.71.526.316.457.2]Fig. 3. Using leave one day out cross validation, AR-CbC is compared with (a) Temporal EDN [11], No time EDN [11], Naive Bayes and J48 Decision Tree, and (b) Active learning recognition approach in presence of overlapping activities (AALO) [10].
TABLE IV. CONFUSION MATRIX OFAR-CBCONARUBADATASET. ROWS REPRESENT THE ACTUAL ACTIVITIES AND COLUMNS REPRESENT THE PREDICTED ACTIVITIES.
Activities Toilet Eat Enter H-keep Leave Mealprep Relax Resperate Sleep W-dishes Work
Toilet 99.40 0 0 0 0 0 0.60 0 0 0 0
Eat 0 94.20 0 0.40 0 2.30 3.10 0 0 0 0
Enter 0 0 95.80 0 3.5 0.70 0 0 0 0 0
H-keep 0 0 0 90.90 0 3.00 6.10 0 0 0 0
Leave 0 0 86.80 0 11.6 1.20 0 0.20 0 0 0
Meal prep. 0 0 0 0 0 96.80 0.60 0 0 2.30 0
Relax 0 0.20 0 0.20 0 1.30 97.60 0 0.30 0 0.10
Resperate 0 0.40 0 0 0 0 0 66.70 0 0 33.30
Sleep 0 0.30 0 0.20 0 0 1.5 0 98.30 0 0
W-dishes 0 0 0 0 0 90.80 0 0 0 9.20 0
[image:6.595.52.559.495.579.2]Work 0 0 0.60 0 0 0.60 1.80 0.60 0 0 96.50
TABLE V. CONFUSION MATRIX OFAR-CBCONKasteren7DATASET FOR ALL ACTIVITIES. THE ROWS REPRESENT THE ACTUAL ACTIVITIES AND COLUMNS REPRESENT THE PREDICTED ACTIVITIES.
(a) Three fold cross validation
Activities Leave Toilet Shower Sleep Breakfast Dinner Drink
Leave 97.10 0 0 2.90 0 0 0
Toilet 0 97.40 2.60 0 0 0 0
Shower 0 0 100.00 0 0 0 0
Sleep 0 8.30 0 91.70 0 0 0
Breakfast 0 0 0 0 80.00 20.00 0
Dinner 0 0 0 0 30.00 70.00 0
Drink 0 0 0 5.00 10.00 0 85.00
(b) Leave one day out cross validation
Activities Leave Toilet Shower Sleep Breakfast Dinner Drink
Leave 97.10 0 0 2.90 0 0 0
Toilet 0 97.40 1.80 0.90 0 0 0
Shower 0 0 100.00 0 0 0 0
Sleep 0 4.20 0 95.80 0 0 0
Breakfast 0 0 0 0 100.00 0 0
Dinner 0 0 0 0 20.00 80.00 0
Drink 0 0 0 5.00 0 0 95.00
’Leave Home’ are identified as ’Enter Home’ activity due to the reason that the same exit door is used in both activities resulting in the activation of same sensor in both cases. In ’Wash Dishes’ 90% of activity instances are recognized as ’Meal preparation’, which could be due to the reason that ’Wash Dishes’ can be a sub-activity in ’Meal preparation’. The ’Resperate’ activity is recognized with 66% accuracy, while its remaining instances are identified as ’Work’ activity. The ’Resperate’ activity involves operating of a device to lower the blood pressure and therefore 33% of ’Resperate’ activity instances are identified as ’Work’ activity.
From the detailed analysis of the results of proposed approach in comparison with the existing methods, it can be concluded that AR-CbC proves to be more effective and reliable in the recognition of activity instances.
V. CONCLUSION
We proposed a robust activity recognition approach that identifies the performed activities of daily livings. The ap-proach combines the classification with the clustering to im-prove the recognition accuracy in the case of similar activities with less inter class variations. The approach shows a recog-nition accuracy of up to 91%, 96% and 93%, respectively in Aruba andKasteren7andKasteren10datasets. In the future, we aim at exploiting the additional information like semantic reasoning and temporal information for activity inference.
REFERENCES
[1] P. Rashidi, D. J. Cook, L. B. Holder, and M. Schmitter-Edgecombe, “Discovering activities to recognize and track in a smart environment,” IEEE Trans. on Knowledge and Data Engineering, vol. 23, no. 4, pp. 527–539, 2011.
[2] L. Chen, C. Nugent, and H. Wang, “A knowledge-driven approach to activity recognition in smart homes,”IEEE Trans. on Knowledge and Data Engineering, vol. 24, no. 6, pp. 961–974, 2012.
[3] D. J. Cook, “Learning setting-generalized activity models for smart spaces,”IEEE Intelligent Systems, vol. 27, no. 1, pp. 32–38, 2012. [4] T. V. Kasteren, A. Noulas, G. Englebienne, and B. Krose, “Accurate
activity recognition in a home setting,” in Proc. of Int. conf. on Ubiquitous computing, Seoul, Korea, September 2008, pp. 1–9. [5] E. M. Tapia, S. S. Intille, and K. Larson, “Activity recognition in the
home using simple and ubiquitous sensors,”Pervasive Computing, vol. 3001, pp. 158–175, 2004.
[6] L. Bao and S. S. Intille, “Activity recognition from user-annotated acceleration data,” inProc. of Int. conf. on Pervasive computing, Vienna, Austria, April 2004, pp. 1–17.
[7] L. G. Fahad, A. Ali, and M. Rajarajan, “Long term analysis of daily activities in smart home,” inProc. of the European Symp. on Artificial Neural Networks, Computational Intelligence and Machine Learning, Bruges, Belgium, April 2013, pp. 419–424.
[8] A. Fleury, M. Vacher, and N. Noury, “Svm-based multimodal classi-fication of activities of daily living in health smart homes: sensors, algorithms, and first experimental results,”IEEE Trans. on Information Technology in Biomedicine, vol. 14, no. 2, pp. 274–283, 2010. [9] N. Bicocchi, M. Mamei, and F. Zambonelli, “Detecting activities from
body-worn accelerometers via instance-based algorithms,” Pervasive and Mobile Computing, vol. 6, no. 4, pp. 482–495, 2010.
[10] E. Hoque and J. Stankovic, “Aalo: Activity recognition in smart homes using active learning in the presence of overlapped activities,” inProc. of IEEE Int. Conf. on Pervasive Computing Technologies for Healthcare (PervasiveHealth), May 2012, pp. 139–146.
[11] S. Mckeever, J. Ye, L. Coyle, C. Bleakley, and S. Dobson, “Activity recognition using temporal evidence theory,”Journal of Ambient Intel-ligence and Smart Environments, vol. 2, no. 3, pp. 253–269, 2010. [12] T. V. Duong, H. H. Bui, D. Q. Phung, and S. Venkatesh, “Activity
recognition and abnormality detection with the switching hidden semi-markov model,” inProc. of IEEE Int. Conf. on Computer Vision and Pattern Recognition, vol. 1, June 2005, pp. 838–845.
[13] H. Zheng, H. Wang, and N. Black, “Human activity detection in smart home environment with self-adaptive neural networks,” inProc. of IEEE Intl Conf. on Networking, Sensing and Control, Hainan, China, April 2008, pp. 1505–1510.
[14] P. Palmes, H. K. Pung, T. Gu, W. Xue, and S. Chen, “Object relevance weight pattern mining for activity recognition and segmentation,” Per-vasive and Mobile Computing, vol. 6, no. 1, pp. 43–57, 2010. [15] S. Lloyd, “Least squares quantization in pcm,”IEEE Trans. on
Infor-mation Theory, vol. 28, no. 2, pp. 129–137, 1982.
[16] L. M. Zouhal and T. Denoeux, “An evidence-theoretic k-nn rule with parameter optimization,”IEEE Trans. on Systems, Man, and Cybernet-ics, Part C, vol. 28, no. 2, pp. 263–271, 1998.
[17] T. Denoeux, “A k-nearest neighbor classification rule based on dempster-shafer theory.”IEEE Trans. on Systems, Man, and Cybernet-ics, vol. 25, no. 5, pp. 804–813, 1995.
[18] G. Shafer,A Mathematical Theory of Evidence. Princeton: Princeton University Press, 1976.
![TABLE III.COMPARISON OF AR-CBC WITH ET-KNN [17], KNN [9] AND PNN [7] FOR ARUBA, Kasteren7 AND Kasteren10 SMART HOMEDATASETS.](https://thumb-us.123doks.com/thumbv2/123dok_us/1506846.103363/5.595.70.539.78.349/table-iii-comparison-aruba-kasteren-kasteren-smart-homedatasets.webp)
![Fig. 3.Using leave one day out cross validation, AR-CbC is compared with (a) Temporal EDN [11], No time EDN [11], Naive Bayes and J48 Decision Tree,and (b) Active learning recognition approach in presence of overlapping activities (AALO) [10].](https://thumb-us.123doks.com/thumbv2/123dok_us/1506846.103363/6.595.51.556.53.250/validation-compared-temporal-decision-learning-recognition-overlapping-activities.webp)
