City, University of London Institutional Repository
Citation
: Fonseca, J., Sim, W., Shire, T. and O'Sullivan, C. (2014). Microstructural
analysis of sands with varying degrees of internal stability. Geotechnique, 64(5), pp.
405-411. doi: 10.1680/geot.13.T.014
This is the published version of the paper.
This version of the publication may differ from the final published
version.
Permanent repository link:
http://openaccess.city.ac.uk/3920/
Link to published version
: http://dx.doi.org/10.1680/geot.13.T.014
Copyright and reuse:
City Research Online aims to make research
outputs of City, University of London available to a wider audience.
Copyright and Moral Rights remain with the author(s) and/or copyright
holders. URLs from City Research Online may be freely distributed and
linked to.
City Research Online:
http://openaccess.city.ac.uk/
[email protected]
405
TECHNICAL NOTE
Microstructural analysis of sands with varying degrees of internal stability
J. F O N S E C A, W. W. S I M † , T. S H I R E ‡ a n d C . O ’ S U L L I VA N §
Internal erosion involves the migration of particles through a geotechnical structure. Internal erosion poses a significant hazard to embankment dams and flood embankments. The fundamental mechanisms operate at the particle scale and a thorough understanding of these mechanisms can inform the filter design and specification process and reduce the hazard that internal erosion is known to pose to many engineered embankment structures. Engineers have long acknowledged the importance of the grain scale interactions, but until recently, explanations of the mechanisms have been purely hypothetical, as direct observation of the internal structure of filters was not possible. Recent research has used the discrete-element method to establish a particle-scale basis for Ke´zdi’s filter internal stability criterion. The element method can provide significant useful data on soil microstructure, so a discrete-element method model is inherently ideal. This study therefore examines a number of real sand samples with varying degrees of internal stability at the particle scale using high-resolution micro-computed tomography. The correlation between coordination number and internal stability is con-firmed, with the coordination number values being significantly higher for the real material.
KEYWORDS: erosion; filters; laboratory tests
INTRODUCTION
Embankment dam filters prevent erosion of a low-permeability clay core due to water seepage. Filters should be erosion resistant or ‘internally stable’. Internally unstable filters are susceptible to suffusion, an internal erosion mechanism that occurs when the finer particles within the filter are carried downstream in the direction of seepage flow (e.g. Fell & Fry, 2007). Three factors contribute to internal erosion: (a) material susceptibility, (b) hydraulic susceptibility and (c) mechanical susceptibility (Brown & Bridle, 2009). Design guidelines focus on the material susceptibility and current guidelines for assessing the internal stability of filters are mainly derived empirically and consider the shape of the particle size distribu-tion (PSD) curve (e.g. Ke´zdi, 1979; Kenney & Lau, 1985, 1986; Burenkova, 1993).
The initiation and propagation of internal erosion is a particle-scale phenomenon. Prior discussions on internal ero-sion have often included schematic diagrams and idealised particle arrangements to illustrate the authors’ understanding of the filter microstructure and its relation to internal stabi-lity. For example, Kenneyet al.(1985) and Indraratna et al.
(2007) estimated constriction sizes using assumed ideal representative particle arrangements. Chang & Zhang (2013) present schematic diagrams illustrating their assumptions of the way fine particles fill the pores between the coarse particles. The prevalence of these hypothetical descriptions in the internal erosion literature has highlighted the need to make direct particle-scale measurements. The present authors know of no prior research that has used high-resolution micro-computed tomography (ìCT) data to make
three-dimensional particle-scale measurements to quantitatively relate fabric (microstructure) to a well-established internal stability criterion.
Previously Shire & O’Sullivan (2013) used the discrete-element method (DEM) and found a relationship between the internal structure and the Ke´zdi (1979) criterion for internal stability. The DEM study considered idealised spherical particles; here the research has been extended by using ìCT to look at the internal structure of real granular materials.
EXPERIMENTAL METHOD
Quantifying internal stability
As in Shire & O’Sullivan (2013), the internal stability of soils is quantified using the (D159=d985)max ratio, as proposed
by Ke´zdi (1979). The PSD is divided into coarser and finer fractions. The D915 of the coarse fraction is compared with
the d985 of the fine fraction. The ‘finer’ and ‘coarser’
fractions are selected by systematically splitting the PSD at different points along the curve (or at the gap in the case of a gap-graded soil). A soil is considered to be internally stable if (D915=d985)max,4.
Laboratory sample preparation
Referring to Fig. 1, three specimens of sand with different gradings and different levels of internal stability were created; one well-graded specimen (WG), and two gap-graded speci-mens (G1 and G2). The gradings were selected to include stable and unstable samples and were achieved by mixing four laboratory sands (quarried sand and processed Leighton Buz-zard sand). Table 1 summarises the mixes used and Fig. 1 gives the overall gradings of each sample as measured with standard laboratory sieving and the QicPic laser scanning approach (Wittet al., 2004). For the laser scanning approach three diameter definitions were used. The Feret diameters are the distances between two tangents to a two-dimensional out-line of the particle and the maximum and minimum Feret diameters from the laser scanning are denotedFLS
MINandFLSMAX
Manuscript received 24 April 2013; revised manuscript accepted 10 December 2013. Published online ahead of print 2 May 2014. Discussion on this paper closes on 1 October 2014, for further details see p. ii.
City University London, London, UK.
† Imperial College London, London, UK. ‡ Atkins Ltd, Epsom, UK.
respectively. The diameter derived from the equivalent circle (EQPCLS) is given by the diameter of a circle that has the same
area as the projection area of the particle (Sympatec, 2012). The samples were dry pluviated into a latex membrane lined mould. The two gap-graded samples were made up in 200 g batches to minimise segregation. Sample segregation was not deemed an issue with the well-graded sample and it was created as a single 2 kg batch. Specimen densification and levelling of the upper surface were performed by gentle vibration of the mould at half-way and full fill points of specimen pluviation.
The samples were tested dry, as in the work of Fonsecaet al.
(2013a). The stress path followed by the samples is illustrated in Fig. 2(a). They were first taken to an effective isotropic stress of 50 kPa (point B, Fig. 2(a)). Assuming an effective angle of shearing resistance (ö9) of 358 for the samples and assuming K0¼1sinö9 for normally consolidated sands
(Jaky, 1944), the stress path for K0 compression was
deter-mined. Each sample was subject to K0 compression until the
mean effective stress (p9) reached 300 kPa (point D, Fig. 2(a)).
Resin impregnation
In ìCT the resolution of the images obtained is inversely proportional to the size of the scanned sample (e.g. Fonseca, 2011). To enable analysis of the inter-particle contacts a resolution of 10ìm was needed and so the sample size for scanning was restricted to 9 mm diameter. To allow these 9 mm cores to be extracted without disturbing the fabric, the specimens were impregnated with a low-viscosity epoxy resin. The resin used was Epo-Tek 301, which has been successfully used in other studies to examine the fabric of cohesionless specimens (e.g. Palmer & Barton, 1986; Jang et al., 1999; Fonseca, 2011). This resin has a relatively low viscosity of 100 mPa s at 258C, compared to a typical epoxy resin viscosity of 300 mPa s (Jang et al., 1999). Another important characteristic of this resin is the fact that it cures at room temperature, which avoids differential thermal stres-ses and volume changes related to variations in temperature that generally occur with thermo-curing resins.
The impregnation was carried out under a suction of 50 kPa applied at the top of the sample. The resin was drawn into the base of the specimen from two feed lines from the resin reservoir under the combined influence of hydrostatic head and a suction applied through the top drainage line, while maintaining the stress state at
p9¼300 kPa and q¼276 kPa, as depicted in Figs 2(b) and 2(c). Once fully impregnated, the suction was removed and the specimen was left to cure under the maintained stress state for 24 h before being extracted from the cell. A central core along the full specimen, 9 mm in diameter, was drilled from each sample. The internal topology of the three speci-mens was inspected using three-dispeci-mensional images from
ìCT scans taken at three different locations, namely, the middle, top and base of the cylindrical core.
Micro-computed tomography scans
Micro-computed tomography uses the different absorption of X-rays by the materials in a sample to generate a 0 10 20 30 40 50 60 70 80 90 100
102 103 104
% Smaller b
y v
olume
Particle size: m (a)
μ
μCT – , topb μCT – , midb μCT – , baseb
FLS
MIN
FLSMAX EQPCLS Sieve 0 10 20 30 40 50 60 70 80 90 100
102 103 104
% Smaller b
y v
olume
Particle size: m (b)
μ
μCT – , topb μCT – , midb μCT – , baseb FLSMIN
FLSMAX
EQPCLS Sieve 0 10 20 30 40 50 60 70 80 90 100
102 103 104
% Smaller b
y v
olume
Particle size: m (c)
μ
μCT – , topb μCT – , midb μCT – , baseb FLSMIN
[image:3.595.59.293.48.637.2]FLSMAX EQPCLS Sieve
Fig. 1. Comparison of particle size distributions obtained using sieve analysis, laser scanning and ìCT: (a) sample WG; (b) sample G1; (c) sample G2
Table 1. Descriptors for Leighton Buzzard sand and specimen grading constituents by dry mass
Mesh numbers (BS 410 (BSI, 1986)) 7/14 14/25 25/52 52/100 Supplier grading:ìm 2360/1180 1180/600 600/300 300/150
Well graded 20% 48% 32% 0%
Gap-graded 1 86% 0% 2% 12%
Gap-graded 2 73% 2% 1% 24%
[image:3.595.55.553.709.778.2]three-dimensional image dataset of volumetric pixels (vox-els), where each voxel is assigned an intensity level corre-sponding to the attenuation of X-rays at the correcorre-sponding point in the sample. Hasan & Alshibli (2010), Hall et al.
(2010) and Fonseca et al. (2013a, 2013b) have all demon-strated the applicability of ìCT in soil mechanics. Homberg
et al. (2012) considered the potential to apply ìCT to
examine the void space in internal erosion research.
The scans were carried out using a Phoenix nanotom (GE Measuring and Control). This system uses a small focal spot that ensures very little geometric unsharpness and so good image resolution. The suitability of this system to obtain high-quality images of silica sands at a few microns
resolu-tion is reported in Fonseca (2011). The images acquired have a voxel size of 10ìm, that is 0.005d50–0.01d50,
con-siderably higher when compared with key earlier geotechni-cal studies (see Fonseca et al. (2013b) for details). As indicated in Table 2, the d10 for all samples is represented
by not less than 25 voxels.
IMAGE PROCESSING AND ANALYSIS
Image binarisation
Micro-tomography images contain a rich amount of infor-mation concerning the internal microstructure of the speci-mens. Following image reconstruction, a three-dimensional
q: kPa
275·7
K0consolidation
D
p⬘: kPa 300 50
20 B C 46·6
A
(a)
Confining cell
Load cell Loading
shaft
Top cap
O-rings Membrane
Resin reservoir
Resin feed lines to base of specimen
Ram Cell
pressure
Suction
Ram pressure
(b)
Feed lines to base of specimen Resin
Suction Drainage
line from top cap
[image:4.595.49.539.62.245.2](c)
Fig. 2. Laboratory preparation of samples: (a) stress path followed; (b) schematic diagram of impregnation; (c) photograph of resin impregnation in process
Table 2. Particle diameters, coefficients of uniformity and curvature fromìCT (ave(a,b,c) is the arithmetic mean of the major principle axis,a, intermediate principle axis,b, and minor principle axis,c), QicPic analysis and manual sieving data
d10:ìm d50:ìm d90:ìm Cu Cz
Well graded
ave(a,b,c) Top 518.0 1040.4 1697.6 2.28 0.89 Middle 520.6 1009.2 1444.9 2.16 0.96 Base 521.7 999.7 1582.2 2.18 0.86 QicPic (Feret min.) 260.6 756.5 1432.7 3.53 0.89 QicPic (Feret max.) 366.0 1168.6 2106.7 3.75 0.95
Sieve 254.8 673.8 1516.8 3.24 0.85
Gap-graded 1
ave(a,b,c) Top 312.4 1592.5 2048.1 5.41 3.81 Middle 268.5 1560.1 1993.7 6.18 2.91 Base 268.4 1449.4 1871.7 5.75 0.88 QicPic (Feret min.) 825.0 1436.6 1921.6 1.84 1.32 QicPic (Feret max.) 1472.3 2059.8 2819.5 1.48 1.04 Sieve 293.2 1496.8 1904.7 5.45 3.57 Gap-graded 2
[image:4.595.42.537.468.779.2]median filter of size 33333 was applied to reduce noise and smooth the image (while preserving the edges). This is particularly relevant for the solid phase that contains a less homogeneous distribution of the X-ray attenuation. Fig. 3 shows the line profile of the intensity levels on a representa-tive grain from the ‘WG middle’ sample. The two solid lines represent the greyscale values prior to and after median filtering. The main points to be noted are: the inner grey-scale values have been smoothed and the location of the grain’s boundaries, that is the vertical lines, remained unal-tered. The histogram of intensity levels in the filtered image had a more distinct bi-modal distribution and lower frequen-cies for intermediate intensity values, in comparison with the unfiltered data. Thus, the filtering process reduced uncertain-ties related to the selection of the adequate threshold value.
The threshold value was obtained by analysing the shape of the histogram of the intensity levels of the filtered data. Gaussian curves were fitted to the two peaks of the
histo-gram and the minimum point between them was determined (see Fonseca (2011) for details). This initial threshold value was compared with the values resulting from application of Otsu’s method (Otsu, 1975), the mid value between the two peaks of the histogram and also the threshold value that matches the experimental void ratio (e.g. Chevalier & Otani, 2011). Fig. 3 shows the binary profile, represented by dashed lines, obtained for each method. The initial threshold value was T¼2353, Otsu’s value gave T¼2330, mid peak value gave T¼2200 and the experimental void ratio was
T¼2404. Despite the small variations in the appropriate threshold value that was indicated from the different meth-ods, whichever method was applied, the edges of the grain remain unchanged. Similar observations were noted for the gap-graded materials; however, the technique that uses the overall void ratio was found unsuitable because of the heterogeneity of the specimens. The output of the threshold-ing process is a binary image where the pixels were classi-fied as either void or solid phase: that is, the voids were shaded black and particles were shaded white.
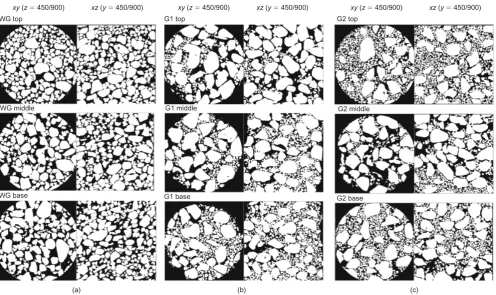
Horizontal and vertical cross-sections through the centre of each of the nine samples that were scanned using ìCT are presented in Fig. 4; it is clear that all nine ìCT specimens include a degree of heterogeneity and that this heterogeneity is more pronounced for the gap-graded materi-al (G1 and G2). It seems that there is segregation in sample G1; there are clearly more fine particles in the base sample of the G1 material and it is easy to imagine that the smaller particles fell through the gaps that appear to exist between the larger grains. Kenney & Lau (1985) propose that in an internally unstable soil there is a primary fabric of stress-transmitting coarse particles and there are loose finer parti-cles in the voids between the primary fabric, which do not carry effective stress and can be moved by seepage. While the amount of information that can be obtained from such two-dimensional sectional images is limited, it does seem that, in the gap-graded material in particular, these criteria are met.
4000
3500
3000
2500
2000
1500
Gre
yscale values
0 50 100 150
Distance along line profile: px
1
0
Binar
y values
[image:5.595.62.286.259.435.2]Greyscale raw Greyscale filtered BinaryT⫽2330 BinaryT⫽2353 BinaryT⫽2404 BinaryT⫽2200
Fig. 3. Line profile along a representative grain
WG top
xy z( ⫽450/900) xz y( ⫽450/900)
WG middle
WG base
(a)
G1 top
xy z( ⫽450/900) xz y( ⫽450/900)
G1 middle
G1 base
(b)
G2 top
xy z( ⫽450/900) xz y( ⫽450/900)
G2 middle
G2 base
(c)
Fig. 4. Sections throughìCT data after image binarisation: (a) WG sample; (b) G1 sample; (c) G2 sample
[image:5.595.59.556.466.761.2]Identification of individual grains
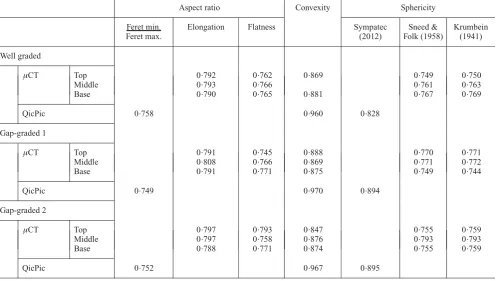
The separation of the interconnected solid phase into individual grains was carried out using a marker-based watershed algorithm (Avizo, VSG). The procedure consisted of: (a) calculating the Euclidian distance map (EDM) on the solid phase of the binary image, (b) identifying the local maxima of the EDM and (c) merging the local maxima to a pre-defined watershed depth value which originates the markers. The number of markers dictates the final number of individual particles coming out of the process, therefore the selected depth value should associate with each individual grain no more than one marker. Small grains, that is grains with lower EDM maxima, require the use of a lower depth value to avoid other local maxima being included in the principal maximum, which would originate under-segmentation of the grains. On the other hand, using lower depth values could cause over-segmentation of very large single grains as it would assign them more than one marker. It was found that a depth value of 6 produced good results for the well-graded samples, whereas for the gap-graded specimens (G1 and G2), the large amount of small grains required a value of 1. The segmentation results for the gap-graded samples were gen-erally good, with the exception of some large grains that, given their high EDM maxima, were associated to more than one marker and therefore slipped into multiple grains. Those grains were easily identified and a Matlab code was written to merge them into a single particle. The high level of detail of the images and the relatively simple particle shape – sub-angular to round with high convexity values (approximately 0.9, from Table 3) – helped minimise the errors often associated with the watershed segmentation.
QUANTITATIVE RESULTS
Particle size measurements
The particle sizes were determined by calculating the principal axes lengths using a Matlab code as described in Fonseca et al. (2012). The segregation effects that are
apparent from visual observation of Fig. 4 led to a variation in the PSDs obtained for each material. Fig. 1 illustrates the intermediate axes lengths, b, for all the ìCT scans. Table 2 gives representative particle diameters for all nine samples. The PSDs differ within each material owing to the segrega-tion effects discussed above. Fonseca et al. (2012) found a good match between sieving and the intermediate axis length (b), the FLS
MAX values were close to the major (maximum)
axis length measurement and FLS
MIN values slightly exceeded
the minor axis length values. Here the various measures of size do not agree as closely as the data presented by Fonseca
et al.(2012).
Analysis of the contacts between particles
Shire & O’Sullivan (2013) proposed that there is a relationship between the average number of contacts per particle (i.e. the coordination number) and the stability of the material as assessed using the Ke´zdi criterion. For each of the nine ìCT samples the Ke´zdi ratio, (D915=d985)max, was
calculated using the intermediate axis length (b). The ìCT data were analysed using the approaches documented in Fonseca (2011). The coordination number, Z, is defined as
Z¼2Nc=Np, where Nc and Np are the numbers of contacts
and particles respectively and each contact is shared between two particles. For each ìCT image, the Z values were calculated using all particles and all contacts detected in the image. Fig. 5 is a plot of Z against (D915=d985)max for the ìCT data and the DEM dataset presented in Shire & O’Sullivan (2013). Considering the ìCT data, the general trend observed by Shire & O’Sullivan is captured; however, the coordination number values are significantly higher. There is slightly more scatter for the sand.
[image:6.595.42.539.498.779.2]The higher coordination numbers observed in the experi-mental study are a consequence of the non-spherical parti-cles present in the real sand. Irregular shaped grains are prone to form a higher number of contacts, moreover, these particles can have more than one particle–particle contact. Sample G2 is at the cusp of being overfilled. In an overfilled
Table 3. Shape factors fromìCT and QicPic analysis
Aspect ratio Convexity Sphericity Feret min.
Feret max.
Elongation Flatness Sympatec (2012)
Sneed & Folk (1958)
Krumbein (1941) Well graded
ìCT Top 0.792 0.762 0.869 0.749 0.750
Middle 0.793 0.766 0.761 0.763
Base 0.790 0.765 0.881 0.767 0.769
QicPic 0.758 0.960 0.828
Gap-graded 1
ìCT Top 0.791 0.745 0.888 0.770 0.771 Middle 0.808 0.766 0.869 0.771 0.772 Base 0.791 0.771 0.875 0.749 0.744
QicPic 0.749 0.970 0.894
Gap-graded 2
ìCT Top 0.797 0.793 0.847 0.755 0.759 Middle 0.797 0.758 0.876 0.793 0.793 Base 0.788 0.771 0.874 0.755 0.759
sample, the fine particles completely fill the void space between the larger particles and actively transmit stress.
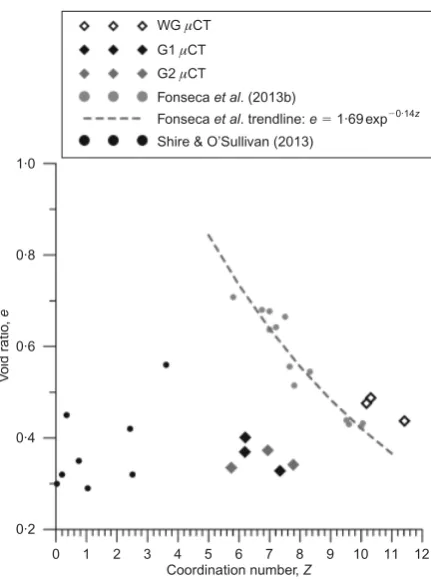
Hasan & Alshibli (2010) and Fonseca et al. (2013b) proposed relationships between the void ratio and the co-ordination number, with the correlations taking an exponen-tial form, as illustrated in Fig. 6. The variation in void ratio with coordination number for the simulations in Shire & O’Sullivan (2013) is also presented. The WG specimens exhibit values close to what was observed for the well-sorted Reigate sand (Fonseca et al., 2013b), indicating that for a well-graded soil an increase in Z is associated with a de-crease in void ratio. The gap-graded samples, however, show no clear trend. This suggests that in addition to void ratio, coordination number is highly dependent on the PSD, in particular the size ratio between coarse and fine particles and whether the fine particles completely fill the voids between the coarse particles. In fact, the partial coordination
numbers (i.e. large–large, small–small and large–small) such as those used by Minh & Cheng (2012) may be more relevant when considering gap-graded materials. Pinson et al.(1998) found that partial coordination numbers in materi-als with a bimodal particle size distribution varied dramati-cally depending on size ratio between small and large and the fines content, and Shire & O’Sullivan (2013) showed that the coarse particles in gap-graded materials play a disproportionate role in force transfer.
CONCLUSION
This study has used ìCT to experimentally examine con-clusions of a DEM-based study by Shire & O’Sullivan (2013). A key finding of this earlier study was that the coordination number of a filter reduces monotonically as the stability of the filter decreases when the stability is quanti-fied according to Ke´zdi (1979). The experimental data con-firm this finding and show that for real materials the magnitude of the coordination number is considerably higher when compared with systems of spheres. This study rein-forces the potential of using ìCT data to verify conclusions developed using DEM results. The work also shows that the correlation between void ratio and coordination number is highly dependent on the shape of the PSD curve. Pre-existing datasets all considered well-graded or uniformly graded materials and found exponential relationships be-tween void ratio and Z. Here the gap-graded materials clearly do not follow that trend.
ACKNOWLEDGEMENTS
Financial support for this research was provided by the Research and Development Enabling Fund of the Institution of Civil Engineers (grant reference 1113). The doctoral studies of Mr Thomas Shire are funded by the Engineering and Physical Sciences Research Council (doctoral training grant).
NOTATION
a major principal axis length
b intermediate principal axis length
Cu coefficient of uniformity (¼d60/d10)
Cz coefficient of curvature (¼d302/(d603d10)) c minor principal axis length
D15 coarse fraction of the PSD curve
d10 particle size for which 10% of particles are smaller
d30 particle size for which 30% of particles are smaller
d50 median particle size
d60 particle size for which 60% of particles are smaller
d985 fine fraction of the PSD curve
EQPCLS diameter of the circle of equal projection area from laser
scanning data
FLSMIN minimum Feret diameter from laser scanning data FLS
MAX maximum Feret diameter from laser scanning data K0 coefficient of earth pressure at rest
Nc number of contacts
Np number of particles
p9 mean normal effective stress (¼(ó19þ2ó93)=3) q deviatoric stress (¼ó91ó93)
Z coordination number
ó91 axial effective stress ó93 radial effective stress
ö9 effective angle of shearing resistance
REFERENCES
Brown, A. J. & Bridle, R. C. (2009). Report on the European working group on internal erosion, St. Petersburg. Dams and Reservoirs19, No. 3, 133–136.
0 2 4 6 8 10 12
0 2 4 6 8
Coordina
tion number
,
Z
Kézdi (D⬘15/d⬘85 max)
WG CTμ
G1 CTμ
[image:7.595.58.292.44.233.2]G2 CTμ μCT trendline Data from Shire & O’Sullivan (2013) Trendline from Shire & O’Sullivan (2013)
Fig. 5. Comparison of Ke´zdi criterion with coordination number
0·2 0·4 0·6 0·8 1·0
0 1 2 3 4 5 6 7 8 9 10 11 12
V
oid r
a
tio
,
e
Coordination number,Z
WG CTμ
G1 CTμ
G2 CTμ
Fonsecaet al. (2013b)
Fonsecaet al. trendline:e⫽1·69 exp⫺0·14z Shire & O’Sullivan (2013)
Fig. 6. Variation of void ratio with coordination number
[image:7.595.68.284.471.761.2]BSI (1986). Specification for test sieves. London, UK: BSI. Burenkova, V. V. (1993). Assessment of suffusion in non-cohesive
and graded soils. In Proceedings of the 1st international con-ference ‘Geo-filters’, filters in geotechnical engineering (eds J. Brauns, M. Heibum and U. Schuler), pp. 357–360. Rotterdam, The Netherlands: Taylor and Francis.
Chang, D. S. & Zhang, L. M. (2013). Extended internal stability criteria for soils under seepage. Soils Found. 53, No. 4, 569– 583.
Chevalier, B. & Otani, J. (2011). Arching observation in three-dimensional trapdoor problem with X-ray CT and discrete element method.Soils Found.51, No. 3, 459–469.
Fell, R. & Fry, J. J. (2007). The state of the art of assessing the likelihood of internal erosion of embankment dams, water retaining structures and their foundations. InInternal erosion of dams and their foundations: Selected and reviewed papers from the workshop on internal erosion and piping of dams and their foundations, Aussois, France. Rotterdam, the Netherlands: Taylor & Francis Group.
Fonseca, J. (2011). The evolution of morphology and fabric of a sand during shearing. PhD thesis, Imperial College London, University of London, London, UK.
Fonseca, J., O’Sullivan, C., Coop, M. R. & Lee, P. D. (2012). Non-invasive characterisation of particle morphology of natural sands.Soils Found.52, No. 4, 712–722.
Fonseca, J., O’Sullivan, C., Coop, M. R. & Lee, P. D. (2013a). Quantifying the evolution of soil fabric during shearing using directional parameters.Ge´otechnique63, No. 6, 487–499. Fonseca, J., O’Sullivan, C., Coop, M. R. & Lee, P. D. (2013b).
Quantifying the evolution of soil fabric during shearing using scalar parameters.Ge´otechnique63, No. 10, 818–829.
Hall, S., Bornert, M., Desrues, J., Pannier, Y., Lenoir, N., Viggiani, G. & Be´suelle, P. (2010). Discrete and continuum analysis of localised deformation in sand using X-ray microCT and volu-metric digital image correlation.Ge´otechnique60, No. 5, 315– 322.
Hasan, A. & Alshibli, K. (2010). Experimental assessment of 3D particle-to-particle interaction within sheared sand using synchrotron microtomography. Ge´otechnique 60, No. 5, 369– 379.
Homberg, U., Baum, D., Prohaski, S., Kalbe, U. & Witt, K. J. (2012). Automatic extraction and analysis of realistic pore structures from ìCT data for pore space characterization of graded soil.Proceedings of the 6th international conference on scour and erosion, ICSE6, Paris, France, electronic proceedings.
London, UK: International Society of Soil Mechanics and Geotechnical Engineering (ISSMGE).
Indraratna, B., Raut, A. K. & Khabbaz, H. (2007). Constriction-based retention criterion for granular filter design. J. Geotech. Geoenviron. Engng133, No. 3, 266–276.
Jaky, J. (1944). The coefficient of earth pressure at rest. J. Soc. Hungarian Architects Engrs, Budapest, HungaryOctober, 355– 358.
Jang, D. J., Frost, J. D. & Park, J. Y. (1999). Preparation of epoxy impregnated sand coupons for image analysis. Geotech. Testing J.22, No. 2, 147–158.
Kenney, T. C., Chahal, R., Chiu, E., Ofoegbu, G. I., Omange, G. N. & Ume, C. A. (1985). Controlling constriction sizes of granular filters.Can. Geotech. J.22, No. 1, 32–43.
Kenney, T. C. & Lau, D. (1985). Internal stability of granular filters.
Can. Geotech. J.22, No. 2, 215–225.
Kenney, T. C. & Lau, D. (1986). Internal stability of granular filters: reply.Can. Geotech. J.23, No. 3, 420–423.
Ke´zdi, A. (1979). Soil physics: selected topics. Amsterdam, The Netherlands: Elsevier.
Krumbein, W. C. (1941). Measurement and geological significance of shape and roundness of sedimentary particles. Journal of Sedimentary Petrology11, No. 2, 64–72.
Minh, N. H. & Cheng, Y. P. (2012). A DEM investigation of the effect of particle-size distribution on one-dimensional compres-sion.Ge´otechnique63, No. 1, 44–53.
Otsu, N. (1975). A threshold selection method from gray-level histograms.Automatica11, No. 285–296, 23–27.
Palmer, S. N. & Barton, M. E. (1986). Avoiding microfabric disruption during the impregnation of friable, uncemented sands with dyed epoxy.J. Sedimentary Petrology56, No. 4, 556–557. Pinson, D., Zou, R. P., Yu, A. B., Zulli, P. & McCarthy, M. J.
(1998). Coordination number of binary mixtures of spheres.
J. Phys. D: Appl. Phys.31, No. 4, 457–462.
Shire, T. & O’Sullivan, C. (2013). Micromechanical assessment of filter stability criterion.Acta Geotechnica8, No. 1, 81–60. Sneed, E. D. & Folk, R. L. (1958). Pebbles in the Lower Colorado
River, Texas: A study in particle morphogenesis. Journal of Geology66, 114–150.
Sympatec (2012). http://www.sympatec.com/EN/ImageAnalysis/ Fundamentals.html (accessed 01/11/2013).