City, University of London Institutional Repository
Citation: Überall, Christian (2012). A dynamic multi-algorithm collaborative-filtering
system. (Unpublished Doctoral thesis, City University London)This is the unspecified version of the paper.
This version of the publication may differ from the final published
version.
Permanent repository link: http://openaccess.city.ac.uk/1964/
Link to published version:
Copyright and reuse: City Research Online aims to make research
outputs of City, University of London available to a wider audience.
Copyright and Moral Rights remain with the author(s) and/or copyright
holders. URLs from City Research Online may be freely distributed and
linked to.
City Research Online: http://openaccess.city.ac.uk/ [email protected]
School of Engineering and Mathematical Sciences
A Dynamic
Multi-Algorithm
Collaborative-Filtering
System
PhD Thesis
Supervisior: Dr. Muttukrishnan Rajarajan Supervisior: Prof. Dr. Rudolf J¨ager Second Supervisior: Dr. Veselin Rakocevic
by
Table of Contents
1 Introduction 1
1.1 Problem Statements and Motivation . . . 6
1.2 Objectives of the Thesis . . . 9
1.2.1 Prediction accuracy improvement . . . 10
1.2.2 Research and development of a new recommendation system . . . 10
1.2.3 Evaluation by the usage of small and large datasets . . 11
1.3 Contribution . . . 12
1.4 Organization of the Thesis . . . 14
2 Background and Related Work 15 2.1 User Profiling . . . 17
2.2 Filtering . . . 22
2.2.1 Content-Based Filtering . . . 22
2.2.2 Collaborative Filtering . . . 22
2.2.2.1 Collaborative-Filtering Algorithms . . . 24
2.2.2.2 Existing Systems and Approaches . . . 37
2.2.3 Hybrid Recommendation Systems . . . 46
2.3 Presentation of Recommendations . . . 50
2.4 Summary . . . 54
3 Methodology 55 3.1 Home Environment . . . 56
3.2 Datasets - User-Item Matrices . . . 57
3.3 User Profiling . . . 58
3.4 Filtering Techniques . . . 60
3.4.1 Content-Based Filtering . . . 60
3.4.2 Collaborative Filtering . . . 61
3.4.2.1 Filtering Algorithms . . . 61
3.4.2.2 Prediction . . . 62
3.4.2.3 Error Rates . . . 62
3.4.2.4 K-Nearest Neighbours . . . 63
3.5 Metadata . . . 64
3.5.1 Digital Video Broadcast . . . 64
3.5.2 YouTube . . . 65
3.6 Evaluation . . . 66
3.6.1 Prediction Truncation . . . 67
3.6.2 Without Neighbourhood . . . 68
3.6.2.1 Survey . . . 68
3.6.2.2 MovieLens . . . 69
3.6.2.3 Performance . . . 69
3.6.3 With Neighbourhood . . . 70
3.6.4 Dynamic Selection . . . 70
4 Recommendation System 73
4.1 User Profiling . . . 75
4.1.1 Explicit Profiling . . . 75
4.1.2 Implicit Profiling . . . 78
4.1.2.1 Recommendation Index - General . . . 79
4.1.2.2 Recommendation Index - Average . . . 81
4.1.2.3 Recommendation Index - Adjustment . . . 83
4.1.2.4 Recommendation Index - Mix . . . 84
4.2 Content-Based Filtering . . . 85
4.2.1 Recommendation Index - Final . . . 85
4.3 Dynamic Multi-Algorithm Collaborative-Filtering System . . . 89
4.3.1 Newly Developed Collaborative-Filtering Algorithms . 90 4.3.1.1 Absolute Correlation . . . 90
4.3.1.2 Absolute Rank Correlation . . . 93
4.3.1.3 Absolute Original Rank Correlation . . . 96
4.3.1.4 Cosine Co-Rated Similarity . . . 98
4.3.1.5 Cosine Rank Similarity . . . 99
4.3.1.6 Cosine Rank Co-Rated Similarity . . . 100
4.3.1.7 Absolute Cosine Similarity . . . 101
4.3.1.8 Absolute Cosine Co-Rated Similarity . . . 103
4.3.1.9 Absolute Cosine Rank Similarity . . . 104
4.3.1.10 Absolute Cosine Original Rank Similarity . . 106
4.3.1.13 Adjusted Cosine Rank Similarity . . . 112
4.3.1.14 Overview . . . 114
4.3.2 K-Nearest Neighbours . . . 115
4.3.3 Prediction Calculations . . . 116
4.3.3.1 Prediction Truncations . . . 116
4.3.4 Error Calculations . . . 117
4.3.5 Dynamic Selection of Most Accurate Algorithm . . . . 118
4.4 Summary . . . 121
5 Evaluation 122 5.1 Prediction Truncation . . . 124
5.1.1 Conclusion . . . 127
5.2 Without Neighbourhood . . . 128
5.2.1 Survey . . . 128
5.2.1.1 Item-Based . . . 128
5.2.1.2 User-Based . . . 135
5.2.2 MovieLens . . . 142
5.2.2.1 Performance - MovieLens . . . 149
5.2.3 Performance . . . 154
5.2.4 Conclusion . . . 161
5.2.4.1 Error Rates . . . 161
5.2.4.2 Performance . . . 161
5.3 With Neighbourhood . . . 163
5.3.1 Survey . . . 163
5.3.1.2 User-Based . . . 165
5.3.2 MovieLens . . . 166
5.3.2.1 Item-Based . . . 166
5.3.2.2 User-Based . . . 174
5.3.2.3 Performance . . . 182
5.3.3 Conclusion . . . 185
5.3.3.1 Error Rates . . . 185
5.3.3.2 Performance . . . 185
5.4 Dynamic Selection . . . 187
5.4.1 Showing the Need . . . 187
5.4.2 Survey . . . 189
5.4.2.1 Item-Based . . . 189
5.4.2.2 User-Based . . . 190
5.4.2.3 Performance . . . 191
5.4.3 MovieLens . . . 192
5.4.3.1 Item-Based . . . 192
5.4.3.2 User-Based . . . 194
5.4.3.3 Performance . . . 196
5.4.4 Conclusion . . . 197
5.4.4.1 Error Rates . . . 197
5.4.4.2 Performance . . . 197
5.5 Comparison . . . 198
5.6 Summary . . . 199
6.1 Login . . . 202
6.2 Viewing Content Related to the Current Event . . . 204
6.3 Searching for Repeats of Current Event . . . 207
6.4 Adding Current Event to Favourites . . . 207
6.5 Viewing Recommendations . . . 207
6.6 Viewing Recommendations for Today . . . 209
6.7 Setting/Configuring Preferences . . . 209
6.8 Viewing of Collaborative Recommendations . . . 210
6.9 Searching for an Event . . . 211
6.10 Summary . . . 212
7 Conclusion and Future Work 213 7.1 Future Work . . . 218
Bibliography A
List of Tables
Table 2.1 Co-Rated . . . 24
Table 2.2 Spearman Rank Building . . . 29
Table 2.3 Spearman Ranks . . . 30
Table 2.4 Similarity Values . . . 37
Table 2.5 Ranked Similarity Values . . . 38
Table 2.6 Error Rates - Related Work . . . 45
Table 3.1 Survey - User-Item Matrix . . . 58
Table 3.2 Item-Genre Table . . . 59
Table 3.3 Example - User Ratings . . . 63
Table 4.1 Subgenres of the Genre: Movie/Drama . . . 74
Table 4.2 Algorithms Overview . . . 114
Table 5.1 Abbreviations Algorithms . . . 123
Table 5.2 Performance - f(x) . . . 160
List of Figures
Figure 2.1 Recommendation Score - Procedure . . . 20
Figure 2.2 Pearson-r Correlation - User 1 and User 2 . . . 25
Figure 2.3 Pearson-r Correlation - Linear Correlations . . . 26
Figure 2.4 Spearman Rank Correlation - Monotonic Function . . . 32
Figure 2.5 Cosine Similarity - Vector Graph . . . 33
Figure 2.6 AVATAR - Ontology . . . 47
Figure 2.7 Amazon - Recommendations . . . 51
Figure 2.8 YouTube - Recommendations . . . 52
Figure 2.9 Recommendation Interface . . . 53
Figure 3.1 HomeVision - Media Convergent Service Environment . 56 Figure 4.1 PPG - Explicit Settings . . . 76
Figure 4.2 Recommendation Index - General . . . 80
Figure 4.3 Recommendation Index - Average . . . 82
Figure 4.4 Recommendation Index - Adjustment . . . 84
Figure 4.5 Absolute Cosine Similarity - Vector Graph . . . 101
Figure 4.6 Dynamic Multi-Algorithm Collaborative-Filtering System118 Figure 5.1 Comparison Truncation - Item-Based . . . 125
Figure 5.2 Comparison Truncation - User-Based . . . 126
Figure 5.3 Survey - MAE - Item-Based - Users 1-10 . . . 129
Figure 5.4 Survey - MAE - Item-Based - Users 1-5 . . . 130
Figure 5.5 Survey - MAE - Item-Based - Users 6-10 . . . 131
Figure 5.6 Survey - MAE - Item-Based - Users 1,3,5,7,9 . . . 132
Figure 5.7 Survey - MAE - Item-Based - Users 2,4,6,8,10 . . . 133
Figure 5.8 Survey - MAE - Item-Based . . . 134
Figure 5.9 Survey - MAE - User-Based - Users 1-10 . . . 135
Figure 5.10 Survey - MAE - User-Based - Users 1-5 . . . 136
Figure 5.11 Survey - MAE - User-Based - Users 6-10 . . . 137
Figure 5.12 Survey - MAE - User-Based - Users 1,3,5,7,9 . . . 138
Figure 5.13 Survey - MAE - User-Based - Users 2,4,6,8,10 . . . 139
Figure 5.14 Survey - MAE - User-Based . . . 140
Figure 5.15 Survey - MAE - User-Based - Without AJCS . . . 141
Figure 5.16 MovieLens - MAE - Item-Based . . . 143
Figure 5.17 MovieLens - MSE - Item-Based . . . 144
Figure 5.18 MovieLens - RMSE - Item-Based . . . 145
Figure 5.19 MovieLens - MAE - User-Based . . . 146
Figure 5.20 MovieLens - MSE - User-Based . . . 147
Figure 5.21 MovieLens - RMSE - User-Based . . . 148
Figure 5.22 MovieLens - Performance - Item-Based . . . 150
Figure 5.23 MovieLens - Performance - User-Based . . . 151
Figure 5.24 MovieLens - Performance - Item-Based - Active User . . 152
Figure 5.25 MovieLens - Performance - User-Based - Active User . . 153
Figure 5.26 Performance - Without Neighbourhood . . . 155
Figure 5.28 Performance - Without Neighbourhood - Fast . . . 157
Figure 5.29 Performance - Without Neighbourhood - Slow . . . 158
Figure 5.30 Performance - Without Neighbourhood - Very Slow . . 159
Figure 5.31 Survey - Error Rates - Item-Based . . . 164
Figure 5.32 Survey - Error Rates - User-Based . . . 165
Figure 5.33 MovieLens - MAE - Item-Based - 10 Test Cycles . . . . 167
Figure 5.34 MovieLens - MSE - Item-Based - 10 Test Cycles . . . . 168
Figure 5.35 MovieLens - RMSE - Item-Based - 10 Test Cycles . . . 169
Figure 5.36 MovieLens - MAE - Item-Based - 50 Test Cycles . . . . 171
Figure 5.37 MovieLens - MSE - Item-Based - 50 Test Cycles . . . . 172
Figure 5.38 MovieLens - RMSE - Item-Based - 50 Test Cycles . . . 173
Figure 5.39 MovieLens - MAE - User-Based - 10 Test Cycles . . . . 175
Figure 5.40 MovieLens - MSE - User-Based - 10 Test Cycles . . . . 176
Figure 5.41 MovieLens - RMSE - User-Based - 10 Test Cycles . . . 177
Figure 5.42 MovieLens - MAE - User-Based - 50 Test Cycles . . . . 179
Figure 5.43 MovieLens - MSE - User-Based - 50 Test Cycles . . . . 180
Figure 5.44 MovieLens - RMSE - User-Based - 50 Test Cycles . . . 181
Figure 5.45 MovieLens - Performance - Item-Based . . . 183
Figure 5.46 MovieLens - Performance - User-Based . . . 184
Figure 5.47 MovieLens - MAE - User-Based . . . 188
Figure 5.48 Survey - Error Rates - Item-Based . . . 189
Figure 5.49 Survey - Error Rates - User-Based . . . 190
Figure 5.50 Survey - Performance . . . 191
Figure 5.51 MovieLens - Error Rates - Item-Based . . . 192
Figure 5.53 MovieLens - Error Rates - User-Based . . . 194
Figure 5.54 MovieLens - Error Rates - User-Based . . . 195
Figure 5.55 Dynamic - Performance . . . 196
Figure 5.56 Comparison - Existing and Proposed . . . 198
Figure 6.1 PPG - Login . . . 202
Figure 6.2 PPG - Main Menu . . . 203
Figure 6.3 PPG - Related Content . . . 204
Figure 6.4 PPG - Process Chart . . . 206
Figure 6.5 PPG - Recommendations . . . 208
Figure 6.6 PPG - Collaborative Choice . . . 210
List of Abbreviations
API Application Programming Interface AVATAR AdVAnced Telematic search of
Audiovisual contents by semantic
Reasoning
CPU Central Processing Unit
DOI Degree of Interest
DVB Digital Video Broadcast
DVB-C DVB-Cable
DVB-S DVB-Satellite
DVB-T DVB-Terrestrial
EIT Event Information Table EPG Electronic Program Guide
ETSI European Telecommunications Standards Institute
FTP File Transfer Protocol GUI Graphical User Interface
HDD Hard Disc Drive
IF Information Filtering
KNN K-Nearest Neighbour
MAE Mean Absolute Error
MSE Mean Square Error
OWL Web Ontology Language
PC Personal Computer
PHP Hypertext Preprocessor PPG Personal Program Guide
QoS Quality of Service
RAM Random Access Memory
RI Recommendation Index
RMSE Root Mean Square Error
ROM Read-Only Memory
SI Service Information
SotA State-of-the-Art
STB Set-Top-Box
SVD Singular Value Decomposition
THM Technische Hochschule Mittelhessen -University of Applied Sciences
TV Television
URL Uniform Resource Locator
USB Universal Serial Bus
VCR Video Cassette Recording
WWW World Wide Web
Acknowledgements
First of all I want to thank my wife and my family, who always supported me during the whole process. Secondly I want to thank Muttukrishnan Rajara-jan for the great supervision and the support as well. Rudolf J¨ager offered me the opportunity to do my research work. Without his commitment I would not have been able to do my PhD research work. Veselin Rakocevic also assisted me if I had any questions. Last but not least I want to thank Christopher K¨ohnen, who always helped me if I had any problems. All these persons really helped me to do my research work successfully and I am highly grateful for their support.
Declaration
I declare that the University Librarian is allowed to copy the presented the-sis in whole or in part without referencing me. The permission covers only single copies made for study purposes, subject to normal conditions of ac-knowledgement.
Date Christian ¨Uberall
Abstract
Nowadays users have access to an immense number of media content. They are able to consume thousands of Television (TV) channels and millions of video clips from online portals like YouTube. Due to the immense number of available content, users can have the problem to find content of interest. This problem can be solved by recommendation systems. For example, rec-ommendation systems can be used to create recrec-ommendations which fit to the preferences of users.
Recommendation systems can use two different approaches for the cre-ation of recommendcre-ations. They can take content-based and/or collaborative-filtering techniques into account. Content-based collaborative-filtering techniques use in-formation, the so-called metadata, that describe the content in more detail. Collaborative-filtering techniques calculate similarities e.g., between users. All users are included in a dataset, the so-called community. Generally the number of user profiles within the community is quite large. Examples of such huge communities are Amazon, Netflix, MovieLens, and LastFM. The community which includes the user profiles is used to create a user-item ma-trix. This user-item matrix contains the preferences from users on items e.g., movies, genres, book titles, and so forth.
The quality of the recommendations depends on the accuracy of the pre-dictions. As mentioned above, collaborative-filtering techniques calculate similarities e.g., between users. These similarities can be used to calculate predictions for an entry within the user-item matrix. If the predictions are close or equal to the preferences of a user, the used collaborative-filtering technique predicts accurately.
Generally recommendation systems only use one single collaborative-filtering algorithm for the similarity calculation. The research work of this thesis proves that a dynamic selection of the most accurate filtering algo-rithm by considering more algoalgo-rithms is able to increase the accuracy of the predictions significantly.
In order to increase the accuracy of predictions, this thesis presents a dynamic multi-algorithm collaborative-filtering system which creates recom-mendations for video content, such as movies or genres. This system is able to find the most accurate filtering algorithm by considering the k-nearest neighbours. These neighbours are selected by identifying the most similar users or items e.g., movies. Besides the dynamic selection, this thesis presents newly developed collaborative-filtering algorithms which are able to overcome researched weaknesses of state-of-the-art algorithms.
The evaluation of the proposed system considers a huge dataset from MovieLens and a small dataset from an undertaken survey. The consideration of a huge and a small dataset shall prove that the system can be used in both cases.
Chapter 1
Introduction
In the 1990s the available information and entertainment technologies in-creased exponentially. Users have access to hundreds of TV channels, thou-sands of videos from online portals, millions of books, news, web pages, im-ages, and CDs on the World Wide Web (WWW) [1, 2]. Due to this immense amount of available content, users are overloaded with information [3]. In or-der to filter the available information, recommendation systems have become important [2]. Recommendation systems use the Information Filtering (IF) technique to present and recommend items, such as books, movies, images, and so forth, that could be interesting to individual users [1]. An “item” is a term that is used to donate what a recommendation systems recommends to users [4]. They filter the content and create recommendations by the usage of different approaches.
Basically a recommendation system can create non-personalized and per-sonalized recommendations.
A recommendation system which creates non-personalized
tions offers identical recommendations to each user. These kind of recom-mendation systems creates recomrecom-mendations for e.g., products to customers based on the feedback of other customers. The recommendations are inde-pendent of the individual customer. Each customer gets the same recom-mendation [5]. Typical examples for those kind of recomrecom-mendations are the top ten selection of books, CD etc.
A personalized recommendation system creates the recommendations based on preferences which represents the likings on e.g., a specific movie, book, genre, and so forth. The preferences can be created in an implicit and in an explicit manner. A personalized recommendation system uses either the content-based approach, the collaborative-filtering approach, or a combination of these two approaches. The content-based approach uses the metadata which describes the content in more detail. For example, if a user prefers to watch documentaries, a recommendation system can per-sonalize the recommendations by taking this preference into account. The collaborative-filtering approach considers the preferences from several users for the creation of recommendations. The first system which used this ap-proach was introduced by Goldberg et al. [6].
However, this thesis focuses on personalized recommendation systems by the usage of collaborative-filtering techniques. The following paragraphs therefore describe the collaborative-filtering approach in more detail.
often within a range [0;5], where zero represents no interest and five definite interest. Generally this community contains a huge number of ratings. Ex-amples of huge communities are Amazon, Netflix, MovieLens, and LastFM. Recommendations are based on similarities between users or items. These similarities can be calculated by the usage of collaborative-filtering algo-rithms, such as the Pearson-r Correlation, the Spearman Rank Correlation, the Cosine Similarity, or the Adjusted Cosine Similarity. The similarities between users or items can be used to calculate predictions [8]. The result of the prediction calculation predicts a rating within the user-item matrix. With this technique entries of the user-item matrix can be predicted which are not rated yet. The calculation of the predictions can be performed by taking the Weighted Sum [9–12] approach into account. The predictions’ accuracy can be exploited by the usage of the Mean Absolute Error (MAE). Besides the MAE [10, 11, 13, 14], the Mean Square Error (MSE) or the Root Mean Square Error (RMSE) [12, 15–19] are also able to exploit the accuracy of the predictions. Besides the calculation of the predictions, the similarities can also be used to find the k-nearest neighbours. The k-nearest neighbours include users or items that are quite similar to the active user or active item [12].
the thesis proves that a dynamic selection of the most accurate collaborative-filtering algorithm can significantly reduce the error rates, such as the MAE, MSE, or the RMSE. This reduction of the error rates improves the predic-tions’ accuracy.
Besides these improvements, the presented thesis also shows up some investigated weaknesses of State-of-the-Art (SotA) collaborative-filtering al-gorithms. This thesis presents newly developed collaborative-filtering algo-rithms that overcome researched weaknesses of the Pearson-r Correlation, the Spearman Rank Correlation, the Cosine Similarity, and the Adjusted Cosine Similarity. The evaluation of this thesis proves the usefulness of the newly developed algorithms.
The main contribution is a researched and developed dynamic multi-algorithm collaborative-filtering system. It includes the mentioned SotA algorithms and newly researched and developed algorithms that are able to overcome researched weaknesses. The proposed system finds the most accurate filtering algorithm by taking the active user or active item and its k-nearest neighbours into account. The finding of the most accurate collaborative-filtering algorithm is realized by the exploiting of the error rates, such as the MAE, the MSE, and the RMSE. The algorithm which produces the lowest error rate will be proposed for further calculations.
existing approaches, which also use this dataset. In addition to the dataset from MovieLens, this thesis also considers a dataset from a survey. This dataset represents a small community. The user-item matrix which con-tains the ratings is presented in Table 3.1. The survey was undertaken at the Technische Hochschule Mittelhessen - University of Applied Sciences (THM). Each respondent was asked to rate genres that are specified by a European Telecommunications Standards Institute (ETSI) standard for Digital Video Broadcast (DVB) Service Information [20]. This ETSI standard specifies twelve main genres, that are delivered within the DVB Transport Stream. The setting of the ratings could be realized by using an interface [21, 22]. The respondents were able to set their preferences by setting stars. Five stars represent definite interest in the selected genre and zero stars represent no interest in the selected genre. These settings were saved as the explicit user profile.
1.1
Problem Statements and Motivation
information and they have the problem of finding content of interest in less time [27–30]. In order to overcome this problem, recommendation systems can be used to find content of interest.
Collaborative-filtering techniques can be used to generate recommenda-tions by using data from a community [31–40]. Existing approaches use data from huge communities such as MovieLens, Netflix, or LastFM. Typi-cally recommendation systems take one collaborative-filtering algorithm into account. Research studies of the presented thesis prove that the most ac-curate algorithm is strongly connected to the given user-item matrix, active user/item, and its neighbourhood. An algorithm, which performs the best results by considering an user-item matrix can provide the worst results by using another user-item matrix. Due to these facts the main challenge of this thesis is the research and development of a recommendation system that selects the most accurate algorithm which is strongly connected to the active user or item. Another disadvantage of existing approaches is the limita-tion of the evalualimita-tion by considering small datasets. As menlimita-tioned above, collaborative-filtering systems normally use a huge dataset. This thesis will also address user-item matrices which contain only a small number of users or items.
error rate of these predictions. They had to reduce the RMSE by about ten percent. Challengers who were able to produce the lowest RMSE, won 1,000,000 USD.
1.2
Objectives of the Thesis
Since the quality of a recommendation system is strongly connected to the accuracy of the predictions, this thesis will focus on the accuracy improve-ment by the usage of collaborative-filtering techniques. The proposed system shall be able to reduce the error rate significantly compared to existing ap-proaches. In addition, the proposed system shall be able to consider small and large datasets. The small dataset shall represent the preferences of, for example, a family, a block of flats, etc. The large environment shall represent a huge community, e.g., an online recommender, an online shop, etc. The usage of the two different sizes of the dataset shall show that the proposed system is not limited by the size of the community.
The objectives of this thesis are:
• Prediction accuracy improvement
• Research and development of a new recommendation system
1.2.1
Prediction accuracy improvement
The first objective of this thesis is the improvement of the predictions’ ac-curacy. The system shall be able to predict entries within the user-item matrix as exactly as possible. Since the predictions are calculated by the usage of the collaborative-filtering algorithms which deliver the similarity between users or items, this thesis presents state-of-the art and newly de-veloped collaborative-filtering algorithms which calculate these similarities. Therefore the presented thesis focuses on the improvement of the similarity calculation to improve the predictions’ accuracy.
1.2.2
Research and development of a new
recommen-dation system
1.2.3
Evaluation by the usage of small and large
datasets
1.3
Contribution
The contribution tackles the objectives of this thesis which includes the im-provement of the predictions’ accuracy, the research and development of a new recommendation system, and the evaluation of this new system. Basi-cally this thesis will present a dynamic multi-algorithm collaborative-filtering system which finds the most accurate algorithm dynamically. The single parts of the contribution are described below.
This system uses SotA filtering algorithms. These SotA collaborative-filtering algorithms are described in Section 2.2.2.1 in more detail. In addi-tion the dynamic multi-algorithm collaborative-filtering system also includes newly developed algorithms, which overcome researched weaknesses of the mentioned SotA existing algorithms. Section 4.3.1 presents these newly veloped algorithms. The evaluation of this thesis proves that the newly de-veloped collaborative-filtering algorithms which overcome researched weak-nesses are able to deliver more accurate similarities. Since the prediction calculation uses these similarities, the predictions’ accuracy is improved.
are quite similar to the active user or item. This neighbourhood is used to create a user-item matrix which contains the ratings from users on items. The user-item matrix is used to calculate predictions of the entries within the matrix. These predictions are used to exploit error rates, such as the MAE, the MSE, and the RMSE. The entire procedure is accomplished by taking each collaborative-filtering algorithm into account which is included into the proposed system. The output of the dynamic multi-algorithm collaborative-filtering system is the most accurate collaborative-filtering algorithm, which is strongly connected to the active user or item and its neighbourhood.
1.4
Organization of the Thesis
Chapter 2
Background and Related Work
With the introducing of the Internet in the 1990s users were able to get an immense variation of information. The result of the immense number of information is that users are overloaded with information [3]. During this time recommendation systems became important. Recommendation systems are used to filter the available information and present recommendations which fit to users’ preferences. These kind of systems are used in several fields. They are used by online shops, by large-scale image libraries, or by movie databases.
An example for a large-scale image library is Flickr which is a web page that shares images. Due to the immense number of images a searching for images with a special topic like landscape could be difficult. The paper from Jianping Fan et al. [41] tackles this problem. The system from the authors automatically generates a topic network which summarizes the large-scale collections of the images from Flickr at a semantic level. Additionally the system uses a hyperbolic visualization which enables an interactive
tion and exploration of the topic network e.g., users are able to select a image topic. The queries are used to search images within the topic network and to recommend most representive images for the given image topic.
Online shops also offers a lot of products. Amazon is an example for a huge online shop. They offer books, CDs, DVDs, clothes, TVs, and many more. In order to support users to find goods that could be interesting to them, Amazon generates recommendations. The industry paper from Greg Lindenet al.[42] presents the technique which is used to generate the recom-mendations on the Amazon web page. Amazon uses collaborative-filtering techniques for the creation of the recommendations. The recommendations are strongly connected to the interest of an individual user. Amazon matches each item of a user to similar items and combines those items into a recom-mendation list. The finding of similar items is realized by the usage of the
Cosine Similarity which is described below.
However, this thesis tackles the creation of recommendations by the usage of video content, such as DVB content and movies from MovieLens. The following sections present the related work which tackles the topics of this thesis. They are split into three main parts.
• User profiling
• Filtering
– Content-based filtering
– Collaborative filtering
• Presentation of recommendations
The main part of this thesis is the research and the evaluation of a newly developed dynamic multi-algorithm collaborative-filtering system. However, since the proposed system needs user profiles for the creation of recommen-dations, this chapter will also briefly introduce the reader to this topic. In addition, the presented recommendations are based on the content-based filtering and the collaborative-filtering approaches. Therefore, this chapter also briefly presents related work in this field. Finally, the recommendations are presented within an interface. This chapter introduces some existing interfaces which are able to present recommendations.
2.1
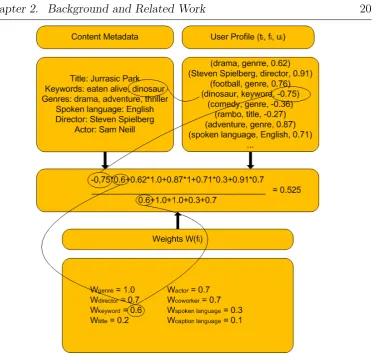
User Profiling
User profiles contain data from a user. A user profile can contain various data about a user, e.g. name of the user, set preferences, education, demographic information, and so forth. These profiles can be used to generate individual recommendations which are based on these profiles. The creation of the user profiles can be created in an implicit or explicit manner [43, 44]. The pre-sented thesis takes these approaches into account. The following publications present related works in this field.
etc. Each of these terms belongs to a field fi ∈ {Genre, Actor, Director,
Coworker, Keyword, Spoken Language, Title, Caption}. The system asso-ciates each of these terms with a user appreciation that is defined asui. This
user appreciation is in the range [-1,1]. The user profiles are saved in the database in a form of 3-tuples defined as (ti, fi, ui). The system ranks the
importance of the used metadata. For example, a genre is more significant than a keyword. In order to take this importance into account, the authors assign an importance factor Wi for each fieldfi. The system updates the
3-tuples in an explicit and implicit manner. The implicitly created user profile is created by logging the viewing behaviour. The system logs the time the user spends watching a video. The explicit user profile is updated by setting ratings. In addition, the user appreciation is updated by using Equation 2.1 if a 3-tuples is already in the user profile. Otherwise Equation 2.2 is used to create the user appreciation [45].
´
u= (1−α)·u+α·β (2.1)
Where ´u represents the new user appreciation of ti, u stands for the
represents the score from the implicit and explicit rating mechanism.
´
u=β (2.2)
The system from De Pessemier et al. extracts the information from the TV-Anytime metadata [46]. After this step the system checks which terms ti
are available in the user profile and the system calculates a recommendation score that is defined by Equation 2.3 [45].
S =
P
iui ·W(fi) P
iW(fi)
(2.3)
Figure 2.1 illustrates the procedure of the recommendation score calcula-tion in more detail.
Figure 2.1: Procedure of the recommendation score calculation defined by De Pessemier et al. [45]
The system from Hopfgartner et al. [47] takes the inverse exponential weighting from Campbellet al.[48] into account which is presented by Equa-tion 2.4.
aj =
1−C−j+1
Pjmax
k=2 1−C−k+1
(2.4)
are added recently get a higher weighting. The created recommendations are based on current interests. Therefore the recommendations represent the current preferences of the users. This behaviour could create a problem. For example, a user likes to watch soccer, which is broadcast every Saturday. After six months the soccer season takes a break for three months. After three months, the proposed system from Hopfgartner et al. will rate soccer quite low, because the user has not watched it for several month. In contrast to this paper, the presented approach of the thesis will decrease the implicitly logged Recommendation Index (RI), but the explicit settings will also be used for the creation of the recommendations.
2.2
Filtering
A recommendation system needs some kind of filtering techniques for the creation of recommendcreations. Basically three kinds of filtering approaches exist -the content-based filtering, collaborative filtering and hybrid approaches [50]. These three different approaches are described in the following sections. Since the main topic of this thesis tackles the collaborative-filtering approach, the content-based and the hybrid approach will be described only briefly.
2.2.1
Content-Based Filtering
Recommendation systems, which are based on content-based filtering tech-niques, use the metadata from the content for the creation of recommen-dations [51, 52]. For example, users can set their preferences in an explicit manner. They can set that they prefer a specific movie, like “It” from Stephen King. The recommendation system can use this information for the creation of the recommendations. The system can search for this title or for this director and recommend movies from Stephen King.
2.2.2
Collaborative Filtering
In contrast to content-based filtering, collaborative-filtering techniques use the data from a community for the creation of recommendations [52–55]. The system searches similar users or items [56–60], e.g. movies, and creates the recommendations based on these similarities.
the model-based and the memory-based approach [61].
The model-based approach considers just parts of the information. This approach develops a model of user ratings. The model building is realized by machine learning algorithms, such as the Bayesian network, the clustering approach, or other rule-based approaches [7]. The Bayesian network formu-lates a model for probabilistic collaborative filtering [62]. Clustering models clusters data into similar items/users [62–64].
The memory-based approach uses the entire information from the user-item matrix, which contains the ratings from all users on selected user-items, e.g. movies. Systems, which use this approach typically try to find similar users or items - the so-called neighbourhood [7, 61, 65]. This technique is widely used and more popular [10].
2.2.2.1 Collaborative-Filtering Algorithms
This section presents existing collaborative-filtering algorithms, such as the
Pearson-r Correlation, theSpearman Rank Correlation, the Cosine Similar-ity, and the Adjusted Cosine Similarity. Besides the presentation of these algorithms, this section presents weaknesses of them.
Additionally this section presents the Weighted Sum approach which is used to calculate the predictions. The k-nearest neighbour approach and the calculation of error rates is described as well.
2.2.2.1.1 Pearson-r Correlation
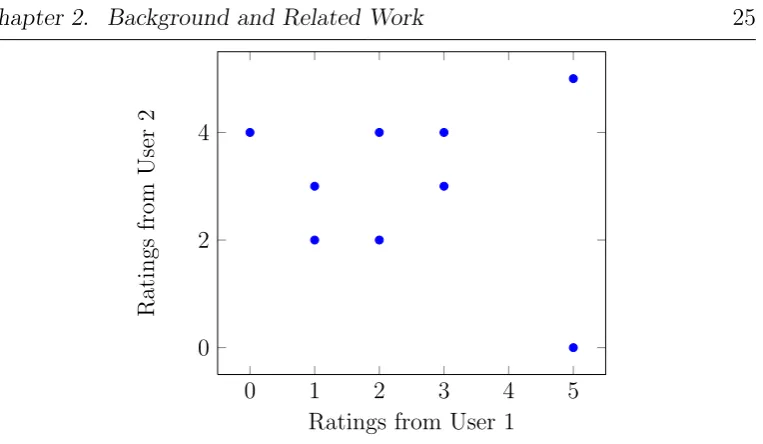
The Pearson-r Correlation calculates the linear correlation between two ob-jects [7, 9–11, 31, 36, 67]. It takes only the co-rated items into account. The co-rated items are the items that were rated by two users. Table 2.1 illus-trates some item ratings.
User 1 User 2 Item 1 5 5 Item 2 4
Item 3 3 3 Item 4 5 0 Item 5 0 4
Item 6 0
Item 7 1 2 Item 8 3 4 Item 9 2 4 Item 10 2 2 Item 11 1
Item 12 1 3
0 1 2 3 4 5 0
2 4
Ratings from User 1
Ratings
from
User
[image:44.595.113.495.101.323.2]2
Figure 2.2: The Pearson-r Correlation between User 1 and User 2 by consid-ering the item ratings
Since Item 2, Item 6, and Item 11 are not rated by two users, the Pearson-r CoPearson-rPearson-relation will not take these items into account. The results of the
Equation 2.5 defines the Pearson-r Correlation if the linear correlation between two items shall be calculated. Equation 2.6 defines the Pearson-r Correlation, if the user-based approach shall be used.
P Csim(i, j) = P
u∈U(Ru,i−Ri)(Ru,j−Rj) q
P
u∈U(Ru,i−Ri)2 q
P
u∈U(Ru,j−Rj)2
(2.5)
P Csim(i, j) is the linear correlation between itemiand item j. Ru,i is the
rating from user u of item i. Ru,j is the rating from user u of item j. Ri is
the average of the ratings from item i and Rj is the average of the ratings
from item j. u ∈ U is the summation of the users who rated both items i and j.
P Csim(u, v) = P
i∈I(Ru,i−Ru)(Rv,i−Rv) q
P
i∈I(Ru,i−Ru)2 q
P
i∈I(Rv,i−Rv)2
(2.6)
P Csim(u, v) is the linear correlation between user u and user v. Ru,i is
the rating from user u of item i. Rv,i is the rating from user v of item i. Ru
is the average of the ratings from user uand Rv is the average of the ratings
Weakness
2.2.2.1.2 Spearman Rank Correlation
The Spearman Rank Correlation is based on the Pearson-r Correlation
[7, 32, 69]. In contrast to the Pearson-r Correlation, the Spearman Rank Correlation converts the entries within the user-item matrix into ranks. The entire procedure of the rank building is shown by Table 2.2. This procedure considers the following ratings from a user user={5,4,3,5,0,2,1,3,2,2,1,1}.
In this example the first value from the ratings gets the highest index. At the beginning the procedure sorts the indexes by values in a decreasing order. This sorting is shown by the columns with the “Sort by value” header. After this step the system ranks the values as shown by the columns with the “Get rank” header. The last step of the procedure sorts the values and ranks by indexes.
Input Sort by value Get rank Sort by index
Index Value Index Value Index Value Rank Normalized Index Value Rank
12 5 12 5 12 5 12
(12+11)/2=11.5
12 5 11.5
11 4 9 5 9 5 11 11 4 10
10 3 11 4 11 4 10 10/1=10 10 3 8.5
9 5 10 3 10 3 9
(9+8)/2=8.5
9 5 11.5
8 0 5 3 5 3 8 8 0 1
7 2 7 2 7 2 7
(7+6+5)/3=6
7 2 6
6 1 4 2 4 2 6 6 1 3
5 3 3 2 3 2 5 5 3 8.5
4 2 6 1 6 1 4
(4+3+2)/3=3
4 2 6
3 2 2 1 2 1 3 3 2 6
2 1 1 1 1 1 2 2 1 3
1 1 8 0 8 1 1 1/1=1 1 1 3
Table 2.2: The procedure of the rank building by the usage of the Spearman Rank approach
objects. Equation 2.7 defines the Spearman Rank Correlation if the item-based approach is used and Equation 2.8 is used if the user-item-based approach is used.
User 1 Ranks User 1 User 2 Ranks User 2
Item 1 5 11.5 5 12
Item 2 4 10 4 9.5
Item 3 3 8.5 3 6
Item 4 5 11.5 0 1.5
Item 5 0 1 4 9.5
Item 6 2 6 0 1.5
Item 7 1 3 2 3.5
Item 8 3 8.5 4 9.5
Item 9 2 6 4 9.5
Item 10 2 6 2 3.5
Item 11 1 3 3 6
Item 12 1 3 3 6
Table 2.3: The ratings from two users on twelve items and the ranks which are created by the usage of the Spearman Rank Correlation
SRCsim(i, j) = P
u∈U(Rgu,i−Rgi)(Rgu,j−Rgj) q
P
u∈U(Rgu,i−Rgi)2 q
P
u∈U(Rgu,j −Rgj)2
(2.7)
SRCsim(i, j) is the rank correlation between item i and item j. Rgu,i is
the rank-rating from user u of item i. Rgu,j is the rank-rating from user u
who rated both items iand j.
SRCsim(u, v) = P
i∈I(Rgu,i−Rgu)(Rgv,i−Rgv) q
P
i∈I(Rgu,i−Rgu)2 q
P
i∈I(Rgv,i−Rgv)2
(2.8)
SRCsim(u, v) is the rank correlation between user u and user v. Rgu,i is
the rank-rating from user u of item i. Rgv,i is the rank-rating from user v
of item i. Rgu is the average of the rank-ratings from user u and Rgv is the average of the rank-ratings from user v. i∈I is the summation of the items that are rated by the users u and v.
In contrast to thePearson-r Correlation, the Spearman Rank Correlation
does not calculate the linear correlation between two objects, like users or items. It assesses whether the relationship can be described as a monotonic function, which is shown in Figure 2.4.
The figure shows a perfect monotonic function, since each of the variables is a perfect monotonic function of each other. In this case, theSpearman Rank Correlation is +1 or -1. The Pearson-r Correlation would not be +1 or -1, because it is not a perfect linear correlation.
Weakness
−6 −4 −2 0 2 4 6
−150
−100
−50 0 50 100 150
Ranked Ratings User 1
Rank
ed
Ratings
User
[image:51.595.149.447.114.330.2]2
Figure 2.4: Spearman Rank Correlation - monotonic function between the ranked ratings two users
2.2.2.1.3 Cosine Similarity
The cosine angle between two vectors can be computed by the usage of the
Cosine Similarity [10, 31, 36, 38]. Figure 2.5 presents two vectors in a two-dimensional room. α is the cosine angle between these two vectors. The results of theCosine Similarity are in the range [0;1], where 1 represents full similarity, and 0 no similarity between the angle of the two vectors. The calculation which takes the item-based approach into account is defined by Equation 2.9. Equation 2.10 is used if the user-based approach is considered.
-x 6 y User 1
*User 2
α
Figure 2.5: Two vectors which are created by the usage of the user’s ratings in a two-dimensional room
CSsim(i, j) =
~i·~j ~i · ~j (2.9)
CSsim(i, j) is the similarity between the two vectors iand j.~irepresents
the vector of i and~j is the vector of j.~i·~j is the dot product from vector i and vector j.
~i
is the magnitude of vector i and ~j
vector~j.
CSsim(u, v) =
~ u·~v
k~uk · k~vk (2.10)
CSsim(u, v) is the similarity between the two vectorsuandv. ~urepresents
the vector of u and ~v is the vector ofv. ~u·~v is the dot product from vector u and vector v. k~uk is the magnitude of vector u and k~vk is the magnitude of the vector ~v.
Weakness
2.2.2.1.4 Adjusted Cosine Similarity
In contrast to the above mentioned approaches, theAdjusted Cosine Similar-ity considers the average of the ratings from users/items [10, 12]. The results of theAdjusted Cosine Similarity are in the range [-1;+1]. -1 represents a full negative similarity, 0 no similarity, and 1 full positive similarity. Equation 2.11 is used if the item-based approach is used. Equation 2.12 performs the calculation if similarities between users shall be calculated.
AJ CSsim(i, j) = P
u∈U(Ru,i−Ru)(Ru,j−Ru) q
P
u∈U(Ru,i−Ru)2 q
P
u∈U(Ru,j −Ru)2
(2.11)
AJ CSsim(i, j) is the correlation between item i and item j. Ru,i is the
rating from user u of item i. Ru,j is the rating from user u of item j. Ru is
the average of the ratings from user u. u∈U is the summation of the users who rated both items iand j.
AJ CSsim(u, v) = P
i∈I(Ru,i−Ri)(Rv,i−Ri) q
P
i∈I(Ru,i−Ri)2 q
P
i∈I(Rv,i−Ri)2
(2.12)
AJ CSsim(u, v) is the correlation between user u and user v. Ru,i is the
2.2.2.2 Existing Systems and Approaches
This section briefly presents the related studies of existing systems and ap-proaches, which use collaborative-filtering algorithms.
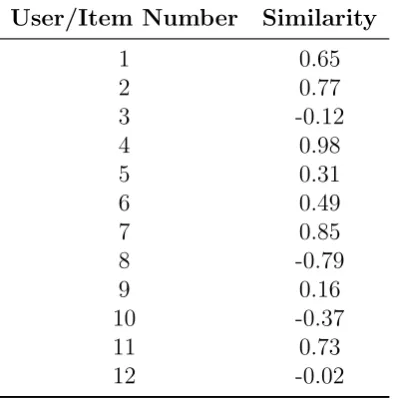
Herlocker et al. [7] apply an analysis framework that divides the neighbourhood-based prediction approach into three components. The three components are a similarity computation, a neighbour selection, and a rating combination. A neighbour selection, also known as the k-nearest neighbour approach, is described below. This approach is used from several researchers. Table 2.4 presents possible similarity results, which are achieved by compu-tation the similarities between the active user/item and all other users/items from a given user-item matrix. The table contains the number/position of the user within the user-item matrix and the similarity result.
User/Item Number Similarity
1 0.65
2 0.77
3 -0.12
4 0.98
5 0.31
6 0.49
7 0.85
8 -0.79
9 0.16
10 -0.37
11 0.73
[image:56.595.200.397.432.632.2]12 -0.02
Table 2.4: The similarity values between an active user or item and other users/items
de-creasing order. Table 2.5 presents the five-nearest neighbours. The authors
User/Item Number Similarity
4 0.98
7 0.85
2 0.77
11 0.73
1 0.65
Table 2.5: The similarity values between an active user or item and other users/items which are ranked in decreasing order
use data from the movie recommendation site MovieLens. The calculations of similarities are realized by thePearson-r Correlation,Spearman Rank Corre-lation, and the Mean Squared Difference. The evaluation of the system uses the MAE which is defined by Equation 2.13.
M AE =
PN
i=1|pi−qi|
N (2.13)
pi is the prediction andqi is the true value. Their experiments show that the
performance of the Pearson-r Correlation and the Spearman Rank Correla-tion are better than those of the Mean Squared Difference. The Pearson-r Correlation and theSpearman Rank Correlationhave almost the same results (MAE of ≈0.74), but the authors recommend thePearson-r Correlation for performing the calculations. The authors do not consider the user-based ap-proach. In addition, the authors do not present the results of the tests by using theCosine Similarity. The thesis presents the results, which have been achieved by using the other collaborative-filtering techniques as well.
Simi-larity, and the Adjusted Cosine Similarity for the calculation of similarities. The authors use the item-based approach for their calculations. The evalua-tion is realized by the usage of the dataset from MovieLens [70]. This dataset is used to create reduced user-item matrices randomly. The accuracy of the predictions is exploited by the usage of the MAE [10, 11, 13]. The authors use the Weighted Sum [9–11] approach for the prediction calculation. This approach is defined by Equation 2.14.
Pa,i=ra+ P
u∈U(ru,i−ru)·sima,u P
u∈U|sima,u|
(2.14)
Pa,iis the prediction of the active user a for itemi(e.g. a genre or a movie).
ra represents the average of the ratings of the active usera. ru,i is the rating
of user u for item i. ru represents the average of the ratings from user u
without the rating of item i. sima,u represents the similarity between the
active user a and user u. This approach can also be used for the item-based approach. It is equivalent. The evaluation of this paper shows that the
Adjusted Cosine Similarity produces the lowest MAE. It delivers a MAE of ≈ 0.72. In contrast to this paper, the presented thesis also considers the user-based approach. In addition, the thesis also presents newly developed algorithms that are able to produce a lower error rate than the system from these authors.
by using different levels of sparsity and different thresholds. The evaluation of this paper shows that the predictions that have been achieved by taking the item-based approach into account, which have been derived by explic-itly set preferences, deliver the best performance. The system of Papegelis and Plexousakis delivers a MAE of ≈ 0.84. However, this paper does not compare the results with other widely used algorithms. It only considers the
M SE = 1 N
N X
i=1
(pi−qi)2 (2.15)
pi is the prediction and qi is the true value.
The RMSE includes the MSE for its calculation. It is the square root of the MSE.
RM SE =
v u u t
1 N
N X
i=1
(pi−qi)2 (2.16)
pi is the prediction and qi is the true value.
The paper from Mart´ın-Vincente et al. [34] uses a semantic approach, which builds implicit trust networks that can be applied in collaborative recommendation systems. It obtains trust relations from a record of results by considering previous recommendations and by exploiting the interaction with the system. The authors use a TV ontology that is presented in a paper from Blanco-Fernandez et al. [71]. The proposed system from the authors uses the information to build relations between the users. Unfortunately the authors do not compare their results with other existing systems.
items. The thesis does not use the matrix factorization. However, the pro-posed system of this thesis is able to produce a RMSE which is significantly below the error rate of the system from these authors.
The recommendation system from Liang-hao and Lin-hao [40] is based on users. The system uses the Cosine Similarity and the Pearson-r Corre-lation for the similarity calculation. The similarities are used to calculate predictions by using the Weighted Sum approach. The authors also use the k-nearest neighbour approach, which finds the neighbourhood that contains similar users. The exploiting of the system is realized by the usage of the MAE. The authors evaluate their system with a dataset from MovieLens. The system of the authors produces a MAE of ≈0.80. However, in contrast to this paper, the proposed system of this thesis uses a dynamic selection of the most accurate collaborative-filtering algorithm. Besides this fact the thesis also presents results by using the item-based approach. In addition the evaluation of the thesis proves that the error rate of the proposed system is significantly lower than the error rate from the system of Liang-hao and Lin-hao.
The system from Caoet al. [14] uses a novel matrix factorization system. This system includes an efficient learning algorithm and prediction strategies. The authors use datasets from MovieLens, Netflix, and EachMovie to eval-uate their system. The evaluation is based on the calculation of the MAE. The system delivers a MAE of≈0.75. However, the proposed system of this thesis is able to deliver a lower MAE compared to the system from Cao et al.
big event. Netflix initiated a competition in 2006. The aim of this com-petition was the improvement of the predictions’ accuracy of collaborative filtering systems. The challengers were asked to decrease the RMSE of the calculated predictions. The competition ended in 2009. Netflix offers a pro-cess prize of 50,000 USD every year. The grand prize in 2009 was 1,000,000 USD. The winner of this competition was able to reduce the RMSE to 0.8567. The following publications consider the dataset from Netflix and present their approaches.
The system from Bell and Koren [18] enhances the neighbour-based ap-proach. It removes so-called “global effects”. This approach helps the au-thors to make the ratings more comparable. The result of this approach is the improvement of the predictions’ accuracy. The authors also present a simultaneous derivation of interpolation weights. The k-nearest neighbours are identified by using the Pearson-r Correlation, which calculates similar-ities between objects. The system from the authors is able to reduce the RMSE to 0.8982.
The system from T¨oscher et al.[73] combines the regularized matrix fac-torization with the k-nearest neighbour approach. The similarities between the used data from Netflix is calculated by a variation of the Pearson-r Cor-relation. The proposed system from the authors is able to produce a RMSE of 0.9042.
(SVD) into account. In addition, the system from Wen performs some so-called postprocessing tricks, which are able to decrease the RMSE as well. The system is able to reduce the RMSE to 0.8930 by using a blending of Item-Based EM and the Sparse SVD. The author only considers the item-based approach. In contrast to this paper, the presented evaluation also considers the results by using the user-based approach.
The paper from T¨oscher et al.[16] presents the results of the system that won the grand prize of the Netflix competition. The paper compares differ-ent approaches, which have been researched by the authors. The authors presents the results by using the k-nearest neighbour approach in combina-tion with collaborative-filtering algorithms, such as the Pearson-r Correla-tion, the Spearman Rank Correlation, the Set Correlation, the MSE Correla-tion, and the Ratio Correlation. In addition to these techniques, the authors also researched other kinds of techniques, like several kinds of SVD and ma-trix factorizations. The lowest RMSE was achieved by using the mama-trix factorization. The authors were able to reduce the RMSE to 0.8567.
The main difference of other research works and the proposed system in this thesis is the dynamic choice of the most accurate collaborative-filtering algorithm. The system is able to select the most accurate filtering algorithm, which is strongly connected to the active user/item and its neighbourhood. To the best of my knowledge, the proposed approach has never been realized before.
Author Algorithm MAE RMSE Dataset Sawaret al.[10] Adjusted Cosine and neighbour selection ≈0.72 MovieLens Papegelis and Plexousakis [11] Pearson-r ≈0.84 own dataset Herlockeret al.[7] Pearson-r and neighbour selection ≈0.74 MovieLens
Krishnanet al.[15] Cosine ≈0.87 MovieLens
Liang-hao and Lin-hao [40] Cosine and Pearson-r and neighbour selection ≈0.80 MovieLens
Caoet al.[14] Matrix Factorization ≈0.75 MovieLens
Zhanget al.[72] Matrix Factorization ≈0.87 MovieLens T¨oscheret al.[16] Matrix Factorization ≈0.85 Netflix Wen [17] Item-Based EM and Sparse SVD ≈0.89 Netflix Bell and Koren [18] Pearson-r and neighbour selection ≈0.89 Netflix
Table 2.6: Error rates of existing systems and the dataset used for the eval-uation
which is significantly below these error rates.
2.2.3
Hybrid Recommendation Systems
Hybrid recommendation systems combine more than one technique [74]. They can consider the content-based, the collaborative-filtering approach, and other techniques [75]. This is quite useful, because each approach has some weaknesses, which can be minimized by combining these different ap-proaches. The following paragraphs will present the work which uses hybrid recommendation systems.
Mart´ınez et al. [39] propose a hybrid recommendation system that con-siders content-based and collaborative filtering algorithms. The authors use the SVD that is able to reduce the dimensions of a user-item matrix, which contains the ratings from users on items. The considered user profiles are extracted from a social network. The creation of the user profiles is realized by using the explicit settings. Users are ask to set their preferences explic-itly. Besides the explicit creation of the user profiles, the system also logs the behaviour in an implicit manner. The calculation of the similarities is performed by the usage of the Cosine Similarity. However, the proposed system of this thesis uses a selection of multiple SotA and newly developed algorithms.
The system from George Lekakos and Petros Caravelas [76] uses a hybrid approach for the creation of movie recommendations. The authors use the
the Cosine Similarity. The system is able to consider metadata, like cast, directors, writers, producers, and the genre and the plot words. Each movie is represented as a vector and the Cosine Similarity computes similarities between these vectors. The used algorithm is an extension of the top-N item-based algorithm, which is presented in [77].
The AdVAnced Telematic search of Audiovisual contents by semantic
[image:66.595.126.470.418.630.2]Reasoning (AVATAR) system from Blancoet al.[78] considers collaborative-filtering algorithms and content-based collaborative-filtering methods. In addition, the proposed system uses its own ontology, as shown in Figure 2.6, to build a TV hierarchy. These kinds of ontologies can be used to structure information [79]. The TV ontology from the AVATAR system is described by the means of Web Ontology Language (OWL) [80].
Figure 2.6: AVATAR - Ontology [78]
In order to create recommendations, the AVATAR system calculates a Degree of Interest (DOI), which is defined by Equation 2.17 [78].
DOI(Cm) =
DOI(Cm+1)
1 + #sib(Cm+1)
(2.17)
DOI(Cm) is the superclass ofCm+1 and #sib(Cm+1) represents the num-ber of siblings of the class Cm+1.
The system calculates a matching. This matching takes the DOI and a semantic similarity into account. The matching is calculated by using Equation 2.18 [78]. Equation 2.19 defines the calculation of the semantic similarity [78].
match(a, U) = 1 #NU
#NU X
i=1
SemSem(a, ci)·DOI(ci) (2.18)
ci is the i-th content, which is defined in the user profile PU. DOI(ci)
represents the level of interest of U regarding ci. #Nu represents the total
number of programs included in PU.
by means of a factor α ∈[0,1].
SemSem(a, b) = α·SemSemInf(a, b) + (1−α)·SemSemHie(a, b) (2.19)
In addition to the proposed ontology, the AVATAR system also uses so-called semantic characteristics, like hasActor, hasActress, hasTopic, has-Time, hasPlace, etc. These characteristics permits the system to infer hidden knowledge in the used ontology. The proposed system calculates similarities by using the Pearson-r correlation.
2.3
Presentation of Recommendations
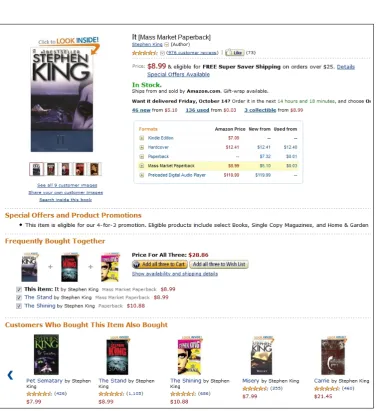
The presentation of recommendations is realized by a lot of online shops, music portals, video portals, etc. The online Internet shop Amazon presents recommendations as well. If a customer selects an article, Amazon presents similar articles. “Customers who bought this also bought...”, as shown in Figure 2.7. In addition, the users are able to see ratings from the related articles, which are based on users’ feedback.
A music portal named LastFM logs the playlists of users. With these playlists LastFM recommends other music tracks and plays them. LastFM offers also the opportunity for finding neighbours who have a similar user profile. Users can browse the neighbours’ playlists and can play tracks from related artists.
YouTube applies recommendation techniques [81]. For example, YouTube offers the opportunity for searching related videos. This feature helps users to have access to related videos without browsing the immense number of available video clips, as shown in Figure 2.8.
2.4
Summary
Chapter 3
Methodology
This chapter tackles the methodology of the thesis. Firstly it presents an environment which represents a home scenario. This home environment was used for the implementation. Secondly it presents the datasets which are used to evaluate the proposed dynamic multi-algorithm collaborative-filtering system. Thirdly it presents the techniques for the creation of the user profiles. Additionally the chapter presents the used filtering techniques and describes the calculation of the predictions and the error rates. Besides these aspects, the used metadata is described as well. Finally the evaluation of the proposed system is described.
3.1
Home Environment
The proposed dynamic multi-algorithm collaborative-filtering system of this thesis is partially implemented in a so-called home environment. Figure 3.1 illustrates a possible scenario of a home environment.
Figure 3.1: HomeVision - Media Convergent Service Environment
3.2
Datasets - User-Item Matrices
In order to evaluate the proposed system, the presented thesis considers two datasets.
One dataset is the result of a survey which was undertaken at the THM. Users were asked to set their preferences by rating genres. These genres are specified by an ETSI standard for Service Information [20]. Table 3.1 presents the results of this survey which are used to build the so-called user-item matrix. Ten users were asked to set their likings on specified DVB genres by setting a rating between 0 and 5. 0 represents no interest in the selected genre and 5 represents definite interest in the selected genre. In this user-item matrix a genre represents an item. The presented results from this survey use these specified main genres, which are shown as I1-I12 in Table 3.1. Table 3.2 illustrates which item belongs to which genre. This mentioned dataset represents a small group of users.
These preferences are saved as user profiles, which can be created in an implicit and an explicit manner.
U1 U2 U3 U4 U5 U6 U7 U8 U9 U10 I1 5 5 5 3 1 5 5 5 5 5
I2 4 4 4 3 1 5 2 4 5 5
I3 3 3 2 1 1 0 0 0 1 2
I4 5 0 1 1 4 1 0 5 5 4
I5 0 4 0 0 0 0 0 0 0 0
I6 2 0 0 0 3 1 2 3 3 2
I7 1 2 1 3 0 1 4 3 3 4
I8 3 4 3 3 0 3 1 0 4 4
I9 2 4 5 3 5 5 3 5 4 5
I10 2 2 4 0 4 4 0 2 3 4
I11 1 3 1 3 0 0 3 2 3 0
I12 1 3 2 3 5 0 0 2 3 0
Table 3.1: User-item matrix which includes the ratings from ten users on 12 genres (items) that is created by taking the results from the survey into account
3.3
User Profiling
The creation of the recommendations can be based on user profiles. These user profiles contain data which describe the preferences of a user in more detail. User profiles can contain data like gender, age, education, preferences, and so forth. Since the proposed system deals with movie recommendations, the presented thesis focuses on the preferences, which are represented with a value. This value is in the range [0;5], where 0 represents no interest and 5 definite interest in a selected item. Most of the existing systems in the field of movie recommendation systems which are based on collaborative-filtering techniques use this approach.
Item Genre
I1 Movie/Drama
I2 News/Current Affairs I3 Show/Game Show I4 Sports
I5 Children’s/Youth programmes I6 Music/Ballet/Dance
I7 Arts/Culture
I8 Social/Political issues/Economics I9 Education/Science/Factual topics I10 Leisure hobbies
I11 Other
I12 Undefined Content
Table 3.2: Assignment of the appreciations between the item number and the genres specified by ETSI
3.4
Filtering Techniques
In order to use the created user profiles for the recommendation creation, filtering techniques are used. The filtering techniques can be divided into two main approaches, the content-based filtering and the collaborative-filtering approach. These two different techniques will be described below. Since the main part of this thesis deals with the accuracy improvement by the usage of collaborative-filtering techniques, the content-based approach will be described only briefly.
3.4.1
Content-Based Filtering
Content-based filtering uses metadata, which describes the content in more detail [85, 86]. For example, a video clip from YouTube has a title, a de-scription, a duration, a category, and so forth. The content-based filtering approach uses this information for the filtering. For example, users are able to search for a video clip on YouTube by entering a title into a search bar. YouTube will search for this title within its database and present the search results to the user.
3.4.2
Collaborative Filtering
In contrast to the content-based filtering approach, the collaborative-filtering approach uses data from a community for the creation of the recommenda-tions. As mentioned above, the experiments of this thesis use the results from a survey, which represents a small dataset and a dataset from MovieLens, which represents a large dataset.
However, the presented dynamic multi-algorithm collaborative-filtering system uses several filtering algorithms, a method for the calculation of pre-dictions and an error analysis. In addition the presented system is able to use the k-nearest neighbour approach. These mentioned elements are briefly described in the following sections.
3.4.2.1 Filtering Algorithms
The proposed dynamic multi-algorithm collaborative-filtering system uses fil-tering algorithms, which are responsible for calculating similarities between users or items. If the recommendation engine calculates similarities between users, the user-based approach is used [87, 88]. The calculation of the simi-larities between items is called item-based [87–89]. Many publications which deal with collaborative-filtering systems use one of the following algorithms:
• Pearson-r Correlation
• Spearman Rank Correlation
• Cosine Similarity
These algorithms are described in Section 2.2.2.1 in more detail. The algorithms, except the Cosine Similarity, deliver a value between -1 and 1, where 1 represents full similarity between two objects, 0 represents no similarity, and -1 represents full negative similarity between two objects. The Cosine Similarity delivers a value between 0 and 1, while 0 represents no similarity and 1 full similarity between two objects. Besides these well-known algorithms, newly developed algorithms are presented too. These novel algorithms, which overcome researched weaknesses of the mentioned existing algorithms, are presented in Section 4.3.1.
3.4.2.2 Prediction
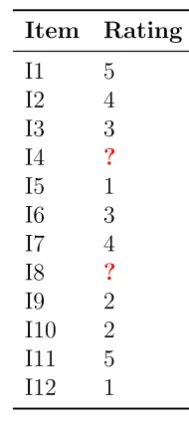
In order to predict an item (an entry within the user-item matrix) a method is needed which is able to calculate predictions. Table 3.3 illustrates the ratings from a user on items. Within this table the user has not set her/his prefer-ences for item numbers 4 and 8. These items shall be predicted. However, the presented thesis uses the Weighted Sum approach for the calculation of a prediction. This approach is described in Section 4.3.3 and Equation 2.14 defines the calculation of the predictions. Since the thesis focuses on the improvement of the predictions’ accuracy it does not tackle the well-known sparsity problem that refers to a situation that data are lacking [90].
3.4.2.3 Error Rates
Item Rating
I1 5 I2 4 I3 3 I4 ?
I5 1 I6 3 I7 4 I8 ?
[image:82.595.245.340.122.335.2]I9 2 I10 2 I11 5 I12 1
Table 3.3: Example of the ratings from a user on specified genres
a item within the user-item matrix. The equations are described in Section 4.3.4 in more detail. Since the proposed system shall be compared with existing recommendation systems, such as [7, 10, 11, 14–18, 40], the presented thesis uses these error rates.
3.4.2.4 K-Nearest Neighbours
3.5
Metadata
3.5.1
Digital Video Broadcast
DVB content is enriched with metadata. These metadata are called Service Information (SI) [20, 93]. The SI is sent within the DVB Transport Stream and is packed in tables. One table contains the metadata, which describes the content in more detail. This table is the Event Information Table (EIT) and contains metadata like:
• title of the events
• genre
• duration
• start time and end time
• start date
• ...


![Figure 2.9: Recommendation interface from Ardissono et al. [82]](https://thumb-us.123doks.com/thumbv2/123dok_us/1585039.111152/72.595.114.480.265.555/figure-recommendation-interface-ardissono-et-al.webp)