Open Access
Research
Gene expression in acute Stanford type A dissection: a comparative
microarray study
Barbara Theresia Weis-Müller
†1, Olga Modlich*
†2, Irina Drobinskaya
2,
Derya Unay
2, Rita Huber
1, Hans Bojar
2, Jochen D Schipke
3, Peter Feindt
4,
Emmeran Gams
4, Wolfram Müller
5, Timm Goecke
6and Wilhelm Sandmann
1Address: 1Department of Vascular Surgery and Kidney Transplantation, Heinrich-Heine-University of Düsseldorf, Düsseldorf, Germany, 2Department of Chemical Oncology, Heinrich-Heine-University of Düsseldorf, Düsseldorf, Germany, 3Research Group Experimental Surgery, Heinrich-Heine-University of Düsseldorf, Düsseldorf, Germany, 4Department of Thoracic and Cardiovascular Surgery, Heinrich-Heine-University of Düsseldorf, Düsseldorf, Germany, 5Pathology Starnberg, private pathological practice, Starnberg, Germany and 6Institute of Human Genetics, Heinrich-Heine-University of Düsseldorf, Düsseldorf, Germany
Email: Barbara Theresia Weis-Müller - [email protected]; Olga Modlich* - [email protected]; Irina Drobinskaya - [email protected]; Derya Unay - [email protected]; Rita Huber - [email protected]; Hans Bojar - [email protected]; Jochen D Schipke - [email protected]; Peter Feindt - [email protected]; Emmeran Gams - [email protected]@uni-duesseldorf.de; Wolfram Müller - [email protected]@uni-duesseldorf.de;
Timm Goecke - [email protected]; Wilhelm Sandmann - [email protected] * Corresponding author †Equal contributors
Abstract
Background: We compared gene expression profiles in acutely dissected aorta with those in normal control aorta.
Materials and methods: Ascending aorta specimen from patients with an acute Stanford A-dissection were taken during surgery and compared with those from normal ascending aorta from multiorgan donors using the BD Atlas™ Human1.2 Array I, BD Atlas™ Human Cardiovascular Array and the Affymetrix HG-U133A GeneChip®. For analysis only genes
with strong signals of more than 70 percent of the mean signal of all spots on the array were accepted as being expressed. Quantitative real-time polymerase chain reaction (RT-PCR) was used to confirm regulation of expression of a subset of 24 genes known to be involved in aortic structure and function.
Results: According to our definition expression profiling of aorta tissue specimens revealed an expression of 19.1% to 23.5% of the genes listed on the arrays. Of those 15.7% to 28.9% were differently expressed in dissected and control aorta specimens. Several genes that encode for extracellular matrix components such as collagen IV α2 and -α5, collagen VI α3, collagen XIV α1, collagen XVIII α1 and elastin were down-regulated in aortic dissection, whereas levels of matrix metalloproteinases-11, -14 and -19 were increased. Some genes coding for cell to cell adhesion, cell to matrix signaling (e.g., polycystin1 and -2), cytoskeleton, as well as several myofibrillar genes (e.g., α-actinin, tropomyosin, gelsolin) were found to be downregulated. Not surprisingly, some genes associated with chronic inflammation such as interleukin 2, -6 and -8, were up-regulated in dissection.
Conclusion: Our results demonstrate the complexity of the dissecting process on a molecular level. Genes coding for the integrity and strength of the aortic wall were down-regulated whereas components of inflammatory response were up-regulated. Altered patterns of gene expression indicate a pre-existing structural failure, which is probably a consequence of insufficient remodeling of the aortic wall resulting in further aortic dissection.
Published: 06 July 2006
Journal of Translational Medicine 2006, 4:29 doi:10.1186/1479-5876-4-29
Received: 20 March 2006 Accepted: 06 July 2006
This article is available from: http://www.translational-medicine.com/content/4/1/29
© 2006 Weis-Müller et al; licensee BioMed Central Ltd.
Background
Aortic dissection is a life threatening disease developing without any warning. Modern diagnostic methods, such as computed or magnetic resonance tomography, are able to show an aortic wall hematoma at the acute onset of the disease. This hematoma develops to aortic wall dissection over time. It is proposed that bleeding of the vasa vasorum
presents the first step of dissection [1,2]. Subsequently intimal tears in the aortic wall will develop later forming a connection within the aortic wall to the aortic blood stream, which at the end results in two blood stream chan-nels, the true and false aortic lumen.
Little is known about the underlying defects of aortic dis-section. Patients with heritable connective disorders, such as Marfan-syndrome patients with a defect of the glyco-protein fibrillin-1, and Ehlers-Danlos-syndrome patients with a type III-procollagen disorder are known to develop aortic dissection very early in their life [3-10]. However, only few patients with aortic dissection suffer from one of these syndromes as found in 134 Stanford A- and 158 Stanford B patients treated at our institution between 1984 and 2002. No patients with Ehlers-Danlos syn-drome were found and only 9 patients (3.1%) of this cohort fulfilled all criteria of a Marfan-syndrome. None-theless, it is notable that some of the dissection patients resembled Marfan patients in some aspects and demon-strated for example joint hypermobility or skin abnormal-ities [11]. Based on these observations the question arises: "Does an unknown connective tissue disorder cause a pre-disposition for aortic dissection?"
In order to answer this question, in 2002 we performed our first comparative molecular study of acutely dissected human aorta and normal control aorta based on measure-ments of gene expression [12]. This previous study was considered a pilot study with no quantitative real-time polymerase chain reaction (RT-PCR) being regarded as the gold standard to validate microarray data [13]. Following the editor's recommendation to pursue the study, in the given article we report the second expanded validation study on a molecular basis of acute dissected aortic dis-ease. Now, we focussed on specific cardiovascular genes and compared the results of two different membrane-based cDNA arrays (Clontech platform), GeneChip oligo-nucleotide microarray (Affymetrix platform) and real-time RT-PCR.
Patients, materials and methods
Patients' samples
For the Atlas array experiments, ascending aorta specimen were obtained from 8 patients operated on for acute Stan-ford type A aortic dissection (6 men 40, 41, 41, 49, 52, 54 years old and 2 women 52 and 63 years old; mean 57.5 ± 11.7 years) and from 8 multi organ donors (3 men 23, 42,
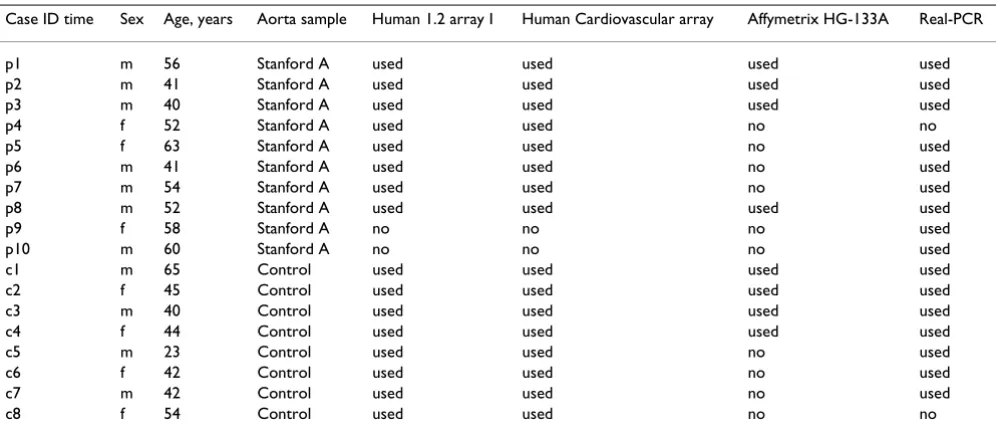
65 years old and 5 women 40, 42, 43, 45, 53 years old; mean 44.0 ± 11.9 years). For the Affymetrix array experi-ments, ascending aorta specimen were taken from 4 Stan-ford type A patients (4 men 40, 41, 52, 54 years old; mean 46.8 ± 7.3 years) and from 4 multiorgan donors (2 man 65 and 40 years old; mean 53 ± 14, and 2 women 42, 45 years old; mean 42.5 ± 2.8 years). Patients' demographics as well as specification in what experiment samples have been analyzed are shown in Table 1. Informed written consent was obtained from the patients or their relatives. Samples were "snap-frozen" in liquid nitrogen and were stored at -80°C. All studies were conducted under proto-cols approved by the University Review Board and the local Ethical Committee.
Total RNA isolation
Aorta tissue specimens were pulverized under liquid nitrogen, and total RNA was extracted from grinned tissue samples by cell lysis and subsequent binding to RNAeasy mini spin columns including DNase I treatment (Qiagen GmbH, Hilden, Germany). Subsequent washing and elu-tion steps were performed according to the manufacturer's protocol. Total RNA was quantified using UV spectropho-tometry (Photometer ECOM 6122, Eppendorf AG, Ham-burg, Germany) and the quality and integrity was confirmed by electrophoresis of 0.5 μg isolated RNA on 1% formamide agarose gels. Additionally, RNA specimens were analyzed by microcapillary electrophoresis on LabChips using the Agilent 2100 bioanalyzer (Agilent Technologies GmbH, Boeblingen, Germany) following the manufacturer's instructions.
Microarray experiments
Three different gene expression studies were carried out. For the first gene expression study, we used the BD Atlas™ Human1.2 Array I (Biosciences, Clontech Laboratories, Heidelberg, Germany) with 1,185 single spotted probes for known human genes. This set of genes was completed by a second study with the BD Atlas™ Human Cardiovascu-lar Array (BD Biosciences, Clontech Laboratories), which contains 597 double spotted probes for genes that are spe-cific for the cardiovascular system. Both arrays are mem-brane-based and need to be probed with radioactive labeled cDNAs. There are 138 genes in common between the two Atlas arrays. All samples applied with Human 1.2 arrays were used in experiments with Cardiovascular arrays. For genome wide screening of differentially expressed genes, a third gene expression study was per-formed using the Affymetrix Human Genome U133A Gene-Chip® with 22,283 features for human genes/ESTs. For
Atlas experiments, cDNA probe synthesis
Radiolabeled cDNAs were prepared from 5 μg of total RNA by incorporating 30 μCi [α-32P] dATP into cDNA by
reverse transcription using a gene specific primer mix (BD Biosciences Clontech) as described [12]. Incorporation rates were ~10%. Filter arrays (Atlas™ Human Broad I and Cardiovascular) were pre-hybridized ~1 h in a hybridiza-tion buffer (ExpressHyb, Clontech) and membranes were hybridized for 16–18 h at 68°C. After extensive washes membranes were exposed to a phosphor-imaging screen (Fuji Raytest, Inc.) for 48 h. Stripped and QC-checked membranes were reused for the next probe hybridization for maximum three hybridizations. Reproducibility of experiments was verified by comparing one hybridization experiment with the same or newly prepared probe on two or, in some cases, four different array membranes. The results showed good reproducibility within inde-pendent hybridizations with correlation coefficients between 0.90 and 0.98.
Atlas experiments, data analysis
Primary data collection and analysis were carried out using Phosphorimager (BAS-1500, Fuji, Raytest, Straubenhardt, Germany) and Aida software (Raytest). Thus, the amount of radioactivity on the membrane was measured by means of a phosphorimager and converted into corresponding gray levels of an image by the corre-sponding software. The gray levels are supposed to be lin-early correlated to the amount of the radioactivity on the filter. The linearity has been experimentally checked by comparison of measurements on a particular array during different exposure times (8, 16, 24, 32, and 48 h of the exposure of a filter to the phosphorimager screen). The 24
h exposure has been found appropriate to avoid the over-saturation of the radioactive spots corresponding to the most intensive signals. For each sample, we measured the pixel intensity of the 597 genes spotted in duplicates on single filter (Atlas Human Cardiovascular Array) or for 1,185 single-spotted probes (Atlas Human Total I) on two different filters. Radioactive intensity of each spot on the membrane was linearly digitized to gray scale with a pixel size of 100 μm. Data were obtained as a list of intensity values for all measured positions on the array. Areas of arrays with obviously overlapping signals and artifacts were manually excluded from further analyses. The back-ground signal was subtracted using Aida software and average pixel intensity for each pair of spots (or for each spot) was generated.
Normalization of signal intensities obtained from differ-ent hybridization experimdiffer-ents was based on the sum of background-subtracted signal data of all expressed genes (total intensity normalization). The total intensity nor-malization is one of wildly used techniques that can be used to normalize gene expression values from a single microarray [14]. This step was performed to account for differences in labeling and quality of RNA samples. Finally, mean values of intensity for each gene detected from multiple arrays were generated by the computer soft-ware as an average array.
Additionally, normalization using ubiquitin, cytoplasmic
beta-actin (ACTB) and 60S ribosomal protein L13A
[image:3.612.56.554.99.315.2](RPL13A) housekeeping genes' expression values has been applied to raw gene expression data and results were compared with those from the mean value normalization.
Table 1: Patients' demographics and usage in microarray experiments
The resulting table containing data for both normaliza-tion methods is available on the Website Cancer today [43].
Affymetrix human genome U133A GeneChip
The preparation and processing of labeled and frag-mented cRNA targets as well as GeneChip hybridization and scanning was carried out according to the manufac-turer's protocol (Affymetrix, Santa Clara, CA, USA) as described elsewhere [15]. Starting material for the labe-ling procedure was 5 μg of total RNA from each aortic specimen, and the labeling procedure was limited to one cycle of in vitro transcription. Synthesized and fragmented cRNAs were analyzed by electrophoresis using LabChips on Agilent 2100 Bioanalyzer. After washing and staining steps, arrays were scanned with Gene Array scanner 2500 (Affymetrix). Hybridization intensity data were automati-cally acquired and processed by Affymetrix Microarray Suite 5.0 software. The expression level (average differ-ence) for each gene was determined by calculating the average of differences in intensity (perfect match-mis-match) between its probe pairs as described elsewhere [16]. In order to normalize for sample loading and stain-ing variation, the average fluorescent intensities of all hybridization probes on an individual array were scaled to fixed target signal intensity TGT of 100 relative signal units (RSU).
The study reported in our manuscript complies with the Minimum Information About a Microarray Experiment (MIAME) guidelines established by the Microarray gene expression data society http://www.mged.org.
Quantitative Real-Time PCR (RT-PCR)
We followed one of the most striking recent develop-ments in the confirmatory studies issue [13] and authors are informed about the latest discussion concerning estab-lishing standards for microarray data annotation and rep-resentation [17]. In order to validate an array results for relevance, RT-PCR has been used.
Aliquots of the same total RNA as for microarray analysis were used for quantitative RT-PCR. Validation of arrays data has been performed for 24 differentially expressed genes. All analyses were performed using the ABI PRISM 7900 Sequence Detection System (Applied Biosystems, Foster City, CA, USA).
cDNAs for all PCR amplifications were generated by oligo-dT primed reverse transcription (Superscript First Strand System, Invitrogen Corporation, Carlsbad, CA, USA). Primers and probes were designed by the manufac-turer (Assays-on-Demand; Applied Biosystems, Foster City, CA, USA). RPLPO (Hs 9999902m1) and cyclophilin A (Hs 99999904m1) were selected as reference genes to
standardize the amount of sample RNA. The respective primer/probes were prepared by mixing 25 μl of the 100
μM stock solution "upper primer", 25 μl of the 100 μM stock solution "lower primer" with 12,5 μl of the 100 μM stock solution TaqMan-probe (FAM/TAMRA) and adjusted to 500 μl with H20 (primer/probe-mix). PCR reactions using cDNA generated from 20 ng of total RNA were performed in duplicates in a volume of 25 μl. This includes TaqMan universal Master Mix (Applied Biosys-tems) according to the manufacturer's protocols in 96-well format and 1.25 μl of the Probe&Primer mix. Ther-mal cycler parameters were 2 min at 50°C, 10 min at 95°C and 40 cycles, each consisting of a 15 s denaturation step at 95°C and a 1 min annealing/extension step at 60°C. Relative abundance of a gene transcript was calcu-lated by the ΔΔCt method.
Statistical analyses Student's t-test
Mean values were calculated for each gene from the con-trol and dissected cohorts of samples. Weak signals on the array close to background result usually in unfavorable signal-to-noise ratio and show low reproducibility between experiments. Ratios of differential gene expres-sion based on such values may be very high even when there is no significant difference in the expression level of the corresponding genes [14]. Therefore, only genes with a mean expression value of at least 70% of the mean expression of all genes spotted on the array, either in the control or in the dissected aorta group, were used for sub-sequent analyses. Genes were estimated as "differentially expressed" in dissected and control aorta, if the mean expression ratio of dissected and control aorta was less than 0.6 or more than 1.8 for Human and Cardiovascular filter arrays. For Affymetrix data, the same cut-off for mean expression value of at least 70% of expression of all genes per array has been applied. Since Affymetrix platform is more precise and sensitive in detecting of signals corre-sponding expressed mRNAs than arrays using radiola-beled probes minimal fold change was set to 2.0 for Affymetrix data. The unpaired Student's t-test was used as appropriate with significance set at a P level of < 0.05 to compare gene expression values for all three arrays. All t -tests were two-sided.
Identification of differentially expressed genes using "Significance Analysis of Microarrays" (SAM)
Micro-soft Excel add-in. Control and dissected aorta datasets were separated to corresponding blocks as recommended by SAM procedure. Readers are referenced to the SAM online manual for detailed explanations of the approach. SAM applies some test statistic, for example, a t-statistic, and then uses permutation to draw inferences. Shortly, SAM calculates a statistic di for each gene i by measuring
the strength of the relationship between gene expression and the class variable (control and dissected aorta). SAM uses repeated permutations of the data to determine the significant gene expression relating to the specific class. The cutoff for significance is determined by a tuning parameter delta. Delta is the difference between the observed score (t-statistics for the true labels), and the average expected score (t-statistics for the randomly per-mutated data). Delta is chosen by user based on the false discovery rate (FDR). A fold change parameter can be cho-sen to ensure the pre-specified amount of differential gene expression. Fold change of gene expression is the ratio of the mean expression levels for this gene in the groups under comparison. User definable conditions were set to default values. We applied two class unpaired comparison with t-statistics. Gene expression data were unlogged. Value of k parameter in k-nearest-neighbor algorithm was set to 3, number of permutations was 500. In these studies the value of delta was always chosen so that estimated FDR was a zero.
Partial least squares discriminant analysis for multivariate data (PLS-DA)
We applied a direct linear discriminant analysis to com-pare expression profiles of control and dissected aorta. Supervised PLS-DA uses independent (expression levels) and dependent variables (classes) for class comparison applying multivariate statistical methods, namely the soft independent modeling of class analogy (SIMCA) and par-tial least squares modeling with latent variables to allow simultaneous analysis of all variables [19-22]. Addition-ally, PLS-DA provides a quantitative estimation of the dis-criminatory power of each descriptor (gene) by means of
VIP (variable importance of the projection) parameters.
VIP values rank descriptors according to their ability to discriminate different classes. PLS-DA was performed with SIMCA-P commercially software (Umetrics AB, Umea, Sweden) as described by Pérez-Enciso and Tenenhaus [22]. Model validation was carried out via permutation. Number of permutations was 100. Parameter Q2 is a
measure of the predictive ability of the model, and R2 is
related to the goodness of fit of the model.
Although the application of the t test for selection of genes is appropriate because the number of defined classes is limited to two [20], the VIP criterion used in PLD-DA is more robust and discriminative. The PLS-DA is not ham-pered by the problem of data that is not distributed per
normality; an assumption that has to be made for the standard parametric t test. This assumption is rather more important when working with relatively small numbers of samples as in the present study.
Results
Identification of genes differentially expressed in dissected and control aorta, microarray analysis by different statistical methods
a. Unpaired t-test
BD Atlas™ human1.2 array
According to our definition (see section "Statistical analy-ses" in Material and Methods) 229 of 1,185 genes (19.3%) were expressed. Of those, 49 genes (21.4%) were differentially expressed. Twenty-five genes showed higher and 24 lower levels of gene expression in the dissected compared with the control aorta.
BD Atlas™ human cardiovascular array
114 of 597 genes (19.1%) were estimated as being expressed. Thirty-three genes (28.9%) displayed differen-tial expression, 10 genes were up-regulated, whereas 23 genes were down-regulated in the dissected aorta.
Affymetrix HG-133A GeneChip
On the Affymetrix platform 5246 of 22,283 genes (23.5%) showed detectable expression, of which 823 genes (15.7%) were differentially expressed in dissected and control aorta. Of those, 323 genes showed higher and 500 genes lower expression in dissected aorta.
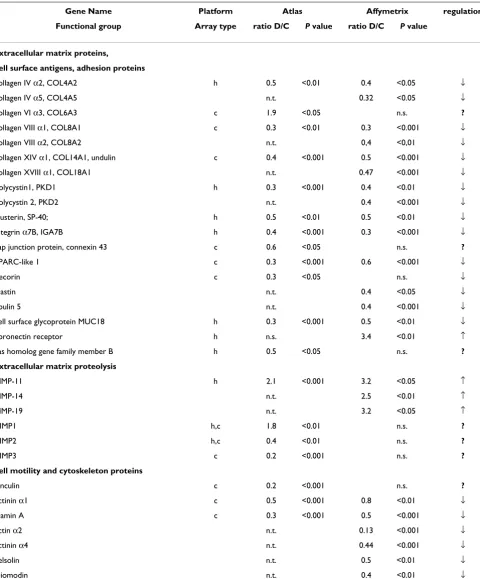
In table 2 all differently expressed genes of the Clontech Atlas experiment are shown and compared to the Affyme-trix experiment classified to several functional groups in the similar way how it has been done in our first pub-lished study [12]. Additionally to the differentially expressed genes as observed by use of both Clontech Atlas filter arrays, we included several significantly different expressed genes of the Affymetrix experiment in order to show functional groups to make it more informative for common readers.
Table 2: Gene expression studies: dissected aorta ascendens vs. control aorta. Gene expression studies that comparing freshly dissected aorta ascendens (D) and undissected control aorta (C). 3 different gene expression studies were performed: 16 samples were studied with BD Atlas™ Human1.2 Array (h), 16 samples – with BD Atlas™ Human Cardiovascular Array (c) and 8 samples – with
Affymetrix Human Genome U133A GeneChip. All differently expressed genes of the Atlas-experiments, 49 genes (h) and 33 genes (c), are shown and compared to genes of the Affymetrix experiment. Ratio: mean expression of dissected aorta (D) divided by mean expression of control (C); n.e.: not expressed, n.s.: difference not significant. n.t.: not tested, ↓ downregulated, ↑ upregulated; ? – regulation in the Atlas and Affymetrix experiment different
Gene Name Platform Atlas Affymetrix regulation
Functional group Array type ratio D/C P value ratio D/C P value
extracellular matrix proteins,
cell surface antigens, adhesion proteins
collagen IV α2, COL4A2 h 0.5 <0.01 0.4 <0.05 ↓ collagen IV α5, COL4A5 n.t. 0.32 <0.05 ↓ collagen VI α3, COL6A3 c 1.9 <0.05 n.s. ?
collagen VIII α1, COL8A1 c 0.3 <0.01 0.3 <0.001 ↓ collagen VIII α2, COL8A2 n.t. 0,4 <0,01 ↓ collagen XIV α1, COL14A1, undulin c 0.4 <0.001 0.5 <0.001 ↓ collagen XVIII α1, COL18A1 n.t. 0.47 <0.001 ↓ polycystin1, PKD1 h 0.3 <0.001 0.4 <0.01 ↓ polycystin 2, PKD2 n.t. 0.4 <0.001 ↓ clusterin, SP-40; h 0.5 <0.01 0.5 <0.01 ↓ integrin α7B, IGA7B h 0.4 <0.001 0.3 <0.001 ↓ gap junction protein, connexin 43 c 0.6 <0.05 n.s. ?
SPARC-like 1 c 0.3 <0.001 0.6 <0.001 ↓ decorin c 0.3 <0.05 n.s. ↓ elastin n.t. 0.4 <0.05 ↓ fibulin 5 n.t. 0.4 <0.001 ↓ cell surface glycoprotein MUC18 h 0.3 <0.001 0.5 <0.01 ↓ fibronectin receptor h n.s. 3.4 <0.01 ↑ ras homolog gene family member B h 0.5 <0.05 n.s. ? extracellular matrix proteolysis
MMP-11 h 2.1 <0.001 3.2 <0.05 ↑ MMP-14 n.t. 2.5 <0.01 ↑ MMP-19 n.t. 3.2 <0.05 ↑ TIMP1 h,c 1.8 <0.01 n.s. ?
TIMP2 h,c 0.4 <0.01 n.s. ?
TIMP3 c 0.2 <0.001 n.s. ? cell motility and cytoskeleton proteins
vinculin c 0.2 <0.001 n.s. ?
tropomyosin 1 n.t. 0.4 <0.01 ↓ calponin n.t. 0.3 <0.001 ↓ smooth & non-muscle myosin light chain kinase h 0.4 <0.001 n.t. ↓ smooth muscle myosin heavy chain, SM2 n.t. 0.5 <0.001 ↓ myosin regulatory light chain2, smooth muscle n.t. 0.5 <0.001 ↓
metabolism n.t.
low-density lipoprotein receptor, LDLR c 0.4 <0.001 1.6 <0.01 ?
Kunitz-type serine protease inhibitor 2, SPINT2 h 0.2 <0.001 0.3 <0.001 ↓ aldehyde dehydrogenase 2, mitochondrial c 0.3 <0.01 0.6 <0.01 ↓ diaphorase (NADH), cytochrome b-5 reductase c 0.5 <0.01 n.s. ?
superoxide dismutase 3, extracellular c 0.4 <0.01 0.4 <0.001 ↓ lipase A c 2.6 <0.05 n.s. ?
protease inhibit, PI1, alpha-1-antitrypsin h 5.5 <0.001 ↑ GABA-B receptor 1A subunit h 1.8 <0.001 n.e. ?
prostaglandin I2 prostacyclin synthetase c 0.4 <0.05 0.81 <0,001 ↓
Gene Name Platform Atlas Affymetrix regulation
Functional group Array type ratio D/C P value ratio D/C P value ratio D/C
Protein turnover
purine-rich element-binding protein A h 0.4 <0.01 0.6 <0.05 ↓ glutathione S-transferase theta 1 h 0.4 <0.01 0.2 <0.05 ↓ 58-kDa inhibit. of RNA-activated protein kinase h 0.3 <0.01 ↓ G1/S-specific cyclin D1 h 0.5 <0.01 n.s.
-carboxypeptidase H, CPE; enkephalin convertase h 0.4 <0.01 ↓ ribos. protein S6 kinase II α1, S6KII-alpha 1 h 3.1 <0.001 n.s.
-carboxypeptidase N, polypeptide 1, 50 kD c 2.0 <0.05 n.e.
-eukariotic translation initiantion factor 4E bind prot 1 n.t. 2.9 <0.01 ↑ 60 S acdic ribosomal protein PO n.t. 3.0 <0.01 ↑ FOS-related antigen 1 h,c 4.9 <0.01 3.6 <0.05 ↑ myc proto-oncogene h 3.5 <0.01 2.8 <0.05 ↑ ets domain protein elk-3; NET; SRF accessory protein h 2.1 <0.001 4.4 <0.05 ↑ adenine phosphoribosyltransferase n.t. 2.1 <0.001 ↑ high mobility group prot isoforms I & Y, HMGIY h 10.1 <0.001 6,0 <0.01 ↑ superoxide dismutase 2, mitochondrial c 2.6 <0.01 3.7 <0.001 ↑
Cell receptors
Natriuretic peptide receptor A/guanylate cyclase A c 0.4 <0.001 0.3 <0.001 ↓ natriuretic peptide receptor C/guanylate cyclase C c 0.5 <0.001 n.s.
[image:7.612.61.552.147.727.2]-protein tyrosine phosphatase receptor type F c,h 0.4 <0.01 n.t. -growth factors
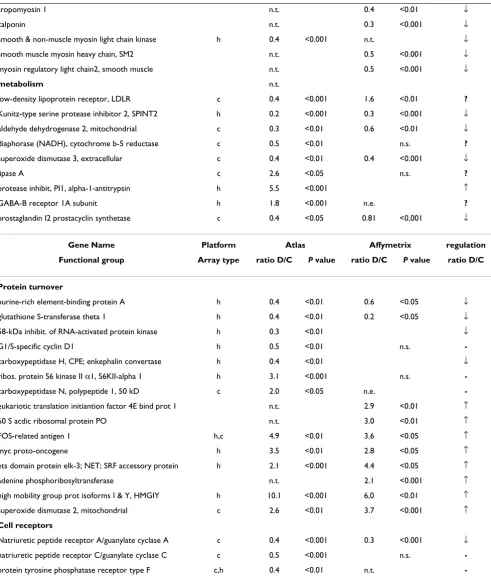
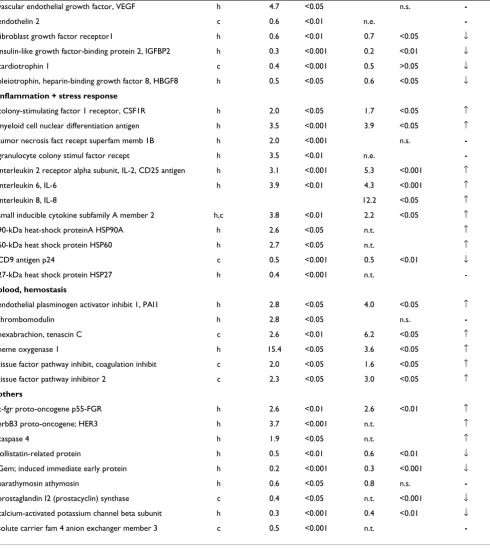
Table 2: Gene expression studies: dissected aorta ascendens vs. control aorta. Gene expression studies that comparing freshly dissected aorta ascendens (D) and undissected control aorta (C). 3 different gene expression studies were performed: 16 samples were studied with BD Atlas™ Human1.2 Array (h), 16 samples – with BD Atlas™ Human Cardiovascular Array (c) and 8 samples – with
vascular endothelial growth factor, VEGF h 4.7 <0.05 n.s.
-endothelin 2 c 0.6 <0.01 n.e.
-fibroblast growth factor receptor1 h 0.6 <0.01 0.7 <0.05 ↓ insulin-like growth factor-binding protein 2, IGFBP2 h 0.3 <0.001 0.2 <0.01 ↓ cardiotrophin 1 c 0.4 <0.001 0.5 >0.05 ↓ pleiotrophin, heparin-binding growth factor 8, HBGF8 h 0.5 <0.05 0.6 <0.05 ↓
inflammation + stress response
colony-stimulating factor 1 receptor, CSF1R h 2.0 <0.05 1.7 <0.05 ↑ myeloid cell nuclear differentiation antigen h 3.5 <0.001 3.9 <0.05 ↑ tumor necrosis fact recept superfam memb 1B h 2.0 <0.001 n.s.
-granulocyte colony stimul factor recept h 3.5 <0.01 n.e.
-interleukin 2 receptor alpha subunit, IL-2, CD25 antigen h 3.1 <0.001 5.3 <0.001 ↑ interleukin 6, IL-6 h 3.9 <0.01 4.3 <0.001 ↑ interleukin 8, IL-8 12.2 <0.05 ↑ small inducible cytokine subfamily A member 2 h,c 3.8 <0.01 2.2 <0.05 ↑ 90-kDa heat-shock proteinA HSP90A h 2.6 <0.05 n.t. ↑ 60-kDa heat shock protein HSP60 h 2.7 <0.05 n.t. ↑ CD9 antigen p24 c 0.5 <0.001 0.5 <0.01 ↓ 27-kDa heat shock protein HSP27 h 0.4 <0.001 n.t.
-blood, hemostasis
endothelial plasminogen activator inhibit 1, PAI1 h 2.8 <0.05 4.0 <0.05 ↑ thrombomodulin h 2.8 <0.05 n.s.
-hexabrachion, tenascin C c 2.6 <0.01 6.2 <0.05 ↑ heme oxygenase 1 h 15.4 <0.05 3.6 <0.05 ↑ tissue factor pathway inhibit, coagulation inhibit c 2.0 <0.05 1.6 <0.05 ↑ tissue factor pathway inhibitor 2 c 2.3 <0.05 3.0 <0.05 ↑
others
c-fgr proto-oncogene p55-FGR h 2.6 <0.01 2.6 <0.01 ↑ erbB3 proto-oncogene; HER3 h 3.7 <0.001 n.t. ↑ caspase 4 h 1.9 <0.05 n.t. ↑ follistatin-related protein h 0.5 <0.01 0.6 <0.01 ↓ Gem; induced immediate early protein h 0.2 <0.001 0.3 <0.001 ↓ parathymosin athymosin h 0.6 <0.05 0.8 n.s.
-prostaglandin I2 (prostacyclin) synthase c 0.4 <0.05 n.t. <0.001 ↓ calcium-activated potassium channel beta subunit h 0.3 <0.001 0.4 <0.01 ↓ solute carrier fam 4 anion exchanger member 3 c 0.5 <0.001 n.t.
-Table 2: Gene expression studies: dissected aorta ascendens vs. control aorta. Gene expression studies that comparing freshly dissected aorta ascendens (D) and undissected control aorta (C). 3 different gene expression studies were performed: 16 samples were studied with BD Atlas™ Human1.2 Array (h), 16 samples – with BD Atlas™ Human Cardiovascular Array (c) and 8 samples – with
[image:8.612.61.551.150.698.2]b. Identification of genes of interest by SAM
Human and Cardiovascular cDNA arrays' (Clontech plat-form) data were used as normalized previously. Signifi-cant genes were selected independent of their expression levels when their score was above the specified threshold
delta. With a FDR of 0 and by applying a minimal fold-change of 1.8 the analyses revealed consistent patterns of differential gene expression. In total, 37 genes were signif-icantly differentially expressed, i.e., 23 genes were up- and 14 genes were down-regulated in dissected aorta samples as defined by Human cDNA array (Additional file 1). Additionally, 36 genes were differentially expressed, i.e., three genes were up- and 33 genes down-regulated in dis-sected aorta samples as defined by Cardiovascular array (Additional file 2). Applying SAM to Affymetrix data we firstly had to reduce the number of genes under analysis. Since the signal detection is much more precise for Affymetrix data than in case of Atlas filter arrays, we changed the cutoffs for the detectable differential gene expression and set the cutoff for minimal expression level to 30 RSU. 30 RSU is an absolute board line (TGT = 100) for signal detection on GeneChip, which we accept as measurable. We selected 11,128 expressed genes, and SAM has been used with a FDR of 0, and a minimal fold-change of 2.5 has been then applied. In total, 195 genes were significantly differentially expressed between dis-sected and control aorta. Of those, 60 were up-regulated and 135 were down-regulated (Additional file 3).
c. Partial least squares discriminant analysis (PLS-DA)
We evaluated the discriminative ability of PLS-DA ques-tioning for small gene sets to separate control and dis-sected aorta samples. Expression data obtained on the Human Atlas array were used in the PLS-DA analysis, which were carried out in the first iterative level with all 281 reliably expressed genes previously used in the t test. During the course of analysis, we selected those genes sat-isfying the cutoff criterion of having the variable impor-tance in the projection (VIP) more than 1.5 with the first PLS component. In a second iterative PLS-DA only these genes (n = 44) were reanalyzed to avoid running an over-fitted model (see genes listed in Additional file 4). The VIP
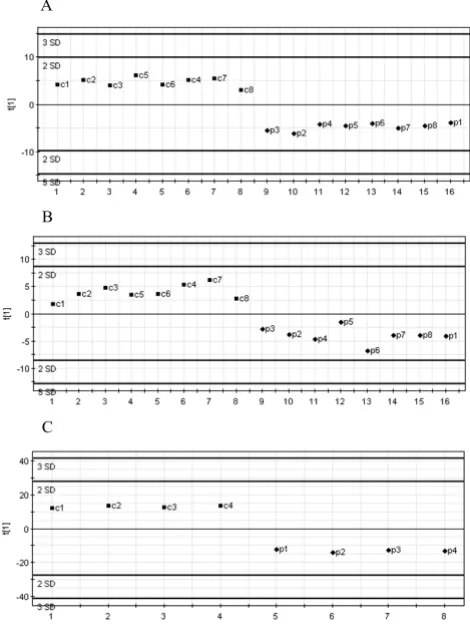
values (Additional file 4) correspond to the model with selected 44 genes and display lower values than obtained in the model with all 281 genes. This phenomenon has been reported previously [18,19]. To demonstrate a good agreement between both statistical analyses, t-test and PLS-DA, we included t-test's P values alongside with in-between groups ratios into the Additional file 4. Results of PLS-DA analyzing the 44 selected genes are depicted in Fig. 1A. Apparently control and dissected aorta samples are clearly discriminated. We performed a permutation test for the model covering only 44 genes, which showed the robustness and precision of this model (Additional file 7).
Furthermore, we applied PLS-DA to the 149 reliably expressed genes, as detected on the Cardiovascular array (Clontech). After the analysis with one PLS component had been performed, we retained 30 genes with highest VIP values between 1.8 and 1.32 for the second iterative PLS analysis run. Fig. 1B shows PLS-DA scatter plot with one component perfectly subdividing control and dis-sected aorta samples. Selected genes are listed in Addi-tional file 5. An independent permutation test showed that model with selected genes was the one with the high-est predictive power (Additional file 7).
For the Affymetrix platform, PLS-DA was carried out on the original 11,128 probe sets that passed the QC filtering process. Although this process may lead to an over param-eterized model with poor prediction properties, it
[image:9.612.315.550.92.406.2]pro-PLS-DA between control and dissected aorta samples
Figure 1
PLS-DA between control and dissected aorta samples. A, PLS discrimination with the 44 genes with VIP > 1.5 – Human Broad I array (Clontech). B, PLS discrimination with 30 genes with VIP > 1.32 – Cardiovascular array (Clontech). C, PLS discrimination with 79 genes with VIP > 1.51 – Affymetrix GeneChip microarray. Horizontal axis, number of samples in the table; vertical axis, the first PLS component. Numbers next to the black squares and rhombus, refer to control "c" or dis-sected "p" aorta samples.
A
B
vides a preliminary assessment of the most important discriminative variables. Further, those variables satisfy-ing the criteria of minimal ratio of 2.5 were retained and with the highest VIP values ranging from the maximum of 1.56 to 1.51 in the first iterative PLS analysis (Additional file 6). From those, 79 genes were selected, which demon-strated the highest predictive power (Fig. 1C), as shown by permutation analysis (Additional file 7).
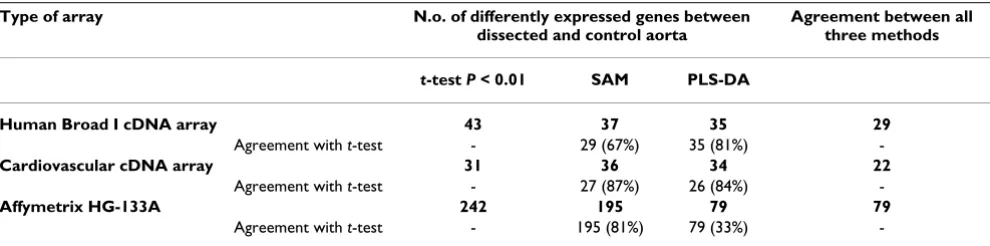
d. Comparison between three statistical methods
Since t-test may be problematic in multiple testing we applied "Significance analysis of microarrays" (SAM) and
"Partial least squares discriminant analysis" (PLS-DA) to three data sets obtained by use of Human, Cardiovascular and Affymetrix GeneChip arrays. All three statistical meth-ods were adequate in capturing a small number of the potentially relevant genes to the disease. We found the agreement between three statistical methods very high for all three array types. We have summarized the agreement between the three methods for each of used array type in the Table 3. Thus, we found 31 genes being differentially expressed between dissected and control aorta samples by applying the t-test to data obtained with Cardiovascular array. SAM analysis assorted 36 differentially expressed genes. Of those, 27 genes were on the t-test list. PLS-DA found 34 genes, which were sufficient to discriminate between both groups of samples. Of those, 26 genes were identified by the t-test.
We performed the new t-test analysis for the Affymetrix data by setting another cutoff values. Additionally to the board line of 30 RSU for the detectable gene expression, minimal fold change was set to 2.5 for Affymetrix data and cut-off for P-value was < 0.01 for the t-test. Under this assumption 11,128 of 22,283 genes (50%) showed detectable expression on the Affymetrix platform, of which 242 genes (21.8%) were differentially expressed in dissected and control aorta with 89 genes showed higher and 153 – lower expression in dissected aorta. Of those, 195 genes were found by SAM. Consequently, 79 genes, which are the part of 195th and 242nd gene sets, were
inde-pendently extracted by PLS-DA, as sufficient to discrimi-nate between normal and diseased aorta samples. Therefore, expression profiling of dissected and control aorta revealed significant differences in expression levels of certain genes.
Availability of raw expression data
Raw data for Clontech Human, Cardiovascular, and nor-malized expression data for Affymetrix HG-133A arrays have been submitted as Additional files 8, 9, 10 in Excel format.
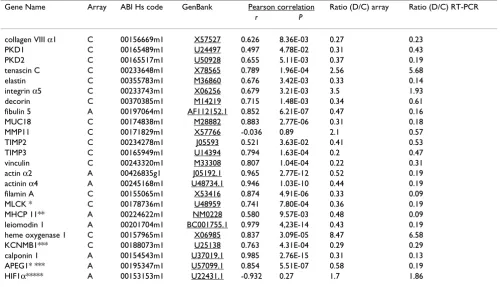
Validation of some genes differentially expressed in dissected and control aorta by TaqMan real-time PCR We selected a subset of 24 genes that were influenced by aortic dissection process for confirmation using quantita-tive real-time PCR. All chosen genes encode for proteins, which are important for the aortic structure and function. Confirming the microarray data, we found that almost all genes except of hypoxia-inducible factor 1 (HIF1α) and metalloproteinase -11 (MMP-11) were up- or down-regu-lated in dissected samples (Table 4). Pearson correlation analysis revealed a significant correlation between the cDNA or oligonucleotide array data and real-time PCR data for expression changes. Notably, Affymetrix array and real-time PCR data showed on the average higher cor-relation than that obtained on the Atlas Clontech plat-form.
Gene groups with predominant down-regulation in dissected aorta
Differentially expressed genes could be subdivided into several functional groups (Table 2).
Extracellular matrix (ECM)
Several genes that encode for extracellular matrix proteins displayed lower expression in dissected aortic wall relative to normal aortic wall (Table 2). Collagen distribution on the Atlas Clontech arrays: Whereas the mRNA of collagen 1, -IV α1, -XV, -XVI were equally distributed in dissected and control aorta, collagen II, -III, -IV α6, V, IX, XVIII,
-Table 3: The level of agreement between the t test, SAM and PLS-DA for selecting differentially expressed genes from the same data set.
Type of array N.o. of differently expressed genes between dissected and control aorta
Agreement between all three methods
t-test P < 0.01 SAM PLS-DA
Human Broad I cDNA array 43 37 35 29
Agreement with t-test - 29 (67%) 35 (81%)
-Cardiovascular cDNA array 31 36 34 22
Agreement with t-test - 27 (87%) 26 (84%)
-Affymetrix HG-133A 242 195 79 79
[image:10.612.59.554.606.729.2]-XIX were not expressed on the cardiovascular membrane. However, genes for collagen VI α3, -VIII α1, -VIII α2, – XIV showed a lower gene expression in dissected compared to control aorta. Collagen distribution on the Affymetrix chip: The Affymetrix chip displayed similar collagen gene expressions compared to the Atlas experiment. Genes for collagen IV α2, -IV α5, -VIII α1, -VIII α2, -XV, -XVIII α1 displayed a lower gene expression in dissection, whereas RNAs for collagen I, -III, -IV α1, -V and -VI were equally distributed, while the other collagens did not show any significant levels of gene expression. The lower gene expression of collagen VIII was also confirmed by RT-PCR. The mRNA of gene for elastin, an important connective tissue fiber, was reduced in dissected aorta, which was val-idated by RT-PCR.
Cytoskeleton and myofibrillar genes
Another group of genes with decreased expression levels consists of cytoskeleton and myofibrillar genes. We found that expression of α-actin gene, actinin α2 and -α4, tropo-myosin, gelsolin and some myosin light and heavy chains
were down-regulated in dissected aorta compared to nor-mal control aorta.
Cell-cell adhesion
Expression levels of genes, such as gene for fibulin 5 and integrin α7B, cell surface glycoprotein MUC18 and poly-cystin 1 and -2 coding for cell-cell adhesion proteins were significantly lower in the dissected aorta.
Matrix metalloproteinases and their inhibitors
Despite the connective tissue components had shown similarity in their expression levels and degree of differen-tial gene expression on both array platforms, the expres-sion of the matrix metalloproteinases (MMP) and their inhibitors was less uniform. On the Affymetrix platform only MMP-14 and MMP-19 were up-regulated, whereas
[image:11.612.54.555.130.417.2]MMP-2 and MMP-9 were equally expressed in dissected and control aorta. Genes of other metalloproteinases were not expressed. TIMP1, TIMP2, and TIMP3 were consist-ently expressed in both, dissection and control. In con-trast, expression of MMP-11 and TIMP1 was up-regulated
Table 4: Correlation of Clontech/Affymetrix gene expression levels with TaqMan real-time RT-PCR derived values. C means Clontech array (BD Atlas™ Human1.2 Array or BD Atlas™ Human Cardiovascular Array, A means Affymetrix Human Genome U133A GeneChip, MLCK * = myosin light chain kinase, MHCP 11** = myosin heavy chain polypeptide 11, KCNMB1*** = calcium-activated potassium channel beta, APEG1**** = Homo sapiens nuclear protein, HIF1α***** = hypoxia-inducible factor 1, alpha subunit.
Gene Name Array ABI Hs code GenBank Pearson correlation Ratio (D/C) array Ratio (D/C) RT-PCR
r P
in dissection, as found on Clontech platform, whereas
TIMP2 and TIMP3 were down-regulated. The differential expression of both, TIMP2 and TIMP3 was confirmed by real time PCR.
Gene groups with predominant up-regulation in dissected aorta
Inflammation and apoptosis
Expression of several genes associated with inflammation processes, e.g. genes coding for the inflammatory chem-okines, as interleukines (IL), IL-2, IL-6 and IL-8, were up-regulated in dissected aorta. Some stress response genes, as 90-kDa heat-shock protein A (HSP90A), HSP60, and
HSP27 were also up-regulated in dissection. Only one gene related to apoptosis, caspase 1 was up-regulated in dissection.
Blood and hemostasis
Genes of some blood components and components of coagulation and lysis pathways, for example, gene for heme oxygenase 1, endothelial plasminogen activator inhibitor, PAI1 or thrombomodulin were up-regulated in the freshly dissected aorta.
Proliferation, transcription and translation
We observed differential expression of some genes related to cell growth in dissection and normal aorta, some genes were up-regulated, others down-regulated.
Discussion
Molecular features underlying the pathogenesis of aortic dissection are still enigmatic. Knowledge of the differen-tial gene expression in dissected compared to the normal aorta may help to identify candidate genes for further studies allowing insights into the pathogenesis of aortic dissection. We proposed that some stable disfunctions in gene expression may underlie the development of aortic dissection. Sixty-six differentially expressed genes have been found and described in our previous study of aortic dissection [12]. Up-regulated genes in aortic dissection were involved in inflammation, extracellular matrix pro-teolysis, proliferation, transcription and translation proc-esses. Down-regulated genes coded for extracellular matrix, adhesion and cytoskeletal proteins. Although the differences were significant, insufficient number of genes on the cDNA array and the absence of any verification of differential gene expression made the results of prelimi-nary character.
In the present study we analyzed the gene expression in the aortic wall of acute Stanford A dissection and com-pared it with normal control aorta using two different microarray platforms followed by independent verifica-tion by real-time RT-PCR. We followed different strategies to study aortic dissection further and verify our previous
and new findings concerning differentially expressed genes. First of all, we collected new tissue samples. Whereas multiorgan donors in our pilot study were signif-icantly younger than patients with aortic dissection dis-ease, we brought the age of both groups into line. The samples were analyzed with the previously used cDNA array (Atlas Human Broad I). Additionally, we used the Atlas Human Cardiovascular array containing probes for genes, which are highly specific for cardiovascular sys-tems. Since some genes were in common on both Clon-tech filter arrays, an internal control was possible to verify the results from the Clontech platform. As a further result, we found the same genes being up- or down-regulated compared with our first study, thus confirming the find-ings from our pilot study [12]. Although data on expres-sion profiles of control and dissected aorta has been confirmed between groups and arrays used in both stud-ies, pilot and the present one, the further extension of genes under analysis was definite necessarily.
Eight samples, four aortic samples obtained from patients with type A acute aortic dissection and four control sam-ples obtained from multiorgan donors, were studied on Affymetrix microarrays with more than 22,000 features corresponding human genes/ESTs. About 60% of the genes with altered expression in the dissected versus nor-mal aorta were down-regulated in the dissected aorta. An interesting observation is the high percentage of down-regulated genes that are related to extracellular matrix, cell to cell adhesion, and cytoskeleton structures. It suggests that pathology of aortic dissection results from a loss of gene function. Smooth muscle cells (SMCs) in the media where the dissection occurs either seem to produce less proteins maintaining the stability of the aortic wall struc-ture, or the number of SMCs themselves expressing these genes is reduced [23,24].
Extracellular matrix (ECM)
type IV collagen structures surrounding individual smooth muscle cells were found in fibrous plaques but never in unaffected intima [30,31]. The chains of type IV collagen are assembled into supramolecular networks that differ in the chain composition. Six chains of type IV col-lagen are distributed in three major networks α1/α2, α3/
α4/α5, and α1/α2/α5/α6 [32].
Gene expression of collagen IV α2 and -α5 was down-reg-ulated in the dissected aorta. Sariola [33] had already shown defects in type IV collagen around medial smooth muscle cells when analyzing dissected aorta by immuno-histochemistry. Defects in smooth muscle cell basal lami-nae were found throughout the media in cystic medial degeneration and in medionecrosis. Similar to our exper-iment no defects in the expression of interstitial collagens type I and III were seen in the dissecting aortas. The authors concluded that local changes in the basement laminae of the medial layer are important in the patho-genesis of the aortic dissection. This observation was con-firmed by Ishii and Asuwa who also compared dissected and normal aortic wall by immunohistochemistry [34]. They also detected a significant higher concentration of MMP-2 and MMP-9 proteins at the beginning of dissec-tion near the „entry" whereas in intact areas of the same aorta MMP-2 and MMP-9 proteins were not increased. We did not observe any differential expression of MMP-2 and
MMP-9 in dissected and control aorta. A possible explana-tion is that our gene expression studies considered the whole aortic wall and not especially the „entry site" of the dissection.
Apart from collagen IV we found a decreased gene expres-sion of collagen XVIII and of the proteoglycan decorin in the dissected aorta, which proteins have a high affinity to collagen I and III fibrils.
Studies of aortic aneurysms have already shown a signifi-cant reduction of elastin content in the diseased aortic wall, which probably occurs due to a high elastase activity [35,36]. We were also able to demonstrate a reduced gene expression of elastin in dissection nevertheless in contrast to aneurysmal degradation, we could not detect elastase (MMP-12) expression on the array. On the contrary, our Affymetrix experiments showed a higher gene expression of the matrix metalloproteinases 11,-14 and -19. MMP-11 and MMP-14 degrade fibronectin and proteoglycanes, and MMP-14, additionally, – the major collagens I-III [37]. MMP-19, a recently discovered member of the zinc-dependent proteolytic enzymes, is able to process various proteins of the basement membranes [38,39]. Titz and colleagues treated tumor extracellular matrix with recom-binant MMP-19 and analyzed its effect on capillary like formation [39]. MMP-19 preferentially cleaves nidogen-1, which interferes with its cross link abilities for
extracellu-lar matrix proteins, especially laminin-1 and type IV colla-gen. As a consequence, the capillary-like structure formation was inhibited. The authors concluded that MMP-19 might be one of the enzymes that interferes with stabilization or maturation of nascent vasculature. We believe that MMP-19 might play a key role in propagating dissection by degrading type IV collagen in the vasa vaso-rum and the basal laminae surrounding smooth muscle cells in the media.
The ECM contains many glycoproteins which bind to cell surface components, and mediate cell-matrix connections and cell to cell contacts [26]. We detected decreased expression levels of some of these genes in the dissected aorta, for example, genes coding for fibulin 5, cell surface glycoprotein MUC18, SPARC-like 1 (osteonectin), clus-terin and connexin 43. Additionally, expression of several integrin genes was also decreased in diseased aorta. Integrins are adhesion receptors on the cell surface. Tissue remodeling is dependent on integrin-matrix signaling and interaction [27].
In our pilot study [12] we described that expression of polycystin 1 was lower in dissected aorta samples. In the present study we observed decreased expression of both genes for polycystin 1 and -2. Polycystins function as matrix receptors to link ECM to the actin cytoskeleton via focal adhesion proteins [40,41]. Mutations of these genes cause autosomal dominant polycystic kidney disease and familiar clustering of aortic dissection events, and supraaortal dissection or cerebral artery aneurysm in this disease have already been described [42].
Smooth muscle and cytoskeleton proteins
We noticed reduced expression levels of some myofibril-lar genes belonging to the contractile system of smooth muscle cells in dissection. A possible explanation could be a depletion of smooth muscle cells in the media of the dis-sected aorta. However, loss of contractility means reduced strength in resisting to pulsating hemodynamic forces.
Inflammation
A lot of genes being involved in inflammation were up-regulated in the dissected aorta, e.g., the inflammatory chemokines IL-2, IL-6 and IL-8, or integrin αM and integrin α2, which bind to lymphocytes or macrophages.
Protein turnover
Our recent pilot study had shown an upregulation of sev-eral genes being involved in cell proliferation and consid-ered this as result of an injury and repair mechanism [12]. In our new comparative gene expression studies some transcription and translation factors were up-regulated, whereas others were down-regulated.
Blood and hemostasis
Some genes being substantially important for blood cells as heme oxygenase 1 or for blood coagulation and lysis such as endothelial plasminogen activator inhibitor 1 were up-regulated in dissection. This may be a conse-quence of the dissection process itself. In our recent study we have compared nondissected and dissected aortic wall areas of the same tissue sample and had found no signifi-cant difference in their gene expression patterns [12]. Nev-ertheless, Stanford A patients undergo emergency surgery within 24 h after acute dissection and there may be some blood components left in the tunica media.
Conclusion
Although the clinical significance of the present study can-not be definitely estimated yet, the data on differential gene expression illustrate the underlying biological proc-esses involved in aortic dissection formation. Gene expression studies comparing acutely dissected ascending aorta and normal control aorta have shown major differ-ences. Whereas some genes mediating inflammation were up-regulated in dissection, a lot of genes mediating stabil-ity and integrstabil-ity of the aortic wall were down-regulated. Aortic dissection seems to be the dramatic endpoint of a longer lasting process of degeneration and insufficient remodeling of the aortic wall. Expression profiling of aor-tic dissection was capable of detecting biologically impor-tant changes in gene expression, which are probably associated exclusively with aortic dissection with excellent fidelity while revealing important down-stream effects of tissue remodeling and dysfunction of aortic structures for future in-depth studies. Indeed, we already examined the expression and localization of some extracellular matrix components, cytoskeleton and adhesion proteins in a fur-ther immunohistochemical study of normal and dissected aorta (manuscript in preparation).
Competing interests
The author(s) declare that they have no competing inter-ests.
Authors' contributions
B. T. Weis-Müller and O. Modlich evenly contributed to this study and share the first-authorship. Experiments and data analysis were mainly done by Dr. O. Modlich. Dr. B.T. Weis-Müller covered the clinical part of the study and wrote the paper.
Additional material
Additional File 1
Genes identified by SAM as differentially expressed between dis-sected and control groups by use of Human Clontech cDNA arrays.
Click here for file
[http://www.biomedcentral.com/content/supplementary/1479-5876-4-29-S1.doc]
Additional File 2
Genes identified by SAM as differentially expressed between dis-sected and control groups by use of Cardiovascular Clontech cDNA arrays.
Click here for file
[http://www.biomedcentral.com/content/supplementary/1479-5876-4-29-S2.doc]
Additional File 3
Genes identified by SAM as differentially expressed between dis-sected and control groups by use of Affymetirx HG-U133A microar-rays.
Click here for file
[http://www.biomedcentral.com/content/supplementary/1479-5876-4-29-S3.xls]
Additional File 4
Genes involved in discrimination between control and dissected aorta samples ordered by VIP as defined by SIMCA-P software using Human arrays (Clontech platform). PLS-DA results are listed together with P values from t test for corresponding genes for Human and Affymetrix arrays.
Click here for file
[http://www.biomedcentral.com/content/supplementary/1479-5876-4-29-S4.doc]
Additional File 7
Validation of PLS-DA for control versus dissected aorta samples by per-mutation. A, by use of 44 genes selected from Human Broad I array, Clon-tech platform. B, by use of 30 genes selected from Cardiovascular cDNA array, Clontech platform. C, by use of 79 gene probes selected from the Affymetrix GeneChip microarray. The horizontal axis is the value R2 and Q2. The two values on the right hand corner r = 1 correspond to the values of value R2 and Q2 for the actual data. Each symbol represents a result of permutation.
Click here for file
Acknowledgements
This study was funded by the „Forschungskommision der Medizinischen Fakultät" of the Heinrich-Heine-University of Düsseldorf.
References
1. Sawhhney NS, deMaria AN, Blanchard DG: Aortic intramural hematoma. An increasingly recognized and potentially fatal entity. Chest 2001, 120:1340-6.
2. Evangelista A, Mukherjee D, Mehta RH, O'Gara PT, Fattori R, Cooper JV, Isselbacher E, Suzuki T, Eagle KA, (IRAD) Investigators: Aortic intramural hematoma of the aorta: a mystery in evolution.
Circulation 2005, 111:1063-70.
3. Larson EW, Edwards W: Risk factors for aortic dissection: A necropsy study of 161 cases. Am J Cardiol 1984, 53:849-55. 4. Gray JR, Bridges AB, Faed MJW, Pringle T, Bams P, Dean J, Boxer M:
Ascertainment and severity of Marfan syndrome in a Scot-tish population. J Med Genet 1994, 31:51-4.
5. Raghunath M, Nienaber C, Kodolitsch Y: 100 Jahre Marfan-Syn-drom-eine Bestandsaufnahme. Dt Ärztebl 1997, 94:. A-821/B-681/C-637
6. Pyeritz RE, Mc Kusick VA: The Marfan syndrome: diagnosis and management. N Engl J Med 1979, 300:772-7.
7. Coselli JS, Le Maire SA, Büket S: Marfan syndrome: The variabil-ity and outcome of operative management. J Vasc Surg 1995,
21:432-43.
8. Habbal MHE: Cardiovascular manifestations of Marfan's syn-drome in the young. Am Heart J 1992, 123:752-57.
9. Murdoch JL, Walker BA, Halpern BA, Kuzma JW, McKusick VA: Life expectancy and causes of death in the Marfan syndrome. N Engl J Med 1972, 286:804-808.
10. Serry C, Agomuhoh O, Goldin M: Review of Ehlers-Danlos syn-drome. J Cardiovasc Surg 1988, 29:530-4.
11. Mueller BT: Gibt es eine angeborene oder erworbene Prädis-position zur Aortendissektion. 2004 [http://diss.ub.uni-duessel dorf.de/ebib/diss/show?dissid=1219]. Habilitationsschrift an der Medizinischen Fakultät der Universität Düsseldorf
12. Mueller BT, Modlich O, Prisack HB, Bojar H, Schipke JD, Goecke T, Feindt P, Petzold T, Gams F, Müller W, Hort W, Sandmann W: Gene expression profiles in the acutely dissected human aorta. Eur J Vasc Endovasc Surg 2002, 24:356-64.
13. Editorials: Suitability criteria for manuscripts utilizing genom-ics arrays technology. Circ Res 2001, 89:469.
14. Quackenbush J: Computational analysis of microarray data.
Nat Rev Genet 2001, 2:418-27.
15. Chee MS, Hubbell E, Berno A, Huang XC, Stern D, Winkler J, Lock-hart DJ, Morris MS, Fodor SP: Accessing genetic information with high-density DNA-arrays. Science 1996, 274:610-14. 16. Alon U, Barkai N, Notterman DA, Gish K, Ybarra S, Mack D, Levine
AJ: Broad patterns of gene expression revealed by clustering analysis of tumor and normal colon tissues probed by oligo-nucleotide arrays. Proc Natl Acad Sci USA 1999, 96:6745-50. 17. Rockett JC, Hellmann GM: Confirming microarray data – is it
really necessary? Genomics 2004, 83:541-549.
18. Tusher V, Tibshirani R, Chu G: Significance analysis of microar-rays applied to transcriptional responses to ionizing radia-tion. Proc Natl Acad Sci USA 2001, 98:5116-21.
19. UMETRICS Academy: Multivariate data analysis and modelling 2002:378.
20. Nguyen DV, Rocke DM: Multi-class cancer classification via par-tial least squares with gene expression profiles. Bioinformatics 2002, 18:1216-1226.
21. Eriksson L, Johansson E, Lindgren F, Sjostrom M, Wold S: Megavar-iate analysis of hierarchical QSAR data. J Comput Aided Mol Des 2002, 16:711-726.
22. Perez-Enciso M, Tenenhaus M: Prediction of clinical outcome with microarray data: a partial least squares discriminant analysis (PLS-DA) approach. Hum Genet 2003, 112:581-592. 23. Hao H, Gabbiani G, Bochaton-Piallat ML: Arterial smooth muscle
cell heterogeneity: implications for atherosclerosis and rest-enosis development. Arterioscler Thromb Vasc Biol 2003,
23:1510-20.
24. Mulvihill ER, Jaeger J, Sengupta R, Ruzzo WL, Reimer C, Lukito S, Schwartz SM: Atherosclerotic plaque smooth muscle cells have a distinct phenotype. Arterioscler Thromb Vasc Biol 2004,
24:1283-9.
25. Bucher O, Wartenberg H: Kreislaufapparat: Cytology, Histologie und mikroskopische Anatomie des MenschenVolume 12. Edited by: Bucher. Wartenberg: Hans Huber Verlag, Bern, Auflage; 1997:229-244. 26. Petrides PE: Binde- und Stützgewebe in Biochemie und Pathobiochemie
Volume 5. Edited by: Löffler. Petrides: Springer-Verlag, Berlin, Heidel-berg, Auflage; 1997:733-59.
27. Hofmann E: Biochemie der Binde- und Stützgewebe in Medizinische Bio-chemie Volume 3. Edited by: Hofmann E. UNI-MED Verlag AG, Bremen, Auflage; 2001:679-85.
28. MacLean NF, Dudeck NL, Roach MR: The role of radial elastic properties in the development of aortic dissection. J Vasc Surg 1999, 29:703-10.
Additional File 5
Genes involved in discrimination between control and dissected aorta samples ordered by VIP as defined by SIMCA-P software using Cardiovascular arrays (Clontech platform). PLS-DA results are listed together with P values from t test for corresponding genes for Car-diovascular and Affymetrix arrays.
Click here for file
[http://www.biomedcentral.com/content/supplementary/1479-5876-4-29-S5.doc]
Additional File 6
Genes involved in discrimination between control and dissected aorta samples ordered by VIP as defined by SIMCA-P software using data from Affymetrix platform. PLS-DA results are listed together with P values from t test for corresponding genes for Affymetrix arrays.
Click here for file
[http://www.biomedcentral.com/content/supplementary/1479-5876-4-29-S6.doc]
Additional File 8
Contains scaled to fixed target signal intensity TGT of 100 RSU flu-orescent intensities of all hybridization probes obtained from HG-133A microarrays (Affymetrix platform).
Click here for file
[http://www.biomedcentral.com/content/supplementary/1479-5876-4-29-S8.xls]
Additional File 9
Contains raw expression data obtained from Human Broad I arrays (Clontech platform).
Click here for file
[http://www.biomedcentral.com/content/supplementary/1479-5876-4-29-S9.xls]
Additional File 10
Contains raw expression data obtained from Cardiovascular arrays (Clontech platform).
Click here for file
Publish with BioMed Central and every scientist can read your work free of charge
"BioMed Central will be the most significant development for disseminating the results of biomedical researc h in our lifetime."
Sir Paul Nurse, Cancer Research UK
Your research papers will be:
available free of charge to the entire biomedical community
peer reviewed and published immediately upon acceptance
cited in PubMed and archived on PubMed Central
yours — you keep the copyright
Submit your manuscript here:
http://www.biomedcentral.com/info/publishing_adv.asp
BioMedcentral
29. Dingemans KP, Teeling P, Lagendijk JH, Becker AE: Extracellular matrix of the human aortic media: an ultrastructural histo-chemical and immunohistohisto-chemical study of the adult aortic media. Anat Rec 2000, 258:1-14.
30. Seki T, Naito I, Oohashi T, Sado Y, Ninomiya Y: Differential expression of type IV collagen isoforms, alpha5(IV) and alpha6(IV) chains, in basement membranes surrounding smooth muscle cells. Histochem Cell Biol 1998, 110:359-66. 31. Shekhonin BV, Domogatsky SP, Muzykantov VR, Idelson GL,
Ruko-suev VS: Distribution of type I, III, IV and V collagen in normal and atherosclerotic human arterial wall: immunomorpho-logical characteristics. Coll Relat Res 1985, 5:355-68.
32. Borza DB, Bondar O, Ninomiya Y, Sado Y, Naito I, Todd P, Hudson BG: The NC1 domain of collagen IV encodes a novel network composed of the alpha 1, alpha 2, alpha 5, and alpha 6 chains in smooth muscle basement membranes. J Biol Chem 2001,
276:28532-40.
33. Sariola H, Viljanen T, Luosto R: Histological pattern and changes in extracellular matrix in aortic dissections. J Clin Patho 1986,
139:1074-81.
34. Ishii T, Asuwa N: Collagen and elastin degradation by matrix metalloproteinases and tissue inhibitors of matrix metallo-proteinase in aortic dissection. Human Pathol 2001, 31:640-6. 35. Campa JS, Greenhalgh RM, Powell JT: Elastin degradation in
abdominal aortic aneurysms. Atherosclerosis 1987, 65:13-21. 36. White JV, Haas K, Phillips S, Comerota AJ: Adventitial elastolysis
is a primary event in aneurysm formation. J Vasc Surg 1993,
17:371-80.
37. Dollery CM, McEvan JR, Henney AM: Matrix metalloproteinases and cardiovascular disease. Circ Res 1995, 77:863-8.
38. Impola U, Toriseva M, Suomela S, Jeskanen L, Hieta N, Jahkola T, Grenman R, Kahari VM, Saarialho-Kare U: Matrix metalloprotein-ases-19 is expressed by proliferating epithelium but disap-pears with neoplastic dedifferentiation. Int J Cancer 2003,
103:709-16.
39. Titz B, Dietrich S, Sadowski T, Beck C, Petersen A, Sedlacek R:
Activity of MMP-19 inhibits capillary-like formation due to processing of nidogen-1. Cell Mol Life Sci 2004, 61:1826-33. 40. Wilson PD: Polycystin: new aspects of structure, function, and
regulation. J Am Soc Nephrol 2001, 12:834-45.
41. Weston BS, Bagneris C, Price RG, Stirling JL: The polycystin-1 C-type lectin domain binds carbohydrate in a calcium-depend-ent manner, and interacts with extracellular matrix proteins in vitro. Biochim Biophys Acta 2001, 1536:161-76.
42. Biagini A, Maffei S, Baroni M, Piacenti M, Terrazzi M, Paoli F, Triami G, Picano E, Salvatore L: Familial clustering of aortic dissection in polycystic kidney disease. Am J Cardiol 1993, 72:741-42. 43. Cancer Today Webpage [http://www.cancertoday.com] 44. Stanford University Webpage [http://www-stat.stanford.edu/