Int. J. Electrochem. Sci., 13 (2018) 3326 – 3334, doi: 10.20964/2018.04.26
International Journal of
ELECTROCHEMICAL
SCIENCE
www.electrochemsci.orgCu–Zr Thin Film Electrodeposited from an Aqueous Solution
Using Rectangular Pulse Current Over a Megahertz Frequency
Range
M. Saitou
University of the Ryukyus, Department of Mechanical Systems Engineering, 1 Senbaru Nishihara-cho Okinawa, 903-0213, Japan.
E-mail: [email protected]
Received: 4 December 2017 / Accepted: 26 January 2018 / Published: 6 March 2018
Cu–Zr thin films electrodeposited on indium tin oxide glasses from aqueous solutions containing potassium sodium tartrate tetrahydrate using rectangular pulse current over a frequency range of 0.5– 1.4 MHz were investigated. Resonant frequencies at which the Zr content in the Cu–Zr thin films was maximum were identified using energy dispersive X-ray spectroscopy. A resonant frequency interval between the neighboring resonant frequencies was 0.26 MHz on average. The resonant frequencies and resonant frequency interval were explained in terms of an energy level transition between the Fermi energy level of electron in the indium tin oxide and quantized rotational energy level of a complex ion comprising Zr and tartaric ions in the aqueous solution. X-ray diffraction analysis confirmed that the Cu–Zr thin film was an alloy composed of Cu and Zr. Surface images of the Cu–Zr thin film observed using scanning electron microscopy indicated an aggregation of cauliflower-like islands consisting of nano-scale grains.
Keywords: Zr; Cu–Zr thin film; Resonant frequency; Resonant frequency interval; Energy level transition; Cauliflower
1. INTRODUCTION
Zr thin films are generated by physical vapor deposition [10], molten salt electrolysis [11–12], and sputtering [13]. Electrodeposition is an easy and economical technique to generate metal thin films from aqueous solutions. However, these advantages are absent when molten chlorides are used for Zr electrodeposition at a deposition temperature above 773 K [14]. Since the standard electrode potential of Zr is −1.45 V in thermal equilibrium [15] and hydrogen evolution occurs drastically during Zr electrodeposition, Zr cannot be electrodeposited from aqueous solutions. To the best of our knowledge, there have been very few studies on Zr electrodeposition using aqueous solutions.
We have reported that Al was electrodeposited on an indium tin oxide (ITO) glass substrate from an aqueous solution containing potassium sodium tartrate tetrahydrate when a rectangular pulse current with a megahertz frequency was employed [16]. Several resonant frequencies at which the Al content in Cu-Mo-Al thin films drastically increased were identified and the resonant frequency interval between the neighboring resonant frequencies was 0.2 MHz. An energy level transition between the Fermi energy level of electrons in the ITO glass and a quantized rotational energy level of a complex of trivalent aluminium and tartrate ions was thought to occur.
Zr is electrodeposited from an aqueous solution because the standard electrode potential of Zr is slightly larger than that of Al, −1.66 V [15]. In addition, the resonant frequencies should be identified during Cu–Zr electrodeposition. This is our motivation for the present study.
The aims of the present study are to obtain the Zr content in Cu–Zr thin films electrodeposited from an aqueous solution, to study the resonant frequencies at which the Zr content increases markedly, and to investigate the Cu–Zr thin film surface that appeared like a cauliflower consisting of nano-scale grains.
2. EXPERIMENTAL SETUP
An ITO glass of 30 × 10 mm2 and carbon plate of 50 × 40 mm2 were used for the cathode and anode respectively. Three aqueous solutions including the following chemical compounds (mol∙L−1) were prepared: solution A, CuSO4·5H2O (0.3), Zr(SO4)2·4H2O (0.21), and KNaC4H4O6·4H2O (0.35); solution B, CuSO4·5H2O (0.727), Zr(SO4)2·4H2O (0.21), and KNaC4H4O6·4H2O (0.5); and solution C, CuSO4·5H2O (0.945), Zr(SO4)2·4H2O (0.21), and KNaC4H4O6·4H2O (0.65). The electrodes cleaned using a wet process were placed parallel to each other in an electrochemical cell filled with solution A, B, or C. The solution was kept at 300 K during the electrodeposition process.
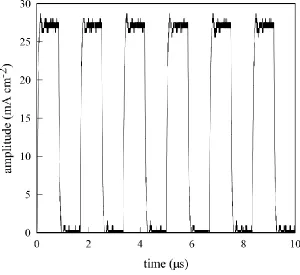
Rectangular pulse current with a frequency range of 0.5–1.4 MHz was supplied to the cell by a function generator. A 22 metal film resistor was connected in series with the cell. The rectangular pulse current flowing to the cell was calculated from the voltage drop across the metal film resistor, which was measured using a digital storage oscilloscope. The impedance of the metal film resistor was independent of the frequency below 80 MHz. The amplitudes of the rectangular pulse current were 15 and 27 mA∙cm−2.
[image:3.596.148.448.129.404.2]
After deposition, the Cu–Zr thin film electrodeposited on the ITO glass was rinsed with distilled water and dried in a vacuum chamber.
Figure 1. Rectangular pulse current with an amplitude of 27 mA∙cm−2 and frequency of 0.6 MHz. The amplitude of the rectangular pulse current was calculated from the voltage drop across a 22 metal film resistor.
The Zr content in the Cu–Zr thin film on the ITO glass was calculated using energy dispersive X–ray spectroscopy (EDX; Shimadzu EDX–800). The crystallographic texture of the Cu–Zr thin film was determined using X-ray diffraction (XRD; Rigaku Ultima) analysis with CuK radiation using a conventional –2 diffractometer equipped with carbon monochromators. The surface morphology of the Cu–Zr thin film was investigated using scanning electron microscopy (SEM; Hitachi TM3030).
3. RESULTS AND DISCUSSION
3.1. Cu–Zr thin films electrodeposited at 27 mA∙cm−2
Table 1. Typical contents of atomic elements in Cu–Zr thin films electrodeposited at a frequency of 0.6 MHz using Solution B.
element Cu Si Ca K S In Zr Residual quantities
content (wt%) 72.8 11.8 6.8 4.0 1.3 1.0 0.4 1.9
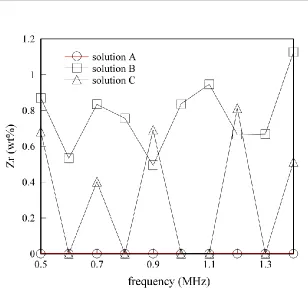
Figure 2. Frequency dependence of the Zr content in Cu–Zr thin films electrodeposited at 27 mA∙cm−2 using solution A, B, or C.
In spite of using solution A, which includes Zr ions, the electrodeposited Cu-Zr thin films have no Zr content regardless of the frequency. In the energy level transition description we proposed, complex ions comprising Zr and tartrate ions, which have quantized rotational energy, are required to be generated in solution A. Solution A contains the lowest Cu ion content among the three solutions. When a tetravalent Zr ion and tartrate ion form a complex, a bivalent Cu ion may be needed. The Cu ion content in solution A may be too low to enhance the formation of the complex ion comprising Zr and tartrate ions.
The Zr content in Cu-Zr thin films electrodeposited using solution B reaches maximum at specific resonant frequencies. The Cu content in solution B is 2.4 times higher than that in solution A. A periodic change in the Zr content with varying frequency is observed. The resonant frequency interval between the neighboring resonant frequencies is 0.3 MHz on average.
[image:4.596.147.455.141.430.2]
Thus, in this study, the Zr electrodeposition that is said to be not electrodeposited from an aqueous solution is identified.
We have already reported a periodic change in Ni content in Co–Ni thin films generated on a copper substrate by a rectangular pulse current over a megahertz frequency [17]. The frequency dependence of the Ni content in the Co–Ni thin films was explained by the energy level transition between the Fermi energy level of electrons in the copper substrate and a quantized rotational energy level of complex ions comprising Co, Ni and tartrate ions. The resonant frequency interval of 0.1 MHz between the neighboring resonant frequencies was identified. The resonant frequency is related to a quantum number that defines the quantized rotational energy. As in this study on Co-Ni thin films the resonant frequencies and resonant frequency interval are observed, an analogous energy level transition is thought to occur during the Cu–Zr electrodeposition,
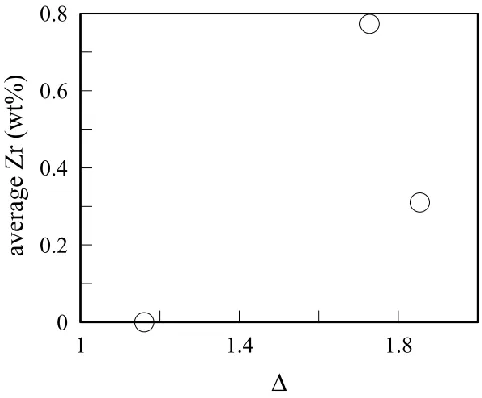
[image:5.596.175.416.447.646.2]We here define the symbol as the mole ratio of ([CuSO4]+[KNaC4H4O6]) to ([ZrSO4]+[KNaC4H4O6]) where the brackets [ ] indicate the molarities in solution. The values of become 1.16, 1.73, and 1.85 for solution A, B, and C, respectively. Taking the average of the Zr content on the frequency range of 0.5–1.4 MHz in Fig. 2, we obtain a plot of the average Zr content in Cu-Zr thin films vs. as shown in Fig. 3. Figure 3 shows that the average Zr content has a maximum value at =1.73. According to this investigation the generation rate of Cu atoms can be concluded to be much faster than that of Zr atoms because the Cu content in the Cu–Zr thin film is much higher than the Zr content. An increase with the CuSO4 content in the solution seems to act as an inhibitor of the formation of Zr atoms. On the other hand, an increase in the Zr(SO4)2 content in the solution enhances the formation of Zr atoms. Thus, the average Zr content in the Cu–Zr thin films has a maximum value.
Figure 3. A plot of the average Zr content vs. .
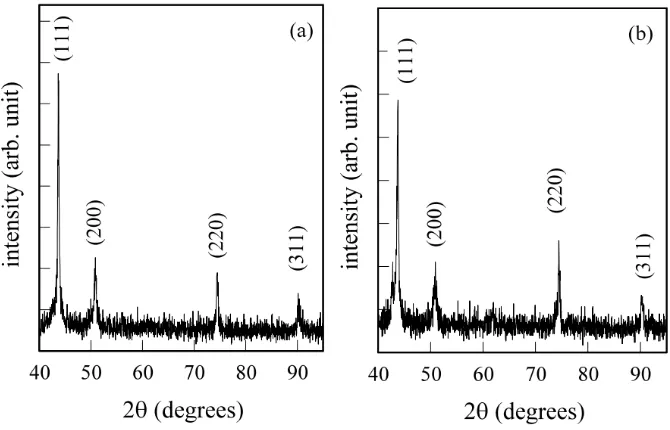
observed. Figures 2 and 4 indicate that the Cu–Zr thin film has a face-centered cubic (FCC) structure and is an alloy composed of Cu and Zr.
We estimate the mean grain size, d using the Scherrer equation [19], where K is the shape factor, is the X-ray wavelength, and is the line broadening at a Bragg diffraction angle B. We obtain the mean grain sizes of (a) 24 nm and (b) 23 nm from the diffraction peak indexed as the (111) plane in Fig. 4 (a) and (b) using K = 1.
Figure 4. XRD patterns of Cu–Zr thin films electrodeposited at (a) 0.5 MHz and (b) 0.9 MHz using solution B.
[image:6.596.126.461.201.416.2]SEM images of Cu–Zr thin films in Fig. 5 indicate that the surface comprises islands that have a diameter of approximate ~2 m. According to the calculated mean grain size, the small grains observed in the island have average diameters of 24 and 23 nm in Fig. 5 (a) and (b), respectively. The island is called a cauliflower [20].
[image:6.596.120.479.577.716.2]
3.2. Cu–Zr thin films electrodeposited at 15 mA∙cm−2 using solution B
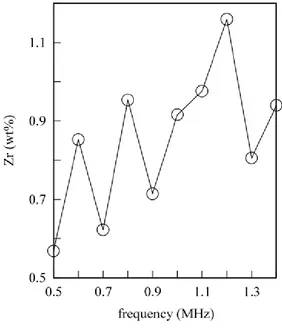
Figure 6. Frequency dependence of the Zr content in Cu–Zr thin films electrodeposited at 15 mA cm−2 using solution B.
The influence of the amplitude of the rectangular pulse current on the Zr content in Cu–Zr thin films was investigated. Figure 6 shows the frequency dependence of the Zr content in Cu–Zr thin films electrodeposited at 15 mA cm−2 using solution B. The Zr content changes as periodically as the Zr content in Cu-Zr thin films electrodeposited at 27 mA∙cm−2 using solution B. The Zr content at a resonant frequency shows a maximal value. The maximum Zr content in Fig. 6 is 1.2 wt%. The resonant frequency interval between the neighboring resonant frequencies is approximately 0.27 MHz on average. The Zr content averaged over the frequency range of 0.5–1.4 MHz are 0.85 and 0.77 wt% for the Cu-Zr thin films electrodeposited at 15 and27 mA cm−2, respectively. Hence, the Zr content decreases slightly with the amplitude of the rectangular pulse current. The effect of the amplitude on the Zr content is consistent with that on the Al content in Al electrodeposition [16].
[image:7.596.151.433.110.439.2]
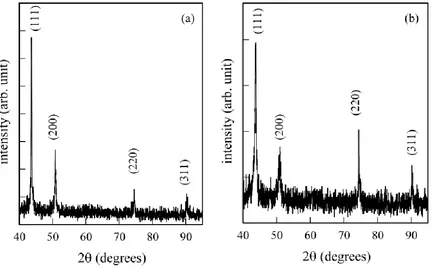
Figure 7. XRD patterns of Cu–Zr thin films electrodeposited at (a) 0. 6 MHz and (b) 1.2 MHz.
Figure 8. SEM images of Cu–Zr films electrodeposited at (a) 0.6 MHz and (b) 1.2 MHz.
Figure 7 shows the XRD patterns of Cu–Zr thin films electrodeposited at 0.6 and 1.2 MHz. The diffraction peaks are indexed as the (111), (200), (220), and (311) planes, consistent with those of polycrystalline Cu [18]. No other peaks that indicate the presence of other materials are observed. The Cu–Zr thin film is a solid solution comprising Cu and Zr as with the Cu–Zr thin film electrodeposited at 27 mA cm−2.
[image:8.596.83.515.79.349.2] [image:8.596.108.489.417.558.2]
4. CONCLUSIONS
The Zr electrodeposition from the aqueous solution greater than or equal to the mole ratio =1.73 was identified. The Zr content in the Cu-Zr film at the resonant frequency of the rectangular pulse current indicated a maximal value. The resonant frequency interval between the neighboring resonant frequencies was approximately 0.26 MHz on average. The XRD analysis showed that the Cu– Zr thin film had an FCC structure that includes Zr atoms as substitutional atoms. The Zr content slightly decreases with the amplitude of the rectangular pulse current. SEM images of the Cu–Zr thin films indicated the aggregation of islands that appeared like cauliflowers consisting of nano-scale grains.
References
1. L. Xu, Y. Xiao, Q. Xu, Q. Song and Y. Yang, Int. J. Electrochem. Sci., 12 (2017) 6393.
2. W. Simka, D. Majewski, G. Nawrat, A. Krząła and Ł. Nieużyła, Arch. Metall. Mater., 59 (2014) 565.
3. P. Kumar, P. Sharma, R. Shrivastav, S. Dass and V.R. Satsangi, Int. J. Hydrogen Energy, 36 (2003) 2777.
4. A. Juma, I.O. Acika, A.T. Oluwabi, A. Mere, V. Mikli, M. Danilson and M. Krunksa, Appl. Surf. Sci., 387 (2016) 539.
5. E. Zalnezhad, A.M.S. Hamouda, J. Jaworski and Y.D. Kim, Sci. Rep., 6 (2016) 33282.
6. F. Marquez, C. Morant, K.R. Pirota, A. Borras, J.M. Sanz and E. Elizalde, Nano Today, 4 (2009) 21.
7. Z. Chen, M. Zhang, W. Han, X. Wang and D. Tang, J. Alloys Compd., 459 (2008) 209.
8. J. Yang, L. Chang, L. Jiang, K. Wang, L. Huang, Z. He, H. Shao, J. Wang and C-N. Cao, Surf. Coat. Technol., 321 (2017) 45.
9. L. Benea, O. Mitoseriu, J. Galland, F. Wenger and P. Ponthiaux, Mater. Corros., 51 (2000) 3491. 10. N. Ozkucur, C. Wetzel, F. Hollstein, E. Richter, R.H. Funk and T.K. Monsees, J. Biome. Mater.
Res. A, 89A (2009) 57.
11. H. Groult, A. Barhoun, E. Briot, F. Lantelme and C.M. Julien, J. Fluor. Chem., 132 (2011) 1122. 12. Q-G. Xu, L-W. Guo, L. Zhang and H. Liu, Surf. Coat. Technol., 302 (2016) 150.
13. F. Rebib, A. Bousquet, E. Tomasella, V. Micheli, G. Gottardi and N. Laidani, Plasma Process. Polym., 6 (2009) S830.
14. W. Simka, D. Puszczyk and G. Nawrat, Electrochim. Acta, 54 (2009) 5307.
15. D.R. Lide, CRC Handbook of Chemistry and Physics 79th edition, CRC Press, New York (1998). 16. M. Saitou, Int. J. Electrochem. Sci., 12 (2017) 6557.
17. M. Saitou, Int. J. Electrochem. Sci., 13 (2018) 305. 18. JCPDS No. 04-0836.
19. J.I. Langford and A.J.C. Wilson, J. Appl. Crys., 11 (1978) 102.