Int. J. Electrochem. Sci., 13 (2018) 5723 – 5735, doi: 10.20964/2018.06.19
International Journal of
ELECTROCHEMICAL
SCIENCE
www.electrochemsci.org
A Highly Sensitive Dopamine Sensor Based on Graphene
Quantum Dots Modified Glassy Carbon Electrode
Shengbiao Zheng1, Rong Huang1, Xiaoqing Ma1, Jing Tang1*, Zirong Li1, Xuchuan Wang 1, Jumeng Wei1, Jianfei Wang2,*
1
College of Chemistry and Material Engineering, Anhui Science and Technology University, 233100, Fengyang, Anhui Province, China
2
College of Resource and Environment, Anhui Science and Technology University, 233100, Fengyang, Anhui Province, China
*
E-mail: [email protected] (Tang Jing), [email protected] (Wang Jianfei)
Received: 26 January 2018 / Accepted: 18 March 2018 / Published: 10 May 2018
A graphene quantum dots (GQDs) modified glassy carbon electrode (GCE), namely GQDs/GCE was prepared by electrodeposition method, which was characterized by chronocoulometry and electrochemical impedance spectra. The electrochemical behavior of the prepared modified electrode towards the catalytic oxidation of dopamine (DA) in pH 7.0 phosphate buffer solution was investigated by cyclic voltammetry and differential pulse voltammetry. It was demonstrated that the modified electrode presented good electrocatalytic activity and had favorable electrochemical response towards DA without the interference of ascorbic acid. The probable mechanism on the modified electrode surface was proposed. Under optimum conditions, the dependence of current vs. concentration was linear from 0.4 to 100 M with a regression coefficient of 0.997, and the detection limit of DA was 50 nM (S/N=3). Analytical application of GQDs/GCE was successfully tested in the determination of DA in real samples.
Keywords: graphene quantum dots (GQDs); dopamine; modified electrode; ascorbic acid 1. INTRODUCTION
19], have been searched to detect DA. Compared to other methods, electrochemical detection of DA is attractive because of its high sensitivity and ease of use. Additionally, DA has a very strong electrochemical activity because it own to an electroactive catecholamine group [20]. However, most of the time both DA and ascorbic acid (AA) coexist in real biological samples, a major challenge for sensing DA is that AA with oxidation potentials close to that of DA on conventional electrodes [21]. To overcome this limitation, various materials have been employed to modify the surface of working electrodes such as organic redox mediators [22], nanoparticles [23] and self-assembled monolayer [14], since the modified electrode can reduce the oxidation potential and also increase selectivity. Although most of these modified electrodes made many contributions for sensing dopamine, these modified electrodes either exhibited limited sensitivity or they involved sophisticated and expensive syntheses.
In recent years, graphene, a one-atom thick layer consisting of carbon atoms arranged in a honeycomb lattice with sp2 hybridization, has aroused increasing attention as sensing element in electrochemical detections due to its large surface area, fast electron transfer rate and excellent electrical conductivity [24]. On the other hand, strong hydrophobic nature is disadvantageous for the redox of analytes at graphene interface in aqueous solutions due to interface resistance. Among the derivatives of graphene, graphene quantum dots (GQDs) are a kind of zero-dimensional (0D) material with size less than 100 nm.25 GQDs exhibit high electrical conductivity, large surface area, biocompatibility [25, 25], and some other special physical properties. With these extraordinary properties, GQDs are suitable alternatives as both optical sensing platform and bioimaging [27]. Nowadays, there are some reports about GQDs as sensing platform in the field of electrochemical detections [28, 29]. Among these literatures, a GQDs modified glassy carbon electrode (GQDs/GCE) was usually prepared by the casting method. The poor reproducibility of the modified electrodes limited the application of GQDs in the field of electrochemical sensing.
In this present work, the GQDs were synthesized by convenient method and characterized carefully. Then the GQDs modified electrode (GQDs/GCE) was fabricated by electrodeposition method, which was characterized by EIS and electrochemical technologies. The electrochemical behavior of the GQDs modified electrode towards DA was also investigated and the results showed that the redox signal of DA was greatly promoted by the modified GQDs layer. Moreover, the existence of AA did not interfere to determination of DA at this modified electrode. The detection limit of DA was found to be 50 nM by differential pulse voltammetry. Also, the electrochemical parameters and electrochemical reaction mechanism of DA on the GQDs/GCE were carefully investigated in this work.
2. MATERIALS AND METHODS 2.1 Materials
with H3PO4 or NaOH. All chemicals were of analytical grade and were obtained commercially.
Doubly distilled water (resistivity>18MΩ·cm) was used throughout experiments.
2.2 Apparatus
The morphology and size of the GQDs were analysed by JEM 2100 transmission electron microscope (JEOL, Tokyo, Japan) with an acceleration voltage of 200 kV. FT-IR spectroscopy in the range of 4000–500 cm−1 was measured by using a Thermo Fisher FT-IR spectrometer. All electrochemical experiments (except electrochemical impedance spectroscopy experiments) were done using a CHI660E electrochemical workstation (ShangHai ChenHua Instruments Corporation, China) comprising of a conventional three-electrode cell: bare GCE (3 mm diameter) or GQDs/GCE as the working electrode, a saturated calomel electrode as the reference electrode and a platinum wire as the count electrode, respectively. The electrochemical impedance spectroscopy (EIS) experiments were performed on a Princeton PARSTAT 4000 between 0.1 Hz and 10 kHz at 0.25 V.
2.3 Synthesis of GQDs
In this study, the bottom-up pyrolysis method was used for synthesis of GQDs [30]. In brief, 2 g citric acid (CA) was placed in a 100 mL round bottom flask and then heated to 200 ℃in an oil bath. About 30 min later, the color of the liquid changed from colorless to orange, which implied the formation of GQDs. And then, this orange liquid was dissolved by dropwise addition of 10 mg·mL-1 NaOH solution and vigorous stirring until the pH of the GQDs solution up to 8.0. Finally, the GQDs were dialyzed for 48 h with the dialysis bags, and after vacuum freeze dry, the GQDs were stored at 4 °C.
2.4 Fabrication of GQDs modified GCE
Before the modification, the GCE was polished with 0.3 and 0.05 μm aluminum powder in sequence and then washed successively with anhydrous alcohol and double distilled water in an ultrasonic bath and dried in air. Next, 2 mg GQDs were dissolved in 4 mL ultrapure water under ultrasonic conditions. The freshly polished GCE was placed into the GQDs solution (2 mg·mL-1), the electrodeposition of GQDs was carried out under cyclic voltammetry (CV) sweeping from −1.5 to 2.0 V at a scan rate of 100 mV·s-1 for 30 cycles on GCE. The obtained modified electrode was donated as GQDs/GCE.
2.5 Experimental measurements
The electrochemical behaviors of the electrodes were evaluated by EIS in 5.0 mM [Fe(CN)6]3−/4− solution containing 0.1 M KCl. Cyclic voltammetry (CV) was used for investigating the
V to +0.6 V, scan rate was 100 mV·s-1. The determination of DA was performed by differential pulse voltammetry (DPV). DPV was recorded within the potential range from -0.3 V to +0.6 V with a pulse amplitude 50 mV, pulse width 50 ms in 0.1 M PBS solution. After each measurement, the modified electrode was washed with water and scanned in blank PBS solution until the electrochemical signals of DA were disappeared. All measurements were carried through at ambient temperature.
3. RESULTS AND DISCUSSION 3.1 Characterization of GQDs
Figure 1. (A) TEM image of the GQDs, inset: size distribution histograms of GQDs; (B) FT-IR spectra of the GQDs
The as-prepared GQDs were characterized by TEM and FT-IR spectra. As shown in Fig.1A, the GQDs were dispersed with the diameter in the range of 3-15 nm, and the average size of the GQDs was determined to be about 9 nm. FT-IR spectrum (Fig. 1B) showed that there was a vibration band at 3444 cm−1, which was assigned to the O-H stretching vibration of C-OH groups. The peaks at 1640 cm−1and 1355 cm−1 were attributed to the stretching vibration of C=O and C-OH [31]. The result demonstrates that the GQDs were rich in various oxygen-containing functional groups (hydroxyl, carboxyl). These results further confirmed that the GQDs have been successfully prepared.
3.2 Electrochemical behavior of GQDs /GCE
Electrochemical impedance spectroscopy (EIS) was used for investigation of the impedance changes of the electrode surface during the modification process. Fig. 2A shows the EI spectra of 5.0 mM [Fe(CN)6]3−/4− solution containing 0.1 M KCl at bare GCE and GQDs/GCE. The Nyquist plot of
EI spectrum includes a semicircular part and a linear part. The semicircular part at high frequency corresponds to the electron transfer-limited process, and the diameter is equivalent to the resistance (Rct) of the electron-transfer process, which is related to the dielectric and insulating features at the electrode/solution interface [32, 33]. The bare GCE (Fig. 2A, curve a) displayed a big semicircle with
[image:4.596.88.505.253.394.2]
a Rct. For the GQDs/GCE (Fig. 2A, curve b), It can be seen that a small semicircle at higher frequencies was observed. This demonstrates the existence of GQDs could decrease the resistance of the sensing platform in the electrode/solution interface. This also strongly proved that the GQDs/GCE could be a promising electrochemical platform for sensing.
Figure 2. (A) Nyquist plots of different electrodes in 5 mM [Fe(CN)6]3-/4- containing 0.1 M KCl: bare
GCE (a) and GQDs/GCE (b). (B) Plot of Q–t curves of (a) bare GCE, and (b) GQDs/GCE in 0.1 mM K3[Fe(CN)6] containing 1.0 M KCl. Insert: plot of Q–t1/2 curves on (a) bare GCE and
(b) GQDs/GCE.
The effective surface areas of GCE and GQDs/GCE were studied by chronocoulometry in a 0.1 mM K3[Fe(CN)6] solution containing 1.0 M KCl. (The diffusion coefficient D for K3[Fe(CN)6] is
7.6×10⁻⁶ cm2·s-1 at 298k). The plot of Q - t1/2 for bare GCE and GQDs/GCE was shown in Fig. 2B. According to the equation supplied by Anson [34]:
Q(t) = 2nFAcD1/2t1/2/π1/2+ Qdl + Qads
where n is the electron transfer number, F is the Faraday’s constant, Qdl is double layer charge which can be eliminated by background subtraction, Qads is the Faradaic charge, A is the effective surface area of working electrode and c is the concentration of the substrate.
Q = 3.05×10⁻⁶ t1/2-0.068×10-6 Q = 20.51×10⁻⁶ t1/2-6.23×10-6
The effective surface area (A) was calculated to be 0.0053 cm2 and 0.0344 cm2 for bare GCE and GQDs/GCE from the slope of Q versus t1/2. The results indicated that the effective surface areas of GQDs/GCE increased about 6.7 times larger than that on the bare GCE and leading to enhanced in current response.
3.3 Electrochemical behavior to DA at GQDs/GCE
[image:5.596.66.546.168.306.2]
of DA was measured at 0.114/0.224V. The potential differences between anodic and cathodic peaks (ΔEp) were determined to be 110 mV. While at the GQDs/GCE, the redox peak was shown at 0.157/0.182 V for DA. The potential differences between redox peaks (ΔEp) for DA was 25 mV. Furthermore, the peak current increased evidently at the GQDs/GCE. These results indicated that the GQDs modified electrode exhibited an excellent catalytic effect on the oxidation of DA. The modified GQDs/GCE not only improved the redox peak currents but also made the redox reaction of DA more reversible. Firstly, the GQDs possess high electroactive surface area, good electrocatalytic activity and low charge transfer resistance, which can accelerate the electrochemical reaction of dopamine. Secondly, the GQDs/GCE has high electrochemical response to recognition of DA can be attributed to π-π bonding and electrostatic interaction between negatively charged carboxylate groups on the prepared GQDs [35] and positively charged amine functional groups in DA (pKa=8.87) [36]. The
reaction mechanism of DA on the modified electrode surface proposed in Scheme 1.
3.4 Optimization of conditions
The effect of different electrodeposition cycles of the GQDs in preparation the GQDs/GCE was investigated by the CVs in presence of DA. The electrodeposition cycles of GQDs were varying from 5, 10, 20, 30 to 40 cycles. Fig. 4 illustrates the variations in the electrocatalytic nature of the GQDs with the different number of cycles. The oxidation and reduction peak current of DA increased after increasing the number of cycles to 30. The current was slightly decreased when the the number of deposition cycle was over 30. So, electrodeposition cycles of thirty were selected as the optimal experimental condition.
[image:6.596.141.455.479.691.2]
Scheme 1. The schematic illustration of the reaction mechanism of DA on the GQDs/GCE
[image:7.596.151.445.507.705.2]The cyclic voltammograms for the GQDs/GCE at different scan rates (v) on the electrochemical behavior of 0.1 mM DA were examined. As shown in Fig. 5A, both the oxidation peak current and the reduction peak current of DA increased with the increase of scan rates from 20 to 200 mV·s-1. Fig. 5B shows the plots of peak currents vs. scan rates, the anodic peak currents (Ipa) and cathodic peak currents (Ipc) increased linearly with scan rates. The linear regression equation for the cathodic peak current was Ipc (μA) = 0.047v+3.6348 (v in mV·s-1), with a correlation coefficient of r = 0.9993, and for the anodic peak current was Ipc (μA) = -0.0491v-5.1276 (v in mV·s-1), with a correlation coefficient of r = 0.9979, suggesting that the adsorption process was involved in the electrochemical response of DA [12]. When scan rate was small, the number of electrons of DA was given by: W1/2 = 3.52RT/nF = 90.6/n, calculated as n = 1.86 ≈ 2, which was in good agreement with the references [23, 37].
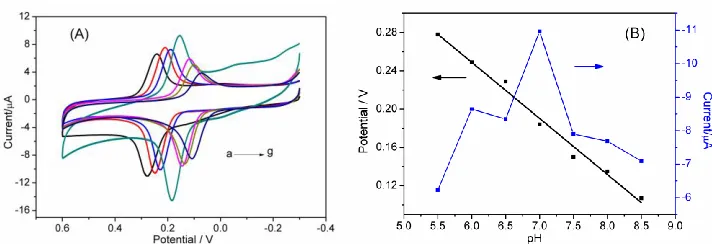
A proton is always involved in the electrochemical reactions of organic compounds and exerts significant impact on the reaction speed. The effect of PBS solution pH on the response of DA at the GQDs/GCE was investigated in the range of pH 5.5–8.5 by CV. From Fig. 6, the maximum response current to pH was obtained at pH 7.0. Therefore, pH 7.0 was fit for the subsequent analytical experiments. Fig. 6B shows the relationship between the anodic peak potential and the pH value, with a pH increment of 5.5 to 8.5, the anodic peak potential of DA shifted toward a more negative value, indicating that protons transferred at the GQDs modified electrode. The dependence of Epa on pH value at the GQDs/GCE can be expressed by the relation: Epa(V) = 0.6003-0.0586 pH (r =0.9861). According to the formula: dEp/dpH = 2.303 mRT/nF, where m is the number of proton transferred, and
n the number of electron, the value of m/n was obtained to be 1 from the slope (58.6 mV per pH unit) of the relationship of Ep – pH. This showed that the number of proton and electron involving in the
electrochemical redox process of DA is equal [38], thus the electrooxidation of DA at the GQDs/GCE involved a two-electron and two-proton process.
Figure 5. (A) Effect of scan rates on the redox behavior of 0.1 mM DA in 0.1 M PBS (pH 7.0) at the GQDs/GCE (scan rate: 20, 40, 60, 80, 100, 120, 140, 160, 180, 200 mV·s-1); (B) The linear relationship of ipa and ipc with v (mV·s-1)
[image:8.596.114.486.321.451.2] [image:8.596.122.478.542.664.2]
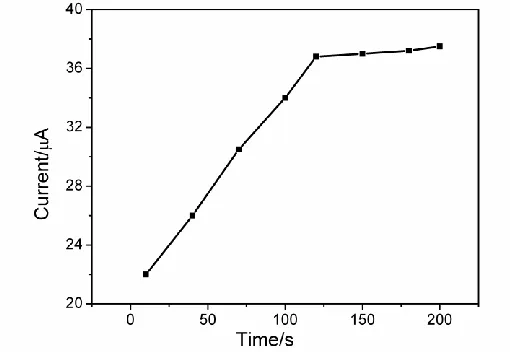
Figure 7. Effect of accumulation time on the oxidation peak current of 50 M DA
It is no doubt that the accumulation time could improve the amount of DA adsorbed on the GQDs/GCE surface and improve the current response. The effect of accumulation time on the DPV peak current of DA (50 M) was studied and the corresponding results were shown in Fig. 7. The oxidation peak current increased gradually with the increase of accumulation time from 10 to 200 s. With a further increase in the accumulation time, the oxidation peak current response remained nearly constant, suggesting that the saturated adsorption of DA at the surface of the GQDs/GCE was complete. Therefore, the optimal accumulation time of 200 s was used in the further experiments.
3.5 Determination of DA
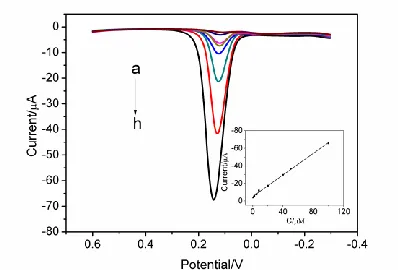
As a highly sensitive electrochemical technique, DPV was used for determination of DA in 0.1 M PBS (pH 7.0). Fig. 8 shows the typical DPV curves of DA at the GQDs/GCE as the concentration increases from 0.4 to 100 M. It could be seen that the peak currents enhance gradually with the adding of DA. In the range from 0.4 to 100 M, the linear equation was Ipa(μA) =-0.6145C(μM)- 4.995 with a correlation coefficient of 0.997. According to a signal-to-noise ratio (S/N) of 3, the detection limit was estimated to be 50 nM. The DA determination performances of the prepared modified electrode were compared with carbon nanotubes and grapheme modified electrodes (Table 1). As can be seen, the analytical performance of the GQDs/GCE is much higher than most of the literature studies.
Figure 8. DPVs of the GQDs/GCE in 0.1 M pH 7.0 PBS containing different concentrations of DA (from a to h 0.4, 2, 5, 8, 20, 40, 50 and 100 μM), pulse amplitude: 50 mV, pulse width: 50 ms; Inset: plot of oxidation peak currents and DA concentrations
3.6 Interference study
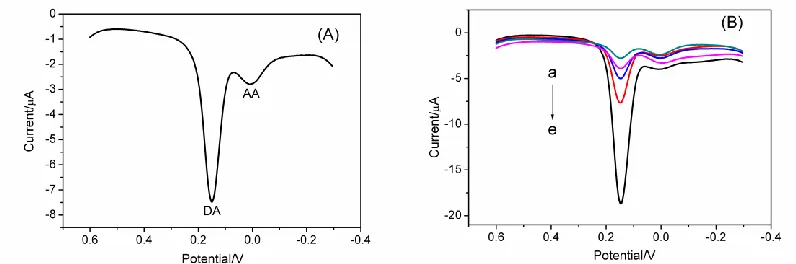
[image:10.596.200.399.73.208.2]DA and 1000 M AA at the GQDs/GCE were investigated by DPV (Fig. 9). As can be seen from Fig. 9A, the separation of the oxidation peak potential of DA and AA was calculated as 148 mV. Forthermore, the high concentration of AA showed a sluggish and poor electrochemical response at the GQDs/GCE, suggesting that the GQDs/GCE could sensitively and selectively detect DA in the presence of AA. It may be attributed to the electrostatic repulsion due to the negatively charged carboxylate groups on the prepared GQDs, which exclude most of the AA anions from the surface of the electrode.
Table 1. Comparison of the analytical parameters obtained using different modified electrodes for the determination of DA
Electrodes Methods Linear
range(M) LOD(M) Ref.
MWCNT/Nafion/GCE DPV 2.0 - 20 0.07 [39]
TiO2-graphene/GCE DPV 5.0 - 200 2.0 [40]
Chitosan–graphene /GCE
DPV 1.0- 24 1.0 [41]
(GQDs-NHCH2CH2NH)/GCE
DPV 1.0- 150 0.115 [42]
GQDs/GCE DPV 0.4- 100 0.05 This
work
[image:10.596.81.515.511.655.2]
Uric acid (UA) also coexists with DA in biological systems. The influence of UA on the signals of DA was examined and found that no interference occurred with the addition of 100-fold concentration UA in the presence of DA. In addition, other influences from common co-existing substances were also investigated. It was found that 300-fold concentration of L-tryptophane and L-cysteine; 200-fold concentration of citric acid and glucose had no influence on the signals of dopamine. Some substances such as 100-fold concentration of KCl, Na2SO4, Cu(NO3)2, MgCl2, CaCl2, ZnCl2, FeCl3, Na2CO3 had
no influences on DA determination. These results suggested that the determination of DA at the GQDs/GCE is free from the most common interfering species and thus the prepared modified electrode also has high sensitivity for the determination of DA.
Figure 9. (A) DPVs of a mixture of10 M DA and 1000 M AA at the GQDs/GCE in pH 7.0 PBS, pulse amplitude: 50 mV, pulse width: 50 ms; (B) DPVs of DA at the GQDs/GCE in the presence of 1000 M AA in pH 7.0 PBS. From (a) to (e) DA concentration C =0.4, 2, 5, 10, and 20 M
3.7 Reproducibility and stability of the GQDs modified electrode
The reproducibility and stability of the GQDs modified electrode were investigated. The relative standard deviation (RSD) of the oxidation peak currents of 50 M DA by fifteen successive measurements was 2.63%. When five GQDs modified electrodes based on the same procedure were utilized for the determination of 50 M DA, and the RSD was 1.67%. Even if the GQDs modified electrode was kept at 4 °C for 2 weeks, the peak currents still remained more than 91.6 % of the initial value. The above results revealed excellent stability and reproducibility of the GQDs/GCE towards the DA oxidation.
3.8 Analytical application
[image:11.596.100.498.255.387.2][image:12.596.79.517.194.254.2]
concentrations of DA standard solution (10, 20 and 30 μM) and their DPVs were obtained at the modified electrode. The recovery and RSD were presented in Table 2. High recoveries of DA between 96.0% and 98.5% was achieved, with a low relative standard deviation, confirmed that the prepared GQDs/GCE is suitable for the determination of DA in real samples.
Table 2. Determination of DA in dopamine hydrochloride injection (n = 5).
Sample Original(μM) Added (μM) Found (μM) RSD (%) Recovery (%)
1 10.2 10 19.89 2.75 98.5
2 10.2 20 28.99 3.38 96.0
3 10.2 30 39.57 2.92 98.4
4. CONCLUSION
In conclusion, we have successfully constructed the GQDs/GCE by an electrodeposition method for sensitively determination of DA. GQDs/GCE exhibited excellent high electrocatalytic activity toward DA oxidation due to its high electroactive surface area, π-π bonding and electrostatic interaction between the prepared GQDs and DA. Besides, the modified electrode can also eliminate the interference of ascorbic acid effectively. This fabricated electrode showed excellent reproducibility, good stability and low detection limit, which makes it suitable for the determination of DA in the presence of high concentration of AA. Moreover, the proposed sensor was applied for the determination of DA in real samples with satisfactory results.
ACKNOWLEDGEMENTS
This work was supported by the Project of Education Department of Anhui Province (KJ2017A506), the key discipline of Anhui Science and Technology University (AKZDXK2015A01), the Foundation of Anhui Science and Technology University (ZRC2016485) and the Student's Platform for Innovation and Entrepreneurship Trainning Program of China (201710879014, 201710879016).
References
1. J. F. van Staden and R. I. van Staden, Talanta, 102(2012) 34.
2. M.L. Heien, A.S. Khan, J. L. Ariansen, J.F. Cheer, P.E. Phillips, K.M. Wassum and R.M. Wightman, Proc. Natl. Acad. Sci., 102(2005) 10023.
3. D. Merims and N. Giladi, Park. Relat. Disord., 14(2008) 273. 4. Q.M. Li, J. Li and Z. J. Yang, Anal. Chim. Acta., 583(2007) 147. 5. F.B. Salem, Talanta, 34(1987) 810.
6. Z.H. Guo and S.J. Dong, Electroanal., 17(2005) 607.
7. C.Muzzi, E.Bertocci, L.Terzuoli, B.Porcelli, I.Ciari, R.Pagani and R.Guerranti, Biomed. Pharmacother., 62(2008) 253.
8. J. Shalini, K.J .Sankaran, C.L. Dong, C.Y. Lee, N.H. Tai and I.N. Lin, Nanoscale, 5(2013) 1159. 9. A. Zakaria, E. S. Vasquez, K.B. Walters and D.Leszczynska, RSC Adv., 5(2015) 107123.
10. A. Özcan, S. İlkbaş and A.A. Özcan, Talanta, 165(2017) 489. 11. X.W. Yu, K. X. Sheng and G.Q. Shi, Analyst, 139(2014) 4525.
13. T. Qian, C. Yu, X. Zhou, P. Ma, S. Wu, L. Xu and J. Shen, Biosens. Bioelectron., 58(2014), 237. 14. X. X. Weng, Q.X. Cao, L.X. Liang, J.R. Chen, C.P. You, Y.M. Ruan, H.J. Lin and L.J. Wu,
Talanta, 117(2013) 359.
15. H. Beitollahi, M. Hamzavi, M. Torkzadeh-Mahani, M. Shanesaz and H.K. Maleh, Electroanal., 27(2015) 524–533.
16. Z.Y. Zhao, M.M. Zhang, X. Chen, Y.J. Li and J. Wang, Sensors, 15(2015) 16614.
17. D. Sangamithirai, S. Munusamy, V. Narayanan and A. Stephen, Surf. Interfaces., 4(2016) 27. 18. Y. Wang, Y. Huang, B. Wang, T. Fang, J. Chen and C. Liang, J. Electroanal. Chem., 782(2016)
76.
19. A. Numan, M.M. Shahid, F.S. Omar, K. Ramesh and S. Ramesh, Sens. Actuators. B, 238(2017) 1043.
20. F. Xu, M.N. Gao, L. Wang, G.Y. Shi, W. Zhang, L.T. Jin and J.Y. Jin, Talanta, 55(2001) 329. 21. A.J. Downard, A.D. Roddick and A.M. Bond, Anal. Chim. Acta., 317(1995) 303.
22. M.F. He and X.H. Zheng, J. Mol. Liq., 173(2012) 29.
23. S.L. Yang, G. Li, Y.L. Yin, R.Yang, J.J. Li and L.B. Qu, J. Electroanal. Chem., 703(2013) 45. 24. D. Chen, H.B. Feng and J.H. Li, Chem. Rev., 112(2012) 6027.
25. H.J. Sun, L. Wu, W.L. Wei and X.G. Qu, Mater. Today, 16(2013) 433.
26. Y. Hu, D.W. He, Y.S. Wang, J.H. Duan, S.F. Wang, M. Fu and W.S. Wang, Chin. Physics B, 23(2014)128103.
27. Y. Dong, G. Li, N. Zhou, R. Wang, Y. Chi and G. Chen, Anal. Chem., 84(2012) 8378. 28. J. Zhao, G.F. Chen, L. Zhu and G.X. Li, Electrochem. Commun., 13(2011) 31.
29. M. Roushani and Z. Abdi, Sens. Actuators. B, 201(2014) 503.
30. Y.Q. Dong, J.W. Shao, C.Q. Chen, H. Li, R.X. Wang, Y.W. Chi, X.M. Lin and G.N. Chen, Carbon, 50(2012) 4738.
31. L. Wang, F. Liu, C. Jin, T. Zhang and Q. Yin, RSC Adv., 4(2014) 46187.
32. H.O. Finklea, D.A. Snider, J. Fedyk, E. Sabatani, Y. Gafni and I. Rubinstein, Langmuir, 9(1993) 3660.
33. E. Sabatani, I. Rubinstein, R. Maoz and J. Sagiv, J. Electroanal. Chem., 219(1987) 365. 34. F.C. Anson, Anal. Chem., 36(1964) 520.
35. L.B. Tang, R.B. Ji, X.K. Cao, J.Y. Lin, H.X. Jiang, X.M. Li, K.S. Teng, C.M. Luk, S.J. Zeng, J.H. Hao and S.P. Lau, ACS Nano., 6(2012) 5102.
36. Q. Huang, S. Hu, H. Zhang, J. Chen, Y. He, F. Li, W. Weng, J. Ni, X. Bao and Y. Lin, Analyst, 138(2013)5417.
37. F. Gao, X. Cai, X. Wang, C. Gao, S. Liu, F. Gao and Q. Wang, Sens. Actuators B, 186(2013) 380. 38. C.R. Raj and T. Ohsaka, J. Electroanal. Chem., 496(2001) 44.
39. S.B. Hocevar, J. Wang, R.P. Deo, M. Musameh and B.Ogorevc, Electroanal., 17(2005) 417. 40. Y. Fan, H.T. Lu, J.H. Liu, C.P. Yang, Q.S. Jing, Y.X. Zhang, X.K. Yang and K.J. Huang, Colloids
Surf. B, 83(2001) 78.
41. D.X. Han, T.T. Han, C.S. Shan, A. Ivaska and L. Niu, Electroanal., 22(2010) 2001.
42. Y.H. Li, Y.Y. Jiang, T. Mo, H.F. Zhou, Y.C. Li and S.X. Li, J. Electroanal. Chem., 767(2016) 84. 43. C.Y. Deng, J.H. Chen, M.D. Wang, C.H. Xiao, Z. Nie and S.Z. Yao, Biosens. Bioelectron.,
24(2009) 2091.
44. J.S. Huang, Y. Liu, H.Q. Hou and T.Y. You, Biosens. Bioelectron., 24(2008) 632.

![Figure 2. (A) Nyquist plots of different electrodes in 5 mM [Fe(CN)6]3-/4- containing 0.1 M KCl: bare GCE (a) and GQDs/GCE (b)](https://thumb-us.123doks.com/thumbv2/123dok_us/1789210.133268/5.596.66.546.168.306/figure-nyquist-plots-different-electrodes-containing-kcl-gqds.webp)