Int. J. Electrochem. Sci., 13 (2018) 8666 – 8672, doi: 10.20964/2018.09.18
International Journal of
ELECTROCHEMICAL
SCIENCE
www.electrochemsci.org
Short Communication
Co
3O
4Nanofibers Modified by Graphene as High-performance
Anode Materials for Lithium-ion Batteries
Hairong Gao1, Haijie Sun1,*, Aijuan Zhao 1, Ling Wang1, Na Liu1
1
Institute of Environmental and Catalytic Engineering, College of Chemistry and Che-mical Engineering, Zhengzhou Normal University, Zhengzhou 450044, China.*E-mail: [email protected]
Received: 9 April 2018 / Accepted: 7 June 2018 / Published: 5 August 2018
1D CO nanofiber graphene (CO/G) composites were successfully synthesized by a two-step hydrothermal method. The CO/G composites could limit the aggregation of CO and improve the electronic conductivity at the same time. As a result, the as-prepared CO/G composite electrode had a high reversible capacity of 1591.4 mAh g-1 for the first cycle, and the capacity remained at 550 mAh g
-1
after 70 cycles.
Keywords: Co3O4 nanofiber, graphene, anode, Li-ion batteries.
1. INTRODUCTION
In recent decades, to improve the performance of LIBs, considerable efforts have been made to find novel electrode materials, such as Co3O4 and Co3O4-based anode materials[1, 2, 3]. Co3O4 is one
of the promising candidates for LIBs due to its high theoretical specific capacity (890 mAh g-1)[4, 5]. Despite the many advantages, many issues still hinder the commercial application of Co3O4 anodes in
lithium-ion batteries. However, Co3O4 suffers from severe volume expansion and low electrical
conductivity, leading to rapid capacity decay during cycling. To solve these problems, considerable efforts have been made to alleviate the volume change and enhance the electrical conductivity of Co3O4-based anode materials[6-10].
Consequently, the key factors for enhancing the performance of Co3O4 anode materials include
limiting the aggregation of Co3O4 and improving the electronic conductivity at the same time[11, 12].
Recently, substantial research efforts have been made to improve the cycling performance of Co3O4
aggregation of Co3O4, a variety of methods have been applied that involve the design of Co3O4 with
various nanostructures, such as Co3O4 nanoparticles[13, 14], nanorods[15, 16] and nanoflowers[17].
In this paper, 1D CO nanofiber graphene (CO/G) composites have been successfully synthesized by a two-step hydrothermal method. This facile method is beneficial in the preparation of hybrid structure materials. In this hybrid structure, the graphene could improve the electron conductivity and inhibit the volume change at the same time. As a result, the CO/G composites maintain a stable structure during cycling, resulting in superior electrochemical performance.
2. EXPERIMENTAL
2.1. Preparation of CO nanofibers
A total of 10 mL N,N-dimethylformamide was dissolved in 35 mL distilled water, and 4.6 mL trifluoroacetic acid (TFA) was added to the solution; then, 0.93 g CoCl2•6H2O was added to the above
solution. After magnetic stirring for 30 min, the solution was transferred to a 100 mL hydrothermal reactor, which was heated at 180 °C for 24 h. Then, the obtained product was centrifuged, dried, and finally placed in a muffle furnace at 450°C for 2 h. Finally, 1D nanofiber-like CO was obtained.
2.2. Preparation of CO/G composite
A total of 0.05 g CO was dispersed in a solution of 80 mL graphene oxide, ultrasonicated for 20 min, and stirred for 1 h; then, 0.1 g urea was added, and then the reactant was transferred to a 100 mL hydrothermal reactor for 2 h at 120 °C. Finally, the obtained products were filtered and washed, and the CO/G composite was obtained.
2.3. Material characterization
The as-obtained samples were characterized by using a scanning electron microscope (SEM, JSM-7001F) and an X-ray diffractometer (XRD, D8 Advance, BRUKER). The content of graphene in the CO/G composite was determined by thermogravimetric analysis (TG, TA Q600 instrument).
2.4. Electrochemical measurements
electrochemical measurements were carried out in a battery testing system (LAND CT 2001A) in a potential range from 0.01 V to 3 V.
3. RESULTS AND DISCUSSION
3.1. Material characterization
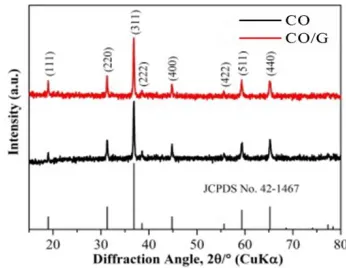
[image:3.596.211.384.335.469.2]Figure 1 shows the XRD patterns of CO and the CO/G composite. The diffraction peaks in the diagram belong to the spinel-phase (111), (220), (311), (222), (400), (422), (511) and (440) crystal surfaces of CO, and all the diffraction peaks correspond to cubic CO (JCPDS No. 42-1467). There are no cluster peaks, and the lattice parameters are a=b=c=8.0840 Å[18]. In the CO/G composite, there is no characteristic peak of graphene at 26°, which may be due to the uniform distribution of graphene on the surface of CO. From the diagram, we have successfully synthesized single-phase CO and CO/G complexes, and the crystallinity is good.
Figure 1. XRD patterns of CO and CO/G at 2 theta from 3° to 80°.
[image:3.596.136.465.515.683.2]
Figure 2 (a) shows the FESEM images of CO. From the graph, CO shows a homogeneous nanofiber structure.Figure 2 (b) shows the SEM image of the CO/G composite; it can be seen that CO is uniformly attached to the surface or interlayer of graphene, forming an interconnected whole, and graphene plays a bridging role, which is beneficial to the transfer of Li+. To further study the elemental distribution of the CO/G composite, we performed EDS analysis, as shown in Figure 2 (d-f). The diagram shows that the elements of Co, C and O are evenly distributed. This result shows that graphene is distributed uniformly on the CO nanofibers.
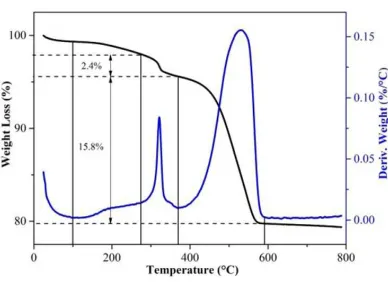
Figure 3 shows a thermogravimetric and differential thermogravimetric map of the CO/G composite. According to the diagram, four weight-loss processes occurred over the whole temperature range. The first weight loss was below 100 °C, which is the evaporation of water in the precursor. The second weight loss occurred at 100~275 °C, corresponding to the decomposition process of the oxygen-containing functional groups in the by products[19]. The third weight loss at 275~370 °C belongs to the reduction of amorphous carbon, with a content of approximately 2.4%. The last weight loss occurred at 370~600°C, corresponding to the decomposition of graphene, with a content of approximately 15.8%.
Figure 3. TG and DTG curves of CO/G.
3.2. Electrochemical performance
Figure 4 is the first charge/discharge curve of the CO and CO/G composite in a voltage range of 0.01-3.0 V at a current density of 0.1 C (1 C=890 mAh g-1). The figure shows that the two electrode materials have a long voltage platform at 1 V during the first charge and discharge process, which is due to the reduction of CO to the single substance Co[20]. It is worth noting that for the CO/G composite electrode there is a more positive voltage trend in the 0.75-0.01 V interval, which is due to the lithium intercalation in graphene, providing a part of the capacity. In the range of 1.8-2.2 V, a reversible reaction occurred, and Co and Li2O were transformed into CO and Li[21]. The initial
[image:4.596.201.395.334.475.2][image:5.596.207.393.145.283.2]
slightly lower than that of CO, which is due to the substantial specific surface area of graphene; this specific surface area is caused by a larger SEI film on the surface of the electrode, which consumes a large amount of Li+[23].
Figure 4. Initial discharge/charge curves of the CO and CO/G composite at a current density of 0.1 C.
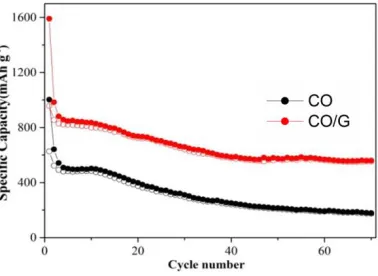
Figure 5 compares the cyclic performance of the CO and CO/G composite electrode materials. After 70 cycles, the reversible capacity of the CO/G composite electrode is still 550 mAh g-1, while that of the CO electrode is only 170 mAh g-1. This is because the CO electrode is passivated seriously during the cycling process and because its low electronic conductivity may also lead to severe capacity attenuation. Therefore, superior cycle performance is ascribed to the hybrid CO/G composite structure.
Figure 5. Cycle performance of CO and CO/G composite at a current density of 0.1 C.
[image:5.596.201.390.442.580.2]
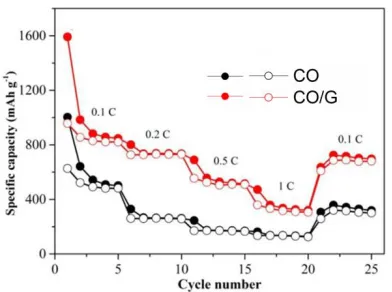
Figure 6. Rate performances of CO and CO/G composite at various current densities from 0.1 C to 1 C.
[image:6.596.207.403.67.213.2]Furthermore, to demonstrate the excellent electrochemical performance of the CO/G composite, a comparison of electrochemical performances for similar anode materials is listed in Table 1. It can be seen that the CO/G composites exhibit stable cycle performance among these reported anode materials for lithium-ion batteries.
Table 1 Comparison of various anode materials for LIBs.
Material Current density
(C)
Capacity (number of cycles) Reference
CO/G 0.1 550 (70) This work
TiO2 spheres 0.1 208 (100) 24
Co3O4@graphene 0.1 210 (50) 25
4. CONCLUSIONS
In conclusion, 1D CO nanofiber graphene composites were successfully synthesized by a two-step hydrothermal method. Compared with pure CO, the CO/G composite has a higher reversible capacity and better cycling stability. At a current density of 0.1 C, the first discharge capacity and charge capacity for the CO/G composite are 1591.4 mAh g-1 and 957 mAh g-1, respectively. The reversible capacity can still reach 550 mAh g-1 after 70 cycles. In addition, CO/G composites have better rate performance. When the current density is changed from 0.1 C to 1 C, the reversible capacity of the CO/G composite at 1 C can still reach 550 mAh g-1. When the current density returns to 0.1 C, its capacity remains at 680 mAh g-1.
ACKNOWLEDGMENT
[image:6.596.85.514.401.511.2]
References
1. Q. Yang, W. Wang, H. Li, J. Zhang, F. Y. Kang and B. H. Li, Electrochim. Acta, 270 (2018) 96. 2. F. Zheng, M. Kotobuki, S. F. Song, M. O. Lai and L. Lu, J. Power Sources, 389 (2018) 198. 3. Z. Chen, Y. C. Qin, D. Weng, Q. F. Xiao, Y. T. Peng, X. L. Wang, H. X. Li, F. Wei and Y. F. Lu,
Adv. Funct. Mater., 19 (2009) 3420.
4. K. Hua, X. J. Li, D. Fang, J. H. Yi, R. Bao and Z. P. Luo, App. Surf. Sci., 447 (2018) 610 . 5. D. P. Aurelien, I. Plitz, S. Menocal and G. Amatucci, J. Power Sources, 115 (2003) 171.
6. G. R. Wang, F. L. Zhu, J. Xia, L Wang, Y. S. Meng and Y. Zhang, Electrochim. Acta, 257 (2017) 138.
7. J. Yan, Z. J. Fan, W. Sun, G. Q. Ning, T. Wei, Q. Zhang, R. F. Zhang, L. J. Zhi and F. Wei, Adv. Funct. Mater., 22 (2012) 2632.
8. V. Khomenko, E. Raymundo-Pinero and F. Béguin. J. Power Sources, 153 (2006) 183. 9. Y. Y. Chen, Y. Wang, H. X. Yang, H. Gan, X. W. Cai, X. M. Guo, B. Xu, M. F. Lv and A. H.
Yuan, Ceram. Int., 43 (2017) 9945.
10. T. Brousse and D. Bélanger, Electrochem. Solid State Lett., 6 (2003) A244. 11. F. C. Zheng, Z. C. Yin, H. Y. Xia and Y. G. Zhang, Mater. Lett., 197 (2017) 188.
12. O. K. Park, Y. H. Cho, S. H. Lee, H. C. Yoo, H. K. Song and J. Cho, Energ. Environ. Sci., 4 (2011) 1621.
13. S. M. Abbas, S. T. Hussain, S. Ali, N. Ahmad, N. Ali and K. S. Munawar, Electrochim. Acta, 105 (2013) 481.
14. L. G. Guo, Y. Ding, C. Q. Qin, W. Li, J. Du, Z. B. Fu, W. L. Song and F. Wang, Electrochim. Acta, 187 (2016) 234.
15. L. L. Xing, Z. H. Chen and X. Y. Xue, Solid State Sci., 32 (2014) 88.
16. M. W. Yuan, Y. Yang, C. Y. Nan, G. B. Sun, H. F. Li and S. L. Ma, App. Surf. Sci., 444 (2018) 312.
17. Y. Jiang, X. M. Yan, W. Xiao, M. L. Tian, L. Gao, D. Y. Qu and H. L. Tang, J. Alloy. Compd., 710 (2017) 114.
18. B. Li, X. G. Wei, Z. R. Chang, X. N. Chen, X. Z. Yuan and H. J. Wang, Mater. Lett., 135 (2014) 75.
19. Y. L. Ding, J. A. Xie, G. S. Cao, T. J. Zhu, H. M. Yu and X. B. Zhao, Adv. Funct. Mater., 21 (2011) 348.
20. W. Tang, X. J. Wang, Y. Y. Hou, L. L. Li, H. Sun, Y. S. Zhu, Y. Bai, Y. P. Wu, K. Zhu and T. Ree, J. Power Sources, 198 (2012) 308.
21. S. Li, G. Ren and M. F. Hoque, Appl. Surf. Sci. 396 (2017) 637.
22. H. Chen, H. Liu, Y. Guo, B. Y. Wang, Y. H. Wei, Y. Zhang and H. Wu, J. Alloy. Compd., 731 (2018) 844.
23. H. Kim, J. T. Lee and D. C. Lee, Adv. Energy Mater. 3 (2013) 1308.
24. L. Y. Pan, H. B. Zhao, W. C. Shao, X. W. Dong and J. Q. Xu, J. Mater. Chem. A, 105 (2015) 305. 25.H. F. Long, M. Y. Zhang, Q. Wang, L. L. Xing, S. Wang and X. Y. Xue, J. Alloy. Compd., 701 (2017) 200-207.