28 December 2004
Modelling P Dynamics in soil
- Decomposition and Sorption
Technical report
Concepts and User Manual
Developed by
Birgitte Gjettermann
At
DHI Water and Environment
Hydrology, Solid and Waste Department
In corporation with
The Royal Veterinary and Agricultural University
Department of Natural Science
&
Department of Agricultural Science
Modelling P Dynamics in soil
- Decomposition and Sorption
Technical report
Concepts and User Manual
Agern Allé 11
DK-2970 Hørsholm, Denmark
Tel: +45 4516 9200 Fax: +45 4516 9292 Dept. fax:
e-mail: [email protected] Web: www.dhi.dk
Author
Industrial Ph.D. student Birgitte Gjettermann
Date
Preface
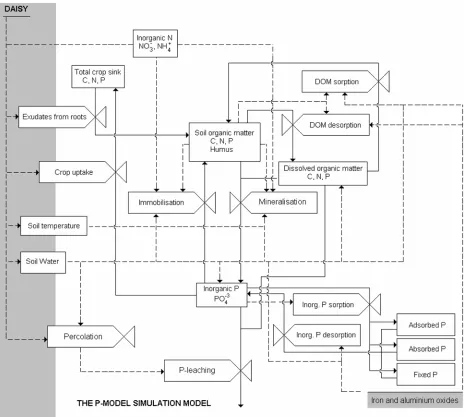
This report presents a technical description of a code/model concept simulating mobilization and immobilization of phosphorous (P). The mobilization and immobilisation processes of P are represented by sorption and desorption of P and by decomposition of organic matter with min-eralization or immobilisation of P. The code/model, referred to as the P-Model, works with an-other model, called Daisy. Daisy1 is a public shareware developed at the Royal Veterinary and Agricultural University (KVL), which simulates N and C dynamics in the soil-plant-atmosphere system and consists of several sub-models for soil water and solute movement, soil tempera-ture, soil organic matter, soil mineral N, crop growth, and system management {Hansen, 1990 90 /id}.
The report and model were developed as part of the industrial Ph.D.-project Modelling Phos-phorus Dynamics in Soil – Decomposition and Sorption, at DHI Water & Environment in corpo-ration with The Royal Veterinary and Agricultural University (KVL). The Danish Academy of Technical Science and DHI Water & Environment financed the industrial Ph.D.-project. Fur-thermore, the industrial Ph.D.-project has worked together with a research program Regional Groundwater Protection by Optimized Organic Farming Systems financed by Danish Research Centre for Organic Farming.
I would like to thanks Finn Pilgaard Vinther at Danish Institute of Agricultural Science, Depart-ment of Agroecology, for helpful corporation, information and making data available for calibra-tion and validacalibra-tion of the P-Model. Anders Pedersen from KVL, Department of Agricultural Sci-ence, has been very helpful, providing participation for the simulations with grazing cattle and grass-clover. Per Abrahamsen from KVL, Department of Agricultural Science, has also been very helpful with programming in C++ and running the Daisy model. Also, I would like to thanks the supervisors of the Ph.D.-project Søren Hansen and Hans Christian Bruun Hansen at KVL, Department of Agricultural Science and Department of Natural Sciences, respectively; and the supervisor Merete Styczen at DHI Water & Environment, Department of Hydrology, Solid and Waste.
Birgitte Gjettermann
(EF 879, Lc 2052)
Summary
Weather-driven simulation modelling has become an important component of studies of soil nu-trients, both for crop growth and for losses by leaching to the environment. In order to model phosphorus (P) dynamics in soil, the mobilisation and immobilisation processes of inorganic and organic P species is important for quantifying P leaching from the unsaturated zone. The mobili-zation and immobilisation processes of P are represented in this project by sorption and desorp-tion of P and by decomposidesorp-tion of organic matter with mineralizadesorp-tion and immobilisadesorp-tion of P.
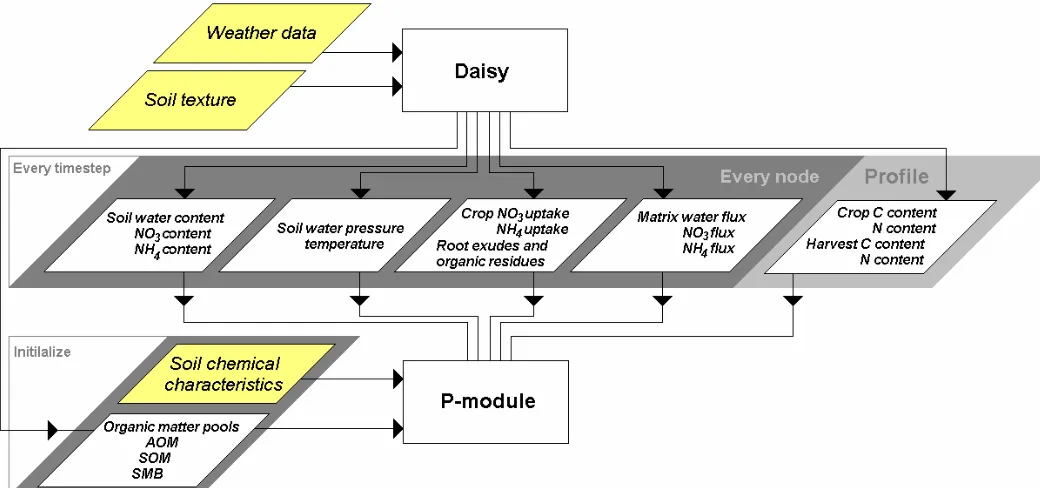
The code/model presented here, referred to as the P-Model, works with another model, called Daisy. The Daisy code delivers input data of water content, water flux, temperature, inorganic nitrogen (N), crop uptake of N, and crop root exudates, to the P-Model. The P-Model must be considered as a prototype of a P module in Daisy, as the user-friendliness is limited and not all aspects are described in details. For instance crops are described as very simple sink terms, in spite of the fact that they are very important in the P dynamic of soils. Soil ploughing and har-rowing are not included in the P-Model and therefore some limitations of the Daisy set up must be considered.
The concept of the turnover of soil organic matter is based on the organic matter module in Daisy. The simulation of the organic matter balance and the nitrogen dynamics is strongly inter-connected in Daisy as the organic matter model is considered an integral part of the overall ni-trogen balance model. It is assumed that the activity of soil microbial biomass is related to the substrate availability; and that it is reasonable to relate the N mineralization and immobilization with decomposition of soil organic matter (SOM). Daisy does not include P in the organic matter module. However, like N it seems reasonable to relate P mineralization and immobilization to the decomposition of SOM.
In the P-Model organic matter is defined with respect to C, N, and P and is represented by dif-ferent pools in the model, representing easily degradable and recalcitrant pools, microbial pools, and a dissolved pool. The dissolved organic matter (DOM) pool is produced by microbial degra-dation of organic matter and by physical/chemical desorption from the most bio available pool of soil organic matter. Hence, DOM may also be immobilized by sorption to the soil organic matter pool. The P-model also includes addition of organic and inorganic fertilizers, crops, and solute transport by convection.
One of the main issues during parameterisation of the DOM dynamics has been to identify and particularly to quantify the sources of DOM in soil. It is assumed that DOM is produced by the soil microbial biomass (SMB) pool and the SOM pool. DOM production is not directly linked to the input of organic material as fresh litter, dead roots, and organic fertilizer, because the contri-bution of DOM from all these different sources probably is very different and not known at this stage. However, theses sources is very bioavailable to the microbial biomass promoting fast turnover and growing microbial biomass, which contribute to the production of DOM. Hence, the DOM dynamic is closely linked to the dynamic of the AOM pools. The biological decomposition of DOM and associated P in the P-Model has been parameterised from literature (e.g. C/P ra-tios, decay rates and diffusion coefficients of DOM).
‘equilibrium’ concentration to the actual DOM concentration in the soil, incorporating considera-tions as diffusion and sorption time into the description of the sorption/desorption process. De-pending on whether the DOM concentration is above or below the ‘equilibrium’ concentration then the DOC concentration in the soil is reduced or increased, respectively. Reducing the sorp-tion/desorption rate coefficients the exchange between part of the SOM pool and the DOM pool is reduced. The best fit of simulations to measured DOC and DOP concentrations in batch ex-periments was found by using desorption and sorption rate coefficients of 0.001 hour-1.
Additionally, the P-Model considers sorption of inorganic P, which is described by a three-step mechanism: 1) A fast sorption mechanism, and, 2) a relative slow absorption mechanism, plus 3) a very slow fixation process. Thus, its is hypothesised that inorganic phosphate first binds to easily available sorption sites with high affinity, and then the less available sites which is limited by diffusion and further migration into the soil particle to sorption sites less available. Langmuir describes all three processes at ‘equilibrium’. As for DOM, kinetic terms couples the ‘equilibrium’ concentrations of the different inorganic P pools to the actual P concentration in the soil, incor-porating considerations as diffusion and sorption time into the description of the sorp-tion/desorption processes. The sorption of inorganic P has been parameterised from sorption data and literature (e.g. sorption affinity constant and sorption capacities). Due to the concept of instantaneous process of adsorption, which implies an adsorption rate coefficient of 1 h-1 in this
model, the other rates have been fitted based on this assumption. The process of absorption has been fitted to obtain equilibrium within 3-4 days. The fixation process has been adjusted not obtain equilibrium during 14 days. The slow desorption rate has not been included during these test. So, whether the slow process is considered reversible or irreversible is still up to discussion in the concept. The distribution of the sorption capacities between the three P pools was shown to have limited effect of the sorption dynamic The distribution of the total sorption capacity be-tween the three sorbed phases has been parameterised based on the assumption that the quickly sorbed fraction has 1/3 of total sorption capacity. By fitting the P-Model to data of sorp-tion experiments on two different soils, it was found that 1/4 of the total sorpsorp-tion capacity is cated to the absorbed phase for both top and subsoils. The rest of the sorption capacity is allo-cated to the slow, fixed pool. The sorption affinities are very dominating for the sorption dynamic. The sorption affinities were initially assumed to be in the range of 10-120 mM-1 as
of-ten found by fitting Langmuir constants during sorption experiments. However, the best fit to measured sorption data to two subsoils were made by using rather high values for the sorption affinity constants (400-200 mM-1) for the adsorbed, absorbed and fixed processes. The P
sorp-tion of the two topsoils behaves very different which could be due to a pH effect. It was not pos-sible to parameterise the affinity constants for the three sorption processes similar for the two top soils, maybe because effects of initial soil pH are not taking into account in the parameteri-sation.
CONTENTS
1
INTRODUCTION ...1-7
1.1 Purpose of this report ...1-82
TURNOVER OF ORGANIC P ...2-9
2.1 The organic matter fractions ...2-102.1.1 Dissolved organic matter ...2-10
2.2 Decomposition and mineralization of substrate...2-11
2.2.1 Kinetics of C flow ...2-13 2.2.2 Effect of temperature ...2-15 2.2.3 Effect of soil moisture ...2-15 2.2.4 Effect of clay content ...2-16 2.2.5 Immobilisation and mineralization of inorganic N and P ...2-16
3
SORPTION OF DISSOLVED ORGANIC MATTER...3-18
3.1 Sorbed phase of DOM ...3-183.2 DOM sorption at equilibrium...3-19
3.2.1 The Initial Mass isotherm...3-20 3.2.2 Null-point concentration of DOC ...3-24
3.3 The kinetic approach of DOM sorption...3-25
4
SORPTION OF DISSOLVED INORGANIC P...4-27
4.1 DIP sorption at equilibrium ...4-274.1.1 Sorption capacities ...4-28 4.1.2 Sorption affinities ...4-29
4.2 The kinetic approaches of DIP sorption ...4-30
5
WATER AND SOLUTE TRANSPORT ...5-33
5.1 Water transport ...5-335.1.1 Boundary conditions ...5-34
5.2 Solute transport ...5-35
5.2.1 Boundary conditions ...5-36
6
CROPS ...6-37
6.1 Crop N uptake ...6-376.2 Crop P uptake...6-37
6.3 Dead plant residues and root exudes ...6-38
6.4 Harvest...6-38
7
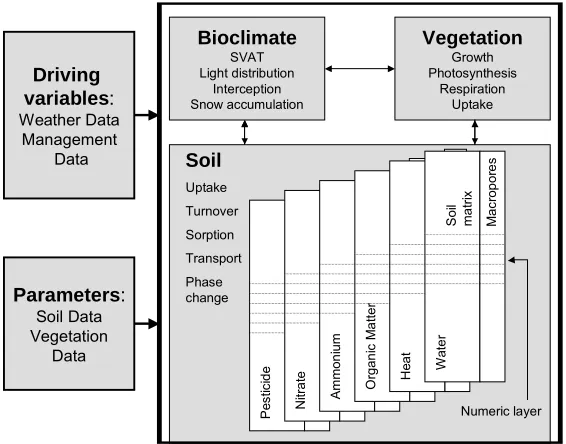
SYSTEM AND MODEL STRUCTURE OF DAISY-P ...7-39
7.1 Daisy a Soil-Plant-Atmosphere system model...7-397.3 General data flow ...7-42
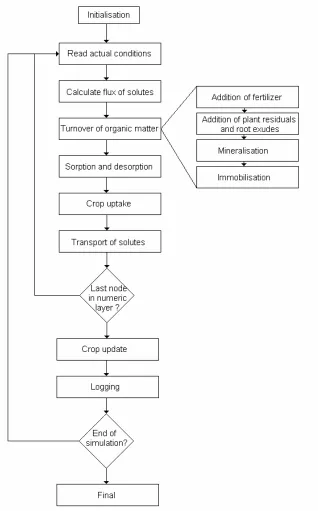
7.3.1 The main program ...7-43
8
USER MANUAL ...8-44
8.1 Installation and running the P-Model...8-448.1.1 Daisy-P.exe ...8-44 8.1.2 Check-setup.exe...8-44
8.2 Input data...8-44
8.2.1 Setup a *.dai file for the Daisy model...8-45 8.2.2 The spreadsheet Daisy-P.xls...8-51
8.3 Output data...8-53
8.3.1 Settings.log ...8-53 8.3.2 P.log, N.log, and C.log...8-53 8.3.3 Sorb_out.log ...8-54 8.3.4 Flux_leach.log...8-54 8.3.5 Plant.log...8-54 8.3.6 Climate.log...8-54
9
TEST OF CODE ...9-55
9.1 Test of basic turnover of organic matter ...9-559.2 Test of transport ...9-56
9.3 Test of fertilizer addition ...9-57
9.4 Test of crops ...9-58
9.5 Test of DOM sorption module...9-59
9.6 Test of the inorganic P sorption module ...9-60
10
PARAMETERISATION ...10-62
10.1 Turnover of organic P ...10-6210.1.1 C:P ratios ...10-62 10.1.2 Flow fraction ...10-63 10.1.3 Microbial efficiency ...10-63 10.1.4 Turnover rate ...10-63 10.1.5 Plant residuals and root exudates ...10-64 10.1.6 Addition of organic fertilizer ...10-65 10.1.7 Immobilization rate coefficient for PO4-P ...10-66
10.1.8 Summary of DOM turnover parameterisation ...10-66
10.2 Sorption of DOM...10-66
10.2.1 Soil characteristics...10-66 10.2.2 Sorption experiments with DOM ...10-67 10.2.3 Effect of sorption/desorption rate constants at batch scale ...10-70 10.2.4 Effect of sorption/desorption rate constants at field scale ...10-70 10.2.5 Calibration results fitting simulation to data of Burrehøjvej field soil...10-71 10.2.6 Effect of DOM sorption/desorption on the organic matter dynamics ...10-74 10.2.7 Summary of DOM sorption/desorption parameterisation...10-74
10.3 Sorption of inorganic P...10-75
10.3.4 Effects of sorption affinity constants ...10-79 10.3.5 Effects of sorption capacity distribution ...10-81 10.3.6 Fitting sorption affinity constants to data of Burrehøjvej field soil ...10-82 10.3.7 Fitting sorption capacity and affinity constants to data of Farre soil ...10-84 10.3.8 Summary of phosphate sorption/desorption parameterisation ...10-86
11
VALIDATION OF DOM MOBILISATION AND IMMOBILISATION...11-87
11.1 Burrehøjvej field experiments...11-8711.1.1 Hydraulic and textural properties ...11-87 11.1.2 Soil treatments...11-88
11.2 Setup a *.dai file for grass clover and grazing cattle ...11-88
11.3 Simulations of different soil treatments at Burrehøjvej fields ...11-90
11.4 Summary of DOM validation ...11-95
12
FIGURE CAPTIONS ...12-96
13
TABLE CAPTIONS ...13-99
14
REFERENCE LIST...14-100
1 INTRODUCTION
Phosphorus in the form of ortho-phosphate reacts readily with soil components, however, the soil capacity to bind phosphate may be limited if phosphorus systematically is applied in excess of plant need. Intensively cultivated soils accumulate phosphorus when the amount of phospho-rus added in fertilizers, manure or sludge exceeds the amount exported in biomass, plant up-take, and P lost by leaching (Heckrath et al., 1995; Del Campillo et al., 1999). This enrichment has led to increased availability of phosphate beneficial to plant production. But at the same time the risk of phosphate transport out of the soil has increased (Heckrath et al., 1995). Phos-phorus is an important nutrient for plants and animals; however, high levels of phosPhos-phorus es-pecially in fjords and lakes may cause increased algae bloom affecting the environment nega-tively (Kronvang et al., 2001).
It is not clear to what extend roots and microorganisms compete for phosphorus sources (Frossard et al., 1995). However, mineralization of organic P is an essential process in maintain-ing the concentration of labile inorganic P in many soils (Stewart and Tiessen, 1987), and nu-merous laboratory and field studies indicate the important role of organic P in soil P dynamics. McLaughlin and Alston (1986) and McLaughlin et al. (1988) used isotopic techniques to evalu-ate the incorporation of 32PO
4 and 33PO4 derived from mineral fertilizer and from plant residues
into the microbial biomass. They found a rapid incorporation of P from plant residues and min-eral fertilizers into the microbial biomass. Soil microorganisms affect P dynamics by their activity and represent an organic P compartment, which can act as a sink and source of plant available P (Macklon et al., 1997; Stewart and Tiessen, 1987).
Dissolved organic matter (DOM) is supposed to represent the most active and mobile form of organic matter in soil (Zech et al., 1997; Zsolnay, 1996). DOM mobility is a major factor affecting the export of nutrients from soils to surface waters. E.g. nitrogen (N) and phosphorus (P) in DOM can make up a significant fraction of total dissolved concentrations of N and P in soil pore water. Thus, Qualls et al. (1991) estimated that > 90 % and > 66 %, respectively, of total dis-solved N and P leaching from a deciduous forest soil were in the form of disdis-solved organic N (DON) and dissolved organic P (DOP), respectively. Additionally, Grant et al. (1996) estimated that DOP accounted for 16 - 23 % of the annual loss of total P from four arable catchments in Denmark. DOM is usually quantified in term of its carbon content, which is referred to as dis-solved organic carbon (DOC) and generally, DOC compromises 50 % of DOM (Tipping et al., 1999). However, DON and DOP also play an important role in nutrient cycling as dissolved or-ganic N and P represent labile, readily mineralizable pools that will be important to the availabil-ity of these nutrients particularly in unfertilized soils.
fraction of the total SOM pool that may be solubilized and lost to either microbial decomposition or leaching (David and Vance, 1991). Zsolnay (1996) stated that the greatest and most consis-tent source of DOM presumably is the immobile SOM, which is approximately 100 fold more abundant than the DOM itself. Additionally, it is often found that soil is able to release DOM when exposed to aqueous solution containing no or very low concentrations of DOM (Kaiser, 2001; Nodvin et al., 1986). Thus, the soil solid phase may not only sorb DOM but may also re-lease it depending on solution DOM concentrations.
Weather-driven simulation modelling has become an important component of studies of soil nu-trients, both for crop growth and for losses by leaching to the environment as pollutants. In order to model P dynamics in soil, mobilisation and immobilisation processes of inorganic and organic P species is important for quantifying P leaching from the unsaturated zone.
1.1
Purpose of this report
This report presents a technical description of a code/model concept simulating mobilization and immobilization of inorganic and organic P fractions in soils. The code/model presented here is referred to as the P-Model. Despite indication of, that particle associated P contributes signifi-cantly to the total loss of P in agricultural soil (Grant et al., 1996), this is out of scope in the P-Model at this stage. Hence, in this report DOM is defined as dissolved organic substances pass-ing through a 0.45 µm filter. The dissolved substances are quantified with respect to C, N and P which is referred as DOC, DON, and DOP, respectively. Additionally, this report describes how to use the P-Model in practice.
The description of inorganic P sorption and sorption of DOM associated P together with the generation of DOM-associated P form the basis of the P-Model. In order to develop a model that can simulate P mobilisation processes in different soils, it has been attempted to relate sorp-tion/desorption mechanisms of inorganic and organic P to soil properties. Therefore, when pos-sible the description of the sorption/desorption mechanisms has been related to soil parameters (e.g. aluminium, iron, organic matter content) instead of arbitrary constants.
2
TURNOVER OF ORGANIC P
Soil organic matter usually comprises dead plant, animal and microbial material, both fresh and at all stage of decomposition as well as ‘humified’ material that cannot be assigned to any par-ticular source. The pathways from fresh organic matter to humus are not well elucidated. How-ever, this turnover can largely be attributed to microbial activity (Insam, 1996). Mineralization of organic P is thought to be an essential process in maintaining the concentration of labile inor-ganic P in many soils (Stewart and Tiessen, 1987). The production of phosphatase either by roots or associated microorganisms is an efficient strategy for the acquisition of phosphate by plants (Tarafdar and Claassen, 1988). However, the process of soil P mineralization is not the only process favouring the mobility of P. Hence, Kaiser (2001) found that DOM is very important for the export and loss of organically bound plant nutrients as P.
The microbial biomass is itself part of the soil organic matter, typically about 2 % of the total or-ganic C. It is defined as the living microbial component of the soil and includes bacteria, actino-mycetes, fungi, protozoa, algae and micro fauna (Sparling, 1985). In the rhizosphere bacterial numbers are much higher than in the bulk soil and the organism differ in their species physio-logical requirements (Sparling, 1985). In the rhizosphere, bacteria benefit from the diffusion of a wide variety of soluble materials, especially sugars and amino acids leached from the roots and also from the mucilage produced by the root cap and from sloughed-off plant cell materials (Lynch and Whipps, 1990). Roots can lose a considerable proportion of their photosynthate to their growth medium, and for soil-grown plants losses up to 23 % of the fixed photosynthate are recorded (Sparling, 1985).
Soil microorganisms are an important reservoir of labile C, N, S, and P compounds. Microbial P can range 7-100 kg P ha-1, depending on the type of cultivation (Brookes et al., 1984) and con-sist of about 60 % of nucleic acids, 20 % of sugar and nucleotide esters and various phosphory-lated co-enzymes and polyphosphates, and less than 10 % of phospholipids (Stewart and Ties-sen, 1987). Soil organic P constitutes between 20 and 80 % of total P in the surface layer of soils. Organic P compounds in soils are derived from plants and microorganisms. Most forms of organic P are common to microbes and occur as relatively low molecular weight compounds such as inositol phosphates, nucleic acids, phospholipids and a small amount of sugar phos-phates (Frossard et al., 1995). Phytate, myo-inositol 1,2,3,4,5,6-hexakisphosphate is ubiquitous in the plant kingdom particular in mature seeds such as in cereal grains and legumes, fruits and vegetables. In mammalians such as swine, horse, and fowl, phytase activity is too low to digest the phytate. As a result swine, horses, and fowls excrete large amounts of undigested phytate with manure into the soil (Pandey et al., 2001). Rhizosphere organisms are commonly high in phosphates and often contain inositol polyphosphates granules. Away from roots most bacterial activity is isolated in discrete micro sites around organic residues, and the bacteria are usually smaller and lack polyphosphates granules (Foster, 1986). Organic P released by secretion or cell lysis into the soil environment can be taken up by soil organisms, or after hydrolysis, by plants. Alternatively, it can be stabilized as part of the soil organic matter through its organic moiety, or by interactions of the phosphate group with mineral components (Stewart and Ties-sen, 1987).
2.1
The organic matter fractions
Microbes selective degrade the less recalcitrant compounds and thus gradually increase the average recalcitrance of the non-respired organic matter (Sollins et al., 1996). In order to divide the dead native soil organic matter into recalcitrant and less recalcitrant fractions, it is fraction-ated into three pools with different turnover rates, SOM1, SOM2 and SOM3, respectively. In some organic soil as peat soils, a large humified pool may be almost inert. The SOM3 pool represents a deactivated pool of humified organic matter. SOM1 is considered as the chemically stabilized organic matter, which is decomposed at a relatively slow rate. SOM2 is physically stabilized organic matter decomposing relatively fast, approximately three times faster than SOM1. SOM2 is considered as the least recalcitrant and stabilized fraction of SOM and it is the most bioavailable fraction for microbes.
Added organic matter (AOM) is defined as input of new organic substances to the soil system. AOM could be organic fertilizer as farmyard manure or slurry. Additionally, green crops, roots or plant residues left on the field after harvest, are input of new organic material and subject for degradation in the organic matter cycle. As for SOM, input of new organic substances is frac-tionated into two fractions, AOM1 and AOM2, which consist of relatively slowly and easily de-gradable organic matter, respectively. However, some fraction of partly decomposed organic matter as farmyard manure or slurry can also be allocated to the SOM2 fraction as it is already partly degraded by microbes.
Microorganisms in soil may be classified into two groups with different strategies. The primary stage of decomposition of readily decomposable substrates is performed by rapidly responding life forms. The subsequent stage is dominated by slower growing, highly specialized life forms {Insam, 1996 180 /id}. In order to have a stable as well as a dynamic microbial biomass; the soil microbial organic matter fraction is subdivided into SMB1 and SMB2. The SMB1 fraction is con-sidered to be the stable fraction while SMB2 is the dynamic fraction.
In summary, organic matter is allocated to three defined fractions in Daisy: Added organic mat-ter (AOM), dead native soil organic matmat-ter (SOM), and soil microbial biomass (SMB) which is divided into more and less dynamic pools. A fourth more arbitrary fraction is defined in the fol-lowing section, dissolved organic matter (DOM).
2.1.1
Dissolved organic matter
Soil solutions contain varying amounts of DOC, which originate from plant litter, soil humus, mi-crobial biomass or from root exudates (Kalbitz et al., 2000). As DOC moves deeper into the soil, its biological availability decreases, reflecting either transport of residual, recalcitrant compo-nents of DOC, or a physical desorption / dissolution flux of C from SOM to DOM (Qualls and Haines, 1992). DOM is produced principally by microbial activity, root exudation, and leaching from litter and humus in the soil. However, the quantitative contribution made by each of these sources is controversial as mentioned in the introduction.
Data of change in 14C indicate that most DOC in the soil is fairly old, at least 30 years at 5 cm
depth (Tegen and Dorr, 1996) and at 10-25 cm (Trumbore et al.,1992) supporting that leaching of DOM from SOM rather than of recent litter is the major source of DOM. This is supported by findings of Hagedorn et al. (2004) who investigated the origin of DOC in a 4-year experiment exposing spruce and beech, growing on a sandy loam and on calcareous sand, to CO2 depleted
in 13C. In the soil solution of the topsoil, DOC contained only 5-10 % new C from the trees.
recalcitrant native C in the soils, whereas easily degradable new components are rapidly con-sumed by microbes and thus make only a minor contribution to DOM.
In the P-Model it is considered, that DOM is rather old, assuming that easily degradable new components are rapidly consumed by microbes and cannot be distinguished from the AOM pools. Hence, DOM is mainly produced from SOM by some physical/chemical/biological proc-esses resulting in that some part of SOM in soil is dissolved. The physical/chemical procproc-esses are described in the next paragraph. The biological processes, described in this paragraph, re-lease a fraction of metabolites as DOM during microbial degradation of organic matter. When some transformation occurs in the organic matter fractions, for instance by external cellular en-zymes or chemical hydrolyses, a water-soluble organic matter fraction is produced. In this way the DOM fraction is related to decomposition of the other organic fractions. Depending on the sources, DOM has variable C/N- and C/P-ratios in accordance with the sources.
2.2
Decomposition and mineralization of substrate
Mineralization of organic C follows microbial P with time in different farming systems, indicating that organic C mineralization occurs concomitantly with organic P (Oberson et al., 1996). In the P-Model organic matter and nutrients support high microbial activity, stimulating C turnover and mineralization of inorganic P. Additionally, the production and degradation of organic P in the organic pools is correlated to the C production and degradation.
Each organic pool is quantified according to C and N in Daisy. The P-Model quantifies also the pools with respect to P by simulating the same C transformations between the organic pools and correlate C to P by C:P ratios. This paragraph presents briefly the organic matter module defined in Daisy and couples it to turnover of P. An overview of the individual soil organic frac-tions and the internal dynamics between the fracfrac-tions can be viewed in Figure 1. The C flow be-tween the organic pools, X, is described by the following seven equations in which the sub-scripts (se Figure 1) refers to the various flow fractions of C in organic matter.
eq. 2-1
AOM1 D
AOM1
AOM1 I
t
C
ς
− =f
d d
eq. 2-2
AOM2 D
AOM2
AOM2 I
t
C
ς
− =f
d d
eq. 2-3
[
SOM1 SOM1 DOM SOM2]
SMB1SMB1
SMB1 E (1 )
t
C
ς
ς
ς
− −
− +
= f f
d d
eq. 2-4
eq. 2-5
[
SOM2 DOM SMB2 2 SMB1 AOM1 AOM2 DOM]
SMB2SMB2
SMB2 E (1 )D D
t
C
ς
ς
ς
ς
− +
+ +
+ −
−
= f f fSMB
d d
(
SOM1)
SOM2 1SOM1
t C
SOM f
d
d
ς
ς
− =
eq. 2-6
(
AOM1 AOM2)
D SOM2 SMB2(
2)
SMB1 SOM2SOM2 1 I D 1 D )
t
C
ς
− −
− + +
− −
= f f f fDOM fSMB
eq. 2-7
DOM SOM2
SMB2 SMB1
DOM
DOM (D D )
t
C
ς
ς
− +
+ =f
d d
CX: Carbon concentration in soil of pool X [kg m-3] ς : Turnover rate of pool X [kg m-3 hour-1]. E : Substrate utilization efficiency of pool X. D : Death rate of pool X [kg C m-3 hour-1]. f : Flow fraction of pool X.
[image:14.595.131.525.260.669.2]ID: Carbon input.
Figure 1. Interrelationship between the soil organic fractions in the Daisy-P Model showing the flow fractions, fX, to the different pools X. AOM1 and AOM2 corresponds to the slowly and easily
If we consider equation eq. 2-6 the SOM2 pool receives every time step (1 hour) inputs from partly decomposed organic matter, such as manure, if there is any input. Additionally, SOM2 receive the death microbes from the SMB2 and SMB1 pools. The SOM2 pool is decomposed at a given rate described in eq. 2-9. Hence, the amount decomposed is lost from the pool. Thus, the change in C content of every organic pool during one time step is net fluxes of the amount received and lost.
New organic substrate, dead roots or leaves, root exudates, and organic fertilisers are applied to the systems as inputs to the fractions AOM1 and AOM2. Depending on the substrate it is fractionated to the two pools in specific fractions given by fAOM1 and fAOM2, respectively (Figure.
1). In case of farmyard or manure, some of the added organic matter is already partly degraded into smaller molecules and contribute to the SOM2 fraction. Carbon input of new organic sub-strate is given by ID, which is an input function given by eq. 2-8 (Hansen et al., 1990):
eq. 2-8
⎪
⎪
⎩
⎪⎪
⎨
⎧
∆ + 〈 〈 ∆
=
else 0
t 0 t t 0 t t C I
D I
t : Time [s].
IC : Organic carbon input [kg C m-3].
The Delta functions ensure that inorganic matter is added in short time intervals between time t0
and the time t0+∆t.
As microbes assimilate low molecular-weight compounds, some C is respired to produce en-ergy, and the rest is synthesized into either new tissues (growth) or metabolites that are re-leased to the extracellular environment (Sollins et al., 1996). The SMB1 and SMB2 are charac-terized by a substrate utility coefficient, E, which depend on the microbial community and the bioavailability of the substrate, X. The substrate utility coefficient, E, refers to the fraction of sub-strate which is incorporated into the microbial biomass. The rest is mineralised, releasing CO2
and inorganic N and P.
The decomposition of the SOM1 and SOM2 pools is mainly driven by the turnover of SMB1. Mi-crobes selectively degrade the less recalcitrant compounds. Thus, a gradually increase in aver-age recalcitrance of the non-respired C results in, that some fraction of SOM2 enters SOM1. Furthermore, the SMB2 receive C input of death microbes from SMB1 and also from its own population for further decomposition, Figure 1.
2.2.1
Kinetics of C flow
The turnover rates are considered as 1-order kinetics. For substrate in pool X the turnover rate is given as (Hansen et al., 1990):
eq. 2-9
C x
C
k
=
ζ
ζx : Turnover rate of pool X [kg C m-3 hour-1]. kx : Turnover rate coefficient for pool X [hour-1].
Cc : Carbon concentration [kg C m-3].
The soil microbial biomass is dependent on substrate availability. When substrate is limited the microbial biomass dies. The death rates, Dx, of SMB1 and SMB2 are calculated like the turnover
eq. 2-10
C x
x d C
D =
dx : Death rate coefficient for pool X [hour-1].
The turnover rate coefficients at standard conditions of the microbial biomass SMB1 and SMB2 are the sum of the manitenance rate coefficient and the death rate coefficient.
eq. 2-11
* * *
x x
x
d
m
k
=
+
dx* : Death rate coefficient for microbial biomass pool, X, at standard conditions [hour-1]
mx* : Maintains rate coefficient for the microbial biomass pool, X, at standard conditions [hour-1].
Hence, turnover of organic matter is partly due to the maintenance of the microbes, which de-pend on the utilisation efficiency, and the death of the microbes.
Environmental factors as temperature and soil moisture are taken into account by linking the turnover rates to functions describing effect of temperature, water content, and clay content. Hence, the extent and rate of conversion of organic P into soluble or stable inorganic forms is highly dependent upon the nature of the original organic material, as well as environmental fac-tors such as pH, temperature, and soil moisture (Pierzynski et al., 2000). Turnover rate coeffi-cients for AOM1 and AOM2 and DOM are given as:
eq. 2-12
)
(
)
(
* ψ
ψ
m T m x
x
k
F
T
F
k
=
kx*: Turnover rate coefficient at standard conditions [hour-1]
FmT(T) : Temperature function,
T : Soil temperature [˚C] Fmψ(ψ) : Pressure potential function,
ψ: Pressure potential of soil water [m water].
Additionally, the clay content is considered as a factor that protects soil organic matter from de-composition. The abiotic functions C
( )
Cm X
F , FT
( )
Tm , and F
( )
T Tm which affects the turnover rates are
defined in the next paragraphs. Standard conditions for the abiotic factors (temperature, soil wa-ter moisture, and clay content) are defined as when the respective factors return the value of 1 (Hansen et al., 1990). The turnover rate coefficients for SOM1 and SOM2 are given as:
eq. 2-13 )
( ) ( ) (
* ψ ψ
m T m C C m x
x k F X F T F
k =
Fmc(Xc) : Clay content function,
Xc : Clay content [%],
The death rate coefficient, dx, is like the turnover rate coefficient dependent of the abiotic
condi-tions. Hence, for the SMB1 pool the death rate coefficient is calculated from eq. 2-13 substitut-ing the turnover rate coefficient with the death rate coefficient. For the SMB2 pool the death rate coefficient is calculated from eq. 2-12 substituting the turnover rate coefficient with the death rate coefficient. The abiotic functions of temperature, FmT(T), pressure potential Fmψ(ψ), and clay
content Fmc(Xc) defined in Daisy (Hansen et al., 1990) are briefly reviewed in the following
2.2.2 Effect
of
temperature
It is assumed that the effect of soil temperature on decomposition rate of organic matter in-creases linearly in the temperature range 0-20˚C and exponentially at soil temperature greater than 20 °C.
eq. 2-14
( )
(
)
⎪ ⎩ ⎪ ⎨ ⎧ > + ≤ < ≤ = 20 T T 0.00193 T 0.027 -0.47 exp 20 T 0 T 1 . 0 0 T 0 T F 2 T m( )
TFT
m : Function to account for effect of soil temperature
T: Soil temperature [˚C].
The variation of the temperature factor with temperature described in from eq. 2-14 is illustrated in Figure 2.
0 1 2 3 4 5
0 5 10 15 20 25 30
Soil temperature, degrees
S o il t e m p e rat u re fact o r
Figure 2. Soil temperature factor.
2.2.3
Effect of soil moisture
Only a small fraction of the organic matter in soils is likely to be in close proximity to the micro-bial biomass. Consequently, transport processes through the liquid phase of the soil are very important for the decomposition rate of organic matter in soils. Thus, the turnover rate of organic matter is strongly related to the corresponding pressure potential of soil water, since the soil wa-ter content considerably influences transport processes in soils. It is assumed that turnover of soil organic matter approaches zero at pF = 6.5, that optimal conditions exist in the range 1.5 < pF < 2.5. Furthermore, it is assumed that the turnover rate increases linearly from 0.6 at water saturation to 1 at pF 1.5, and that the function decreases linearly from 1.0 at pF 2.5 to zero at pF 6.5. eq. 2-15
( )
⎪ ⎪ ⎪ ⎩ ⎪⎪ ⎪ ⎨ ⎧ > ≥ > − ≥ > ≥ > + ≥ = ) (10 0 ) -(10 ) (10 )/4.0 -100 log( 0 . 1 ) -(10 ) (10 .0 1 ) -(10 ) (10 )/1.5 log(-100 4 . 0 6 . 0 ) -(10 6 . 0 F 4.5 4.5 -0.5 0.5 0.5 -0.5 -2 --2 m ψ ψ ψ ψ ψ ψ ψ ψ ψ( )
TFmT : Function to account for the effect of soil water content.
The variation of the pressure potential factor with pressure potential described in eq. 2-15 is il-lustrated in Figure 3.
0 0.2 0.4 0.6 0.8 1 1.2
0 2 4 6 8 1
Pressure potential, pF
P
re
ssu
re
p
o
te
n
ti
al
fact
o
r
0
Figure 3. Pressure potential factor.
2.2.4
Effect of clay content
The protection of organic matter against decomposition or decay varies with the degree of ag-gregation or clay content of the soil. The function applied to account for the effect of clay con-tent of the soil on the rate of decomposition or decay of organic matter is given as:
eq. 2-16
( )
⎩ ⎨ ⎧
> −
≤ < =
X X X
a 0 . 1
X X 0 X
a -1.0 X
F '
C C '
C
' C C C
C C m
(
C C m XF
)
: Function accounting for the effect of clay content. a : Constant (a = 2).XC : Clay content [kg kg-1]. '
C
X : Limit for effect of clay contents (0.25 kg kg-1).
The variation of the factor clay content with clay content described in eq. 2-16 is illustrated in Figure 4.
0 0.2 0.4 0.6 0.8 1 1.2
0 0.1 0.2 0.3
Clay content, kg / kg.
C
lay
co
n
te
n
t
fa
ct
o
r
Figure 4. Clay content factor.
2.2.5 Immobilisation
and
mineralization of inorganic N and P
If the C/N- and C/P-ratios in the substrate are insufficient for decomposition it is tested whether or not there is available dissolved inorganic P and N in the bulk soil. If available N and P exist the microbial biomass is supplied with inorganic N and P by a first order reaction at a rate, which is related to diffusion and is proportional to the concentration of NH4-N, NO3-N and PO4-P,
biomass can be supplied with N and P from the inorganic pools, at a rate which is proportional to the concentration of NH4+-N, NO3—N (Hansen et al., 1990), and PO43--P in the soil solution,
respectively: eq. 2-17 N NH im N NH im N
NH4− =k 4− N 4−
ξ
eq. 2-18 N NO im N NO im NNO3− =k 3− N 3−
ξ
eq. 2-19 P PO im P PO im PPO4− =k 4− P 4−
ξ
im N NH4
k − , im , : Immobilization rate coefficient for NH
N NO3
k − im
P PO4
k − 4-N, NO3-N, and PO4-P [hour-1].
N NH4
N − , NO N, : Amount of dissolved NH 3
N −− PO P
4
P − 4-N, NO3-N, and PO4-P in soil [kg m-3].
im N NH4−
ξ , im , : Rate by which dissolved NH
N NO3−
ξ im
P PO4−
ξ 4-N, NO3-N, PO4-P and can be utilized by the
micro-bial biomass [kg m-3 hour-1].
If sufficient mineral nitrogen is present in the soil, it is assumed that NH4+-N is utilized in
prefer-ence to NO3--N. If the decomposition is limited due to lack of inorganic nutrients, the death rates
and the decay rates of the organic fractions will be reduced until the nutrient demands are in correlation with the decay rates (Hansen et al., 1990).
Net mineralization of N and P, i.e. transformation of organic nitrogen to NH4 and organic P to
PO4 is a result of two opposite processes, mineralization, and immobilization. Net mineralization
is a function of:
• Substrate availability for the soil microbial biomass.
• The difference between growth rate and death rate of soil microbial biomass.
• The efficiency by which soil microbial biomass utilizes dissolved organic matter as substrate. • The C/N- and C/P-ratio in the various fractions of organic matter being decomposed.
• The C/N- and C/P-ratio in the microbial biomass are being synthesized.
Thus the rate of N and P net mineralization are overall results of transformation processes given by eq. 2-1-eq. 2-7 and the C/N- and C/P-ratios of the organic matter fractions in the soil. The net mineralization of P,
ξ
m.P, is given by:eq. 2-20 DOM DOM SMB2 SMB2 SMB1 SMB1 SOM2 SOM2 SOM1 SOM1 AOM2 AOM2 AOM1 AOM1 m.P
P
C
dt
dC
P
C
dt
dC
P
C
dt
dC
P
C
dt
dC
P
C
dt
dC
P
C
dt
dC
P
C
dt
dC
⎥⎦
⎤
⎢⎣
⎡
−
⎥⎦
⎤
⎢⎣
⎡
−
⎥⎦
⎤
⎢⎣
⎡
−
⎥⎦
⎤
⎢⎣
⎡
−
⎥⎦
⎤
⎢⎣
⎡
−
⎥⎦
⎤
⎢⎣
⎡
−
⎥⎦
⎤
⎢⎣
⎡
−
=
ξ
If the net mineralization rates of N or P are negative, net immobilization occurs of N or P. When immobilization occurs, the upper limit for the immobilization rate is determined by the availability of inorganic N and P.
3
SORPTION OF DISSOLVED ORGANIC MATTER
The bulk of the organic matter in most soils is bound to clay minerals, probably through linkages with Fe, Al, and other polyvalent cations (Stevenson, 1994). Evidence from studies in soil sys-tems indicates that sorptive protection of DOM may be of particular importance; hence, accord-ing to several authors (e.g McDowell and Wood, 1984; Guggenberger and Zech, 1992; Kaiser et al., 1996; Qualls and Haines, 1992) the change in quantity of DOM during passage through the mineral soil is caused by sorption of DOM on to the soil mineral phase. A first indication of the importance of sorptive protection in soils is the frequently reported positive relationship be-tween organic C content and the clay content (e.g. Burke et al., 1989; Hassink, 1997). Sec-ondly, fluxes of DOC generally decrease from litter layer to deeper mineral horizons and in vir-tually every soil with substantial clay content, DOC concentrations drops by 50 % - 90 % from the surface organic layers to subsurface minerals soils (Neff and Asner, 2001).
Because sorption is defined as the transfer of a solute (the sorbate) from solution to an existing solid phase (the sorbent), a prerequisite for the sorptive stabilisation of soil organic matter is that, it must occur in a dissolved state prior to sorption or precipitation (Guggenberger and Kai-ser, 2003). Bonding mechanisms differ depending on the nature of the sorbate and sorbent. Clay, including layer- and amorphous aluminiumsilicates, and the so called sesquioxides (ox-ides, hydrox(ox-ides, and oxyhydroxides of Al and Fe), provide the vast majority of sorbent surface area in soil (Sollins et al., 1996). Clay surfaces can be divided into two fundamentally distinct types (Borggaard, 1998) namely variable charged surfaces and permanent charged surfaces. On hydroxylated surfaces, net surface charge varies, becoming increasingly negative as pH in-creases. Such variable-charge surfaces occur on kaolinite, sesquioxides, and amorphous alu-minosilicates. Permanent charge arises from substitution of ions of lower valence for ones of higher valence within the crystal structure of clays. The resulting negative charge is a perma-nent feature of the clay and is largely unaffected by pH. Permaperma-nently charged surfaces occur on smectite, illite, and other layer silicate clays (Sollins et al., 1996).
Sorption of negatively charged organic groups (e.g., dissociated carboxylic acid groups) can oc-cur through replacement of surface hydroxyl groups (ligand exchange) (Parfitt, 1978). Since sur-face hydroxyl groups are restricted to variable charge sursur-faces, sorption of negatively charged organics by ligand exchange should be most important in oxide-rich and allophanic soils. Sorp-tion of organic anions by electrostatic interacSorp-tions (anion exchange) would require positive sur-face charge (Sollins et al., 1988); however, cation bridging should also be possible in the pres-ence of polyvalent metal ions such as Ca2+, Al3+, Fe2+/3+ (Stevenson, 1994). Other bonding
mechanisms involved in sorption of organic substances include water bridging, hydrogen bond-ing, and van der Walls forces. In addition, (Jardine et al., 1989) concluded that due to the diver-sity of soil sorbents and sorbates, several mechanisms involved in sorption of humic substances will likely be involved simultaneously.
3.1
Sorbed phase of DOM
Much evidence suggests that clay somehow stabilizes SOM. Hence, correlations between clay content and accumulation of microbial biomass derived from 14C-glucose (Amato and Ladd,
(Guggenber-ger and Kaiser, 2003). It has been hypothesized that a pool of potential DOM exists as a part of soil organic matter “that is not in solution but is part of the soil solids and able to pass into the solution under realistic conditions” (Tipping, 1998 cf. Kalbitz et al., 2000). Hence, according to this hypothesis some part of SOM has potential to release DOM and to ‘remove’ or sorb DOM from solution.
It is often found that soil is able to release DOM when exposed to aqueous solution containing no or very low concentrations of DOM (Kaiser, 2001). Thus, the soil solid phase may not only sorb DOM but may also release it depending on solution DOM concentrations. The quantitative importance of sorption of DOM in stabilization and accumulation of SOM could be related to the amount of organic matter associated to clay minerals and sesquioxides, as they provide the vast majority of sorbent surface area in soil. Extraction of DOM from soil bulk samples using a che-lating reagent which had a high affinity for polyvalent cations, released approximately 50 % of the organic matter in the soil to the solution phase (Gjettermann et al., 2005). This fraction of extracted DOM is released by removing polyvalent cations as Fe3+, Al3+ from SOM. This could
indicate that approximately half of the SOM was associated to polyvalent cations and could be a potential pool of DOM able to pass into the solution if released. These findings are in accor-dance with Greenland (1971) who observed that 52-98 % of the C in soil examined was associ-ated to clay minerals.
In the P-Model it is considered, that DOM is rather old, assuming that easily degradable new components are rapidly consumed by microbes and can not be distinguished fro the AOM pools. Hence, DOM is mainly produced from SOM by some physical/chemical/biological proc-esses resulting in that some part of SOM in soil is dissolved. Based on the above mentioned observations of DOM extraction and amount of SOM associated to minerals, it is assumed that the relative bioavailable fraction of SOM, the SOM2 pool, has potential for releasing DOM to or removing DOM from solution. Only the SOM2 pool contributes to the sorptive preserva-tion/destruction of organic substances, as SOM2 is the most bioavailable and less stabilised fraction of SOM. Additionally, the quantity of SOM2 approximates to be 1/3 of total SOM.
The biological processes of mobilizing DOM from SOM and vice versa was described in the previous paragraph. The physical/chemical process is described in this paragraph, release a fraction of solid SOM as DOM during desorption and removing DOM from solution to solid SOM by sorption.
3.2
DOM sorption at equilibrium
Desorption and sorption of DOC has been described by an approach called the Initial Mass iso-therm. It is developed and described by Nodvin et al. (1986) for a number of anions and DOC. The Initial Mass (IM) isotherm is a simple partitioning model that additionally accounts for the substance initially present within the soil. In several studies IM isotherms have been able to de-scribe the amount of DOC, removed or released to the solution by the soil, as a linear function of the initial amount of DOC added to the soil-water system (Moore et al., 1992; Vance and David, 1992; Guggenberger and Zech, 1992). It has also been able to describe the exchange of DOP (Kaiser, 2001) and DON (Kaiser and Zech, 2000) using the IM isotherm.
3.2.1
The Initial Mass isotherm
In the IM isotherm the amount of substance sorbed or released (normalized to soil mass) is termed RE. Negative values of RE indicate a net release to the solution and a positive value in-dicate a net removal of substance from the solution. It is not a measure of total sorbed sub-stances, for additional substance may have been present within the soil at the outset of an equilibration experiment. A linear function is obtained when plotting the amount of solute (nor-malized to soil mass) removed from or released to the soil solution as a function of initial amount of solutes (normalized to soil mass) added to the soil:water system (Nodvin et al., 1986). When RE is plotted as a function of the initial amount of that substance Xi (normalized to
soil mass) the release or removal, RE, of DOC or DOP is given by:
eq. 3-1
b mX
RE = i −
RE: Amount released or removed from solution after 24 hours [g kg-1]
Xi: Initial amount of solute added [g kg-1]
m: Partitioning coefficient or slope of linear regression [g g-1]
b: Intercept of linear regression [g kg-1]
The slope of the linear function, m, is related to the partitioning coefficient and is a measure of the affinity of the substance to the sorbent. The numerical value of m represents the fraction of substances in the soil:water system that is associated with the soil (Nodvin et al., 1986). The intercept of the linear regression, b, represents the amount of substances released from or sorbed by the soil when a solution with no sorbate (DOM) is added. Thus, the intercept may be called a desorption term. The relationship is consistent with a simple partitioning of DOM be-tween soil and solution with m as a partitioning coefficient.
In a sorption experiment the amount of solute remaining in solution is the difference between the amount added and the amount removed or released by the soil. The plot of RE as a function of the final amount of solute, Xf, is equivalent to an IM isotherm given by eq. 3-1, in which the
abscissa has been rescaled by the variable RE. The axes RE and Xf are not independent,
be-cause both parameters are dependent upon Xi, (Xf = Xi – RE). Nodvin et al. (1986) showed that
if the IM isotherm deviates from linearity at high values of Xi by a distance d then RE is reduced
by a value d. As shown in the right figure in Figure 5, the endpoints of the curves, which corre-spond to the same point of sorption, are separated by a 45˚ vector of the length (2d2)½. Thus,
regressions using initial values should provide a better linear fit of sorption data than regression with final values, as curvature will appear enhanced in plots using final values relative to plots using initial values (Nodvin et al., 1986).
To utilize the IM isotherm, the concentrations used in sorption experiment must produce data that result in a statistically linear fit to the IM isotherm. Use of the IM isotherm will therefore be precluded above a certain solute concentration, which will vary depending on the soil, sub-stance, and experimentally conditions (Nodvin et al., 1986). In a batch sorption experiment the pH-dependent sorption of DOM to an agricultural top- and subsoil was conducted with two pH levels (pH 5 and 7). For the range of DOC concentration of 0-56 mg L-1 the IM isotherm was
able to describe the DOC sorption isotherms with correlation factors r2 >0.9 (Gjettermann et al.,
2005c). DOC concentration obtained by suction cups for the same soil as used in the sorption experiments varied between 17 and 45 mg L-1 for the topsoil and 5 and 16 mg L-1 for the subsoil
(Gjettermann et al., 2005a). This is in the range of reported DOC concentrations in agricultural soils varying from 3 and 70 mg L-1 (Zsolnay, 1996). Other batch experiments with forest soil
have used DOC concentrations up to 81 mg L-1 (Moore et al., 1992) and found good correlation
factors in fitting the IM isotherm.
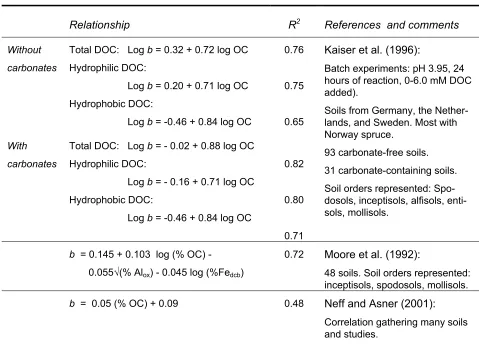
[image:23.595.78.557.405.750.2]A number of sorption studies of DOC sorption have indicated that extractable Fe and Al, organic C content, and mineralogy are important controls on the ability of soils to sorb DOC, (McDowell and Wood, 1984; Moore, 1989). Moore et al. (1992), Kaiser et al. (1996), and Neff and Asner (2001) have attempted to estimate correlations between soil properties and parameters of the IM isotherm to describe DOC sorption in general terms for different soils. Table 1and Table 2 lists the pedotransfer functions estimated in a number of studies, correlating the desorption pa-rameter, b, and the partitioning parameter, m, respectively to soil properties.
Table 1. Pedotransfer functions estimating the desorption parameter, b, across a range of soil types (modified from Neff and Asner (2001)).
Relationship R2 References and comments
Without carbonates
Total DOC: Log b = 0.32 + 0.72 log OC Hydrophilic DOC:
Log b = 0.20 + 0.71 log OC
Hydrophobic DOC:
Log b = -0.46 + 0.84 log OC
0.76
0.75
0.65
With carbonates
Total DOC: Log b = - 0.02 + 0.88 log OC Hydrophilic DOC:
Log b = - 0.16 + 0.71 log OC
Hydrophobic DOC:
Log b = -0.46 + 0.84 log OC
0.82
0.80
0.71
Kaiser et al. (1996):
Batch experiments: pH 3.95, 24 hours of reaction, 0-6.0 mM DOC added).
Soils from Germany, the Nether-lands, and Sweden. Most with Norway spruce.
93 carbonate-free soils. 31 carbonate-containing soils. Soil orders represented: Spo-dosols, inceptisols, alfisols, enti-sols, mollisols.
b = 0.145 + 0.103 log (% OC) - 0.055√(% Alox) - 0.045 log (%Fedcb)
0.72 Moore et al. (1992):
48 soils. Soil orders represented: inceptisols, spodosols, mollisols.
b = 0.05 (% OC) + 0.09 0.48 Neff and Asner (2001):
Correlation gathering many soils and studies.
OC: Organic C, Alox: oxalate extractable Al, Fedcb: dithionite-citrate-bicarbonate extractable Fe. Units in g
Generally, positive correlations were obtained between the intercept b and the organic C con-tent, Table 1. Contrary to the partitioning coefficient, a negative correlation was obtained be-tween b and dithionite extractable iron, Fedcb, and oxalate extractable aluminium, Alox by Moore
[image:24.595.82.561.206.574.2]et al. (1992).
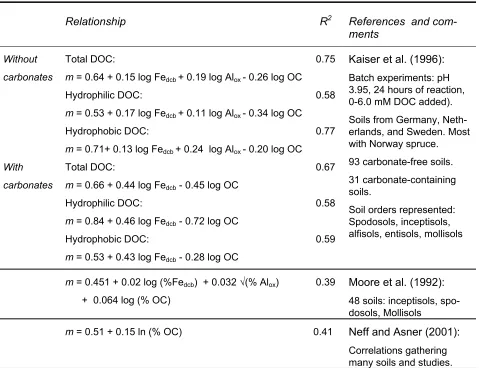
Table 2. Pedotransfer functions estimating the partitioning coefficients, m, across a range of soil types (modified from Neff and Asner (2001)).
Relationship R2 References and
com-ments
Without carbonates
Total DOC:
m = 0.64 + 0.15 log Fedcb + 0.19 log Alox - 0.26 log OC
Hydrophilic DOC:
m = 0.53 + 0.17 log Fedcb + 0.11 log Alox - 0.34 log OC
Hydrophobic DOC:
m = 0.71+ 0.13 log Fedcb + 0.24 log Alox - 0.20 log OC
0.75
0.58
0.77
With carbonates
Total DOC:
m = 0.66 + 0.44 log Fedcb - 0.45 log OC
Hydrophilic DOC:
m = 0.84 + 0.46 log Fedcb - 0.72 log OC
Hydrophobic DOC:
m = 0.53 + 0.43 log Fedcb - 0.28 log OC
0.67
0.58
0.59
Kaiser et al. (1996): Batch experiments: pH 3.95, 24 hours of reaction, 0-6.0 mM DOC added). Soils from Germany, Neth-erlands, and Sweden. Most with Norway spruce. 93 carbonate-free soils. 31 carbonate-containing soils.
Soil orders represented: Spodosols, inceptisols, alfisols, entisols, mollisols
m = 0.451 + 0.02 log (%Fedcb) + 0.032 √(% Alox)
+ 0.064 log (% OC)
0.39 Moore et al. (1992): 48 soils: inceptisols, spo-dosols, Mollisols
m = 0.51 + 0.15 ln (% OC) 0.41 Neff and Asner (2001):
Correlations gathering many soils and studies.
OC: Organic C, Alox: oxalate extractable Al, Fedcb: dithionite-citrate-bicarbonate extractable Fe. Units in g
kg-1 if not specified otherwise. m: partitioning coefficient with unit in fraction.
Additionally, positive correlations were obtained between m and dithionite extractable iron, Fedcb, and oxalate extractable aluminium, Alox, se Table 2. Neff and Asner (2001) and Kaiser et
al. (1996) obtained positive correlations for organic C content; in contrast Moore et al. (1992) found negative correlation with the partitioning coefficient.
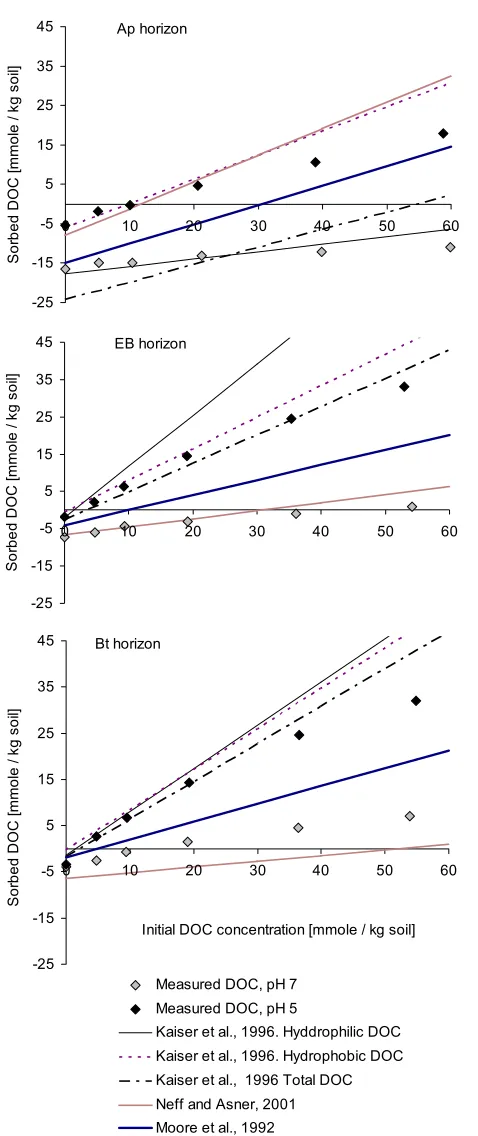
used in the sorption experiments by the pedotransfer functions listed in Tables 1 and 2, by in-serting the soil content of organic matter, Alox, and Fedcb for each horizon. Figure 6 shows the IM
isotherms from the estimated sorption parameters together with measured sorption data at two pH levels (pH 5 and pH 7) for the Ap, EB, and Bt horizons.
EB horizon
-25 -15 -5 5 15 25 35 45
0 10 20 30 40 50 6
So
rb
e
d
DO
C
[m
m
o
le
/ k
g
s
o
il]
Bt horizon
-25 -15 -5 5 15 25 35 45
0 10 20 30 40 50 6
Initial DOC concentration [mmole / kg soil]
S
o
rb
ed
DO
C
[m
m
o
le
/ k
g
s
o
il]
Measured DOC, pH 7 Measured DOC, pH 5
Kaiser et al., 1996. Hyddrophilic DOC Kaiser et al., 1996. Hydrophobic DOC Kaiser et al., 1996 Total DOC Neff and Asner, 2001 Moore et al., 1992
0 Ap horizon
-25 -15 -5 5 15 25 35 45
0 10 20 30 40 50 6
S
o
rb
ed
DO
C
[m
m
o
le
/ k
g
s
o
il]
0
[image:25.595.150.389.157.725.2]0
As shown in Figure 6 the IM isotherms estimated by the parameters from the pedotransfer func-tion by Moore et al. (1992) were in between the measured data at pH 5 and pH 7 for all hori-zons. At this stage the pH effect is not incorporated into the sorption parameters in the P-Model, as insufficient data are available linking pH effect to the sorption parameters of the IM. Hence, the best fit of the DOM sorption experiments to the soil is taken to be right in between the ob-served data at pH 5 and 7.
3.2.2 Null-point
concentration of DOC
The DOC sorption isotherm described by the IM isotherm is the amount of DOC sorbed or re-leased after 24 hours of reaction. When no DOC is removed from or release to the solution then
RE = 0. Inserting RE = 0 into eq. 3-1, the amount of DOC in solution (normalized to soil mass) at this point, DOCnp, is given by eq. 3-2.
eq. 3-2 m
b DOCnp =
DOCnp: The null-point concentration of DOC [mg g-1].
The null-point concentration of DOC at which there is no net removal or release of DOC from the solution is then given by the intercept of the x-axis on the IM isotherm. This point correspond to the change in DOC after 24 hours of reaction in the soil:water system. Figure 7 schematise the IM isotherm and the null-point concentration of DOC where there is no net removal or re-lease of DOC in the P-Model.
Figure 7. The Initial Mass isotherm.
In the P-Model the sorbed phase is considered to be a large proportion of SOM. The sorbed phase is then an infinitely large sink and source of DOM in the topsoil. In describing DOM sorp-tion by the IM isotherm the sorbed phase is not a limiting factor for DOM sorpsorp-tion or desorpsorp-tion capacity. This implies that only the DOM concentration in the soil solution determines whether sorption or desorption occurs. To avoid that the DOM sorption/desorption process description continues to only desorb DOM from SOM, emptying the SOM pool, or the opposite, it is as-sumed that the soil seeks to equilibrate the solution concentration towards the DOCnp. The
pa-rameter DOCnp is considered to be constant with time, however, changing land use markedly
might influence DOCnp. Hence, in the P-Model the DOCnp is considered to be the soil:water
sys-tems optimum DOC concentration at equilibrium, DOCeq_optimum, the soil system will approach
However, this null-point concentration which is normalised to soil mass is established at soil:water ratios of 1:10 in sorption batch experiments (Moore et al., 1992). Transferring the
DOCnp from per soil mass units to per soil solution unit is done by taking this soil:water ratio into
account. batch batch np optimum eq V m DOC
DOC _ ≈ eq. 3-3
DOCeq_optimum: Optimum concentration of DOC in solution at equilibrium [g L-1].
DOCnp: The null-point concentration of DOC [g kg-1].
mbatch: Soil mass in batch system [kg].
Vbatch: Volume of solution in batch system [L].
According to this, the IM isotherm is used to estimate a DOC concentration optimum in the soil solution, a concentration the soil system will approach with time.
3.3
The kinetic approach of DOM sorption
It is assumed that the least recalcitrant pool of soil organic matter, the SOM2 pool, has potential for release of DOM to or removal of DOM from solution. The system of dissolved phase and solid phase is then described as:
eq. 3-4 DOM SOM2 DOM -SOM2 2 1 + ≡ ⎯ ⎯⎯ ← ⎯→ ⎯ ≡ k k
SOM2: Bioavailable fraction of soil organic matter [g kg-1]. DOM: Dissolved organic matter [g L-1].
K1: First order sorption rate coefficient [hour-1].
K2: First order desorption rate coefficient [hour-1].
The exchange between the dissolved and solid phase is described by a first order reaction as it is assumed only to depend on the solute concentration. However, it couples the defined opti-mum for DOC concentration to the actual DOC concentration. The kinetics must be considered as an empirical, kinetic expression (eq. 3-4) linking the difference in concentration between wanted and actual conditions in the soil. Hence, in a very simplified view it lumps together con-siderations as diffusion and sorption kinetics into the description of the sorption/desorption proc-ess, as it is not possible at present to incorporate considerations of variable such as pore ge-ometry and particle surface availability in the model.
The ‘reaction rate coefficients’ k1 and k2 in eq. 3-4 are constants. The kinetics concept of the
P-Model describes the sorption and desorption as functions of the difference between the solute and the optimum concentration and a rate coefficient. The change of amount of sorbed DOC is given by equation, eq. 3-5.
eq. 3-5 ⎪ ⎩ ⎪ ⎨ ⎧ < ≤ − − − > − − − = 10 SOM2 , 0 0 DOC DOC , ) DOC (DOC k 0 DOC DOC , ) DOC (DOC k dt dDOC 9 -eq_optimum sol eq_optimum sol 2 eq_optimum sol eq_optimum sol 1 sol
DOCsol: Actual concentration of DOC in solution [g L-1].
k1,k2: Rate constants [hour-1].
dt
Depending on whether the DOC concentration is above or below the optimal concentration,
DOCeq_optimal, desorption or sorption is activated. However, the processes of sorption and