1
Optimization Study on the Downstream Section of a
Radial Inflow Turbine
Nazanin Ansarifard
#1, Alan Fleming
#2, Alan Henderson
*3, S.S Kianejad
#4, Shuhong Chai
#5#Australian Maritime College, University of Tasmania
*School of Engineering and ICT, University of Tasmania
Maritime way, Newnham, TAS 7248, Australia
Abstract— The Oscillating Water Column (OWC) is a form of Wave Energy Converter (WEC) plant that is employed to harness the power of ocean waves. UniWave is a vented OWC type that extracts the pneumatic power solely from negative pressure drops in the chamber. Having a different flow profile compared to the conventional OWCs, there is a need for customizing a turbine design for the typical UniWave operation. The design modification of the downstream section in a radial inflow turbine has been considered for efficiency improvements. Being the linking element between the turbine and the chamber, this section has potentials for significant impact on the turbine-chamber flow interaction. Four parameters are selected which mainly affect the shapes of the downstream guide vanes and the duct, and optimization methods are employed for efficiency maximization. Guide vane curvature, radius of the duct and use of a diffuser were shown to affect the efficiency and the downstream losses. An improved downstream section in a turbine-duct geometry can improve the turbine’s peak efficiency by 14%, due to decreasing the pressure losses at the rotor downstream.
Keywords— Downstream Guide Vanes, Duct Shape,
Unidirectional Radial Turbine, Design Improvement, Optimization, CFD Simulations, Vented Oscillating Water Column,
I. INTRODUCTION
An Oscillating water column is a form of Wave Energy Converter (WEC) device that is used to extract pneumatic power from the ocean. A turbine is employed as the Power Take-Off (PTO) unit in the system to convert the pneumatic power to mechanical power. UniWave [1] is a unidirectional type of OWC in which air valves are used to vent the air chamber during air chamber positive and divert all air flow through the turbine during negative air chamber pressure (when the air moves from atmosphere into the chamber, Fig. 1). This concept has been shown experimentally to provide equivalent or better pneumatic power conversion compared to bi-directional OWCs and has a significantly different pressure/flow comparted to conventional OWCs [1]. To enable efficient energy extraction of the UniWave, the turbine-chamber connection and its impact on the flow behaviour need to be considered.
Cost of the energy harnessing is a problematic issue in the WEC industry [2]. Careful designing of all sections of the chamber-turbine-generator package can ensure wave to wire efficiency improvements. This paper presents design improvements of the downstream section in a radial air turbine to enhance the efficiency over the inflow condition typical of the UniWave OWC operation. Using the optimization techniques in the field of OWC design and analysis is not common and there are gaps for further improvements of the turbine-chamber configuration [3]. Studies on identifying the most sensitive parameters, affecting the turbine performance, have been conducted by many researchers. The stall and starting characteristics of the Wells turbines were reported to be modified through improvements on the hub-to-tip ratio and the solidity [4]. The efficiency also was revealed to be mainly affected by the aspect ratio and tip clearance of the rotor blades [5, 6]. In case of the impulse turbines, parameters such as Reynolds number and hub-to-tip ratio [7] and guide vanes angles [8, 9] were identified to impact the turbine efficiency. A two-dimensional analysis was carried out by Pereiras, Castro [10] considering the performance reduction due to the noticeable pressure drop imposed by inner guide vanes.
2
increase. Also, optimum number of rotor blades and guide vanes were obtained by Badhurshah et al. [16] and Samad et al. [17] by employing multi fidelity analysis methods. The effect of design variables on pressure drop and shaft power were evaluated and about 11% efficiency improvement was achieved. Optimization on blade sweep angle of the wells turbine was also performed based on the surrogate modelling techniques, and the optimized sweep angle improved the rotor torque by over 28% [18]. However, there are gaps for studying the flow behaviour inside the fixed elements of the turbine and considering the turbine-chamber requirements for efficiency improvements. [image:2.595.64.269.339.605.2]The present study aims to modify the design of the downstream section in a radial unidirectional turbine configuration for the UniWave OWC concept. The investigation is conducted using CFD (ANSYS, CFX 18.0) and the computational model is validated through a comparison with the available experimental data of a bidirectional geometry case (1) in [19] . Parametric shapes of the guide vanes and duct were considered by defining four parameters. An optimal downstream geometry was obtained in a way to maximize the turbine performance through minimizing the energy losses imposed by the fixed elements at the rotor downstream.
Fig. 1 Concept of the UniWave OWC, the airflow passes through the turbine when valves are closed [1].
II. TURBINE CHARACTERISTICS
A set of mathematical formulations [19] for calculating the torque coefficient
T
C , input power coefficient CAand turbine efficiency
η
were used for validation of the turbine behaviour over a range of flow coefficientsφ
. These equations are asbelow:
(
)
{
2 2}
0 / ρ / 2
T R R R R
C =T V +U A r (1)
(2)
0
0
T
A
T C
P Q C
ω η
φ
= =
∆ (3)
/
R R
V U
φ = (4)
Where
r
R and ρ are the turbine mean radius and airdensity respectively,
A
Rdenotes turbine’s flow passage areaat
r
R. RU is the blade speed and R
V refers to mean radial velocity at
r
R.0
P
∆ is the total pressure drop between the settling chamber and the atmosphere and Q is the volumetric
flow rate. T0and
ω
are output torque and angular velocity respectively.III. GEOMETRY
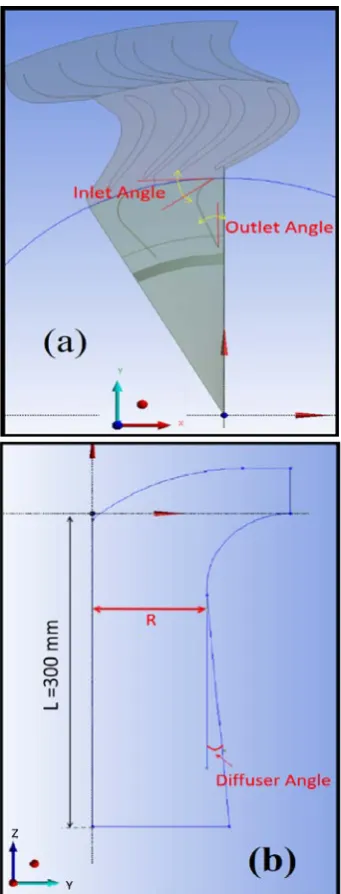
The computational domain consists of three parts: rotor upstream domain, rotor domain and rotor downstream domain. The whole geometry employed 73 guide vanes at the upstream and 51 unidirectional rotor blades. The downstream section contained two parts: DGV section at the rotor downstream, where 26 downstream guide vanes were located, and a duct which was the linking element between the PTO unit and the OWC chamber as illustrated in Fig. 2.
The parametric geometry was created in the ANSYS design modeller, in which, the shape of DGV guide vanes was controlled using two parametric angles at the inlet and outlet of the DGV row as illustrated in Fig. 3-a. In addition, the duct geometry was varied using two main parameters: radius and diffuser angle. These parameters are shown in Fig. 3-b, and are included in the optimization study due to their possible impact on the flow pattern entering the OWC chamber. TABLE 1 indicates the limits considered for each parameter in the optimization study. In addition, an initial design was used in the optimization study with the specifications shown in TABLE 1. The initial geometry was selected according to the duct geometry case (1) in [19]. The initial DGV inlet and outlet angles were raw values, specified by observation in a way to direct the airflow toward the duct centre.
(
)
{
2 2}
0 / / 2
A R R R R
3
Fig. 2 Schematic of the domain which is an angular section of the wholeturbine-duct geometry.
[image:3.595.54.280.57.498.2]
Fig. 3 Parameters used as the design variables in the DGV section (a) and the duct geometry (b).
TABLE 1 Design variables with upper and lower limits.
Design variables Lower bound Upper bound Initial Geometry
Optimized Geometry
DGV Inlet Angle 10 90 20 85.31
DGV Outlet Angle 0 20 20 4.22
Duct Radius 80 mm 120 mm 107 mm* 117.67 mm
Diffuser Angle 0 10 0* 7.10
[image:3.595.74.526.588.670.2]4
IV. NUMERICAL SIMULATIONS
The airflow in all simulations was considered steady and inward (moving from atmosphere to the chamber) to evaluate the performance of the unidirectional turbine customized for UniWave. This assumption is justified considering the ratio of turbine’s rotating frequency regarding the period of the wave cycle in the OWC chamber [20]. The low frequency of the wave cycle compared to the turbine frequency allows their interaction to be negligible and the assumption of quasi-steady airflow becomes justifiable [21]. The turbo mode tool in ANSYS CFX was used to setup the problem. The frozen rotor approach was employed for the simulations in which the rotor blades are frozen but a rotation reference frame assumption is used. The rotor blade domain was assumed to rotate at a constant speed of 120 rad/s. Air was selected as the fluid with no heat transfer, also boundary conditions of uniform total pressure at the inlet and uniform static pressure at the outlet were considered. A range of total pressure values were set at the inlet, giving a range of non-dimensional flow coefficients from
φ
= 0 toφ
=2.5. The flow was considered incompressible and the K-Epsilon turbulence model was selected. This turbulence model was utilized in many similar studies performed in this field and the accuracy of results were acceptable [22, 23] . In order to reduce the time of simulations and CPU usage, an angular section of the geometry was used instead of the whole geometry. Periodic boundaries were set on the sides of each domain when the passage and alignments are 6/73 for the upstream and 4/51 and 4/52 for rotor and downstream domains respectively. The interfaces of upstream/rotor and rotor/downstream also were considered as frozen rotor and the pitch angle ratio of each domain was considered close to one. Rotor hub was set as no slip wall, while, the rotor shroud was set as counter rotating by default. The default solver control option of high resolution and the turbulence numeric option of the first order were kept unchanged, however, the stopping criteria was set on maximum step of 1000 iterations and the residual target of 10-6 was set.
Since the simulations were conducted under the steady state, this number of steps was sufficient to meet the convergence requirements.
V. MESH GENERATION AND GRID INDEPENDENCY
STUDY
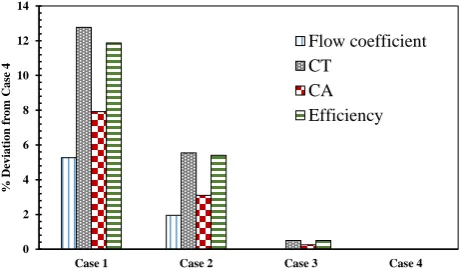
The mesh was created using ANSYS meshing. The minimum and maximum element sizes (growth rate) were controlled by selecting the proximity and curvature size function, in which, the curvature and proximity functions were utilized to control the number of cells in angles and in geometrical gaps, respectively. Inflation layers were employed in areas with more sensitivity such as near the rotor blades and elbow walls. Twenty layers of cells with growth rate of 1.2 and a transition ratio of 0.5 were applied near the walls. The minimum size and proximity were varied to study the mesh independency, creating four cases with 0.45, 0.7, 1.7 and 5
million tetrahedral mesh cells. This number of cells refers to meshing of an angular section, approximately 1/13th of the whole domain. Fig. 4 illustrates the percentages of deviation from the case 4 with the maximum number of cells (5 millions), where Case 1 denotes the minimum number of cells (0.45 millions). It is obvious that Case 1 obtained the least accurate results in comparison to other cases with over 12% deviation for
T
[image:4.595.320.551.258.393.2]C . Case 2 provides the maximum deviation of about 6% and the discrepancies of results for Case 3 is practically nil. Therefore, Case 3 with total number of 1.7 million cells was used for the CFD simulations in order to save the time and CPU usage. A schematic of the mesh used in the simulations is illustrated in Fig. 5. It should be noted that the mesh setting is kept constant while the cell number varies by changing the parametric geometry.
Fig. 4 Grid independency studies, comparing the deviation from Case 4 (maximum cell number).
Fig. 5 schematic of the mesh used in the duct section in the numerical simulations..
0 2 4 6 8 10 12 14
Case 1 Case 2 Case 3 Case 4
%
D
evi
at
ion
f
rom
C
as
e 4
Flow coefficient CT
[image:4.595.329.530.444.676.2]5
A. Numerical validationA bidirectional radial turbine-duct geometry was used to validate the numerical model as the experimental data characteristics of this turbine geometry was available and published (case 1 in Ref. [19]). Then the validated CFD method was used to predict the characteristics of the unidirectional turbine geometry used in this study. The obtained numerical results of the bidirectional turbine including torque coefficient, input power coefficient and efficiency were compared with the experimental and numerical results from Ref. [19, 23] as shown in Fig. 6-a to c. According to Fig. 6, the current results are accurately matched with the existing numerical data over the whole range of flow coefficients. A good agreement is observed between the CFD results and the experimental data. Results of the current study are close to the experimental measurements at lower flow rates and at the peak efficiency point, however, some discrepancies were observed at higher flow rates, which can be due to several factors such as surface roughness which can have less effect on the numerical simulations. In addition, the experimental results were reported to have ±1% uncertainty.
[image:5.595.324.539.54.187.2]
Fig. 6 Comparing the accuracy of the CFD results of the bidirectional geometry from the current study versus the published experimental [19] and
numerical results [23]; (a) CT , (b) CAand (c) η.
VI. RESULTS AND DISCUSSIONS
The criterial for finding the optimum design was based on maximization of the turbine efficiency as defined in equation (3). A range of inlet pressure was used in the creation of the design space, equivalent to a range of flow coefficients from 0.25 to 1 which contains the peak efficiency point of this typical turbine. Other output parameters studied were the downstream loss coefficient and turbine damping to consider the DGVs and duct impacts on the energy losses and the turbine-chamber matching. In the optimization procedure, these parameters were set as the secondary criteria compared to the efficiency, and were defined as below.
Damping
0
/
Q P
= ∆ (5)
Downstream loss coefficient 2
/ (1/ 2 )
d d
P ρV
= ∆ (6)
Where d
V denotes the velocity at the duct inlet and ∆Pd refers to the total pressure drop inside the duct only. These values were calculated using area average velocity and area average total pressure functions at the duct inlet.
The DOE method in ANSYS was employed to create a design space and the response surface was used to investigate the design variables effects on the output parameters and to predict the output behaviour through the design points. The multi-objective genetic algorithm (MOGA) was used as the optimizer to find the design with maximum efficiency. The optimization study was considered over the small flow coefficients because the design point (peak efficiency) of this type turbine is located in that range.
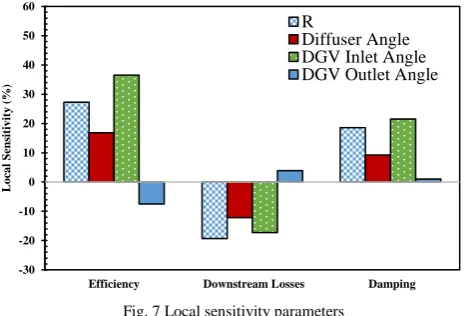
A. Parameters sensitivity
The rate of changes applied to each design variable and their impact on the turbine efficiency, downstream losses and the turbine damping are referred as the parameters sensitivity. As shown in Fig. 7, the efficiency is mostly sensitive to the DGV inlet angle and duct radius parameters, with near 40% and 30% efficiency variations caused by these parameters respectively.
0 1 2 3 4 5 6 7 8 9 10
0 0.5 1 1.5 2 2.5 3
T o rq u e C o ef fi ci en t ( CT )
Flow coefficient (ϕ)
(a) Experimental (+) Experimental (-) Existing Numerical Current study 0 2 4 6 8 10 12 14 16 18
0 0.5 1 1.5 2 2.5
Input C o ef fi ci ent ( CA )
Flow coefficient (ϕ)
(b) Experimental (+) Experimental (-) Existing Numerical Current study 0 0.05 0.1 0.15 0.2 0.25 0.3 0.35 0.4 0.45
0 0.5 1 1.5 2 2.5
E ff ici en cy ( η )
Flow coefficient (ϕ)
(c)
6
They also affect the damping positively, where the damping has increased by about 20% with changes applied to these design variables. It is clearly seen that increased duct radius, DGV inlet angle and the diffuser angle can lead to a reduction of 10% to 20% of the losses at the downstream section. However, increase of the DGV outlet angle produces more downstream losses and affects the efficiency negatively, due to affecting the DGV shape and direction of the flow velocity at the elbow section. The effects of these input parameters on the output parameters have been described in more details in the following sections.Fig. 7 Local sensitivity parameters
The response surface of efficiency is shown as a function of the DGV-parameters in Fig. 8-a, and as a function of duct-parameters in Fig. 8-b. It is shown that the parameter bounds are selected properly as the most efficient design is clearly distinct in both response surfaces. The optimum efficiency was obtained near higher DGV inlet angles and lower DGV outlet angles. The optimum efficiency is captured near the upper bound of the duct radius and a diffuser angle of 7 degrees.
Fig. 8 Efficiency surface plot against (a): DGV parameters and (b): Duct parameters.
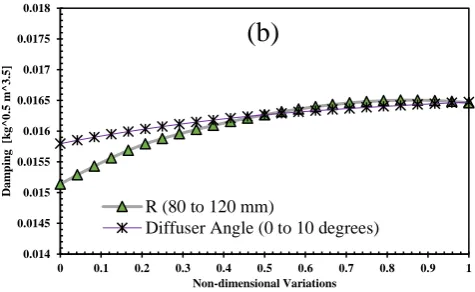
The effect of the DGV and duct parameters on the downstream losses and damping were analysed as shown in
Fig. 9 and Fig. 10 respectively. A non-dimensional variation range for each parameter has been considered where zero denotes the lower bound and one refers to the upper bound. According to the plot shown in Fig. 9-a, higher DGV-inlet-angles lead to fewer losses at the turbine downstream, while increasing the outlet angle gradually increases the losses at the downstream section of the turbine. As can be seen in Fig. 3, the downstream guide vane consist of two segments: a curve and a line. Increasing the inlet angle decreases the curvature at the upper segment of the DGV, while higher outlet angle intensifies this curvature due to the total length and the specified tangent constraints between the two segments. Therefore, parameter variations leading to more curvature of the DGV are likely to cause more downstream losses at maximum efficiency points due to intensifying the swirl component of the flow at the rotor exit.
As shown in Fig. 9-b, the duct radius is a parameter with clear need of optimizing. A small radius value leading to a smaller duct section causes more pressure losses in the elbow, while higher radius can also be detrimental probably by causing flow detachment near the walls, separation and inverse flow inside the duct. The diffuser angle, also, can significantly reduce the losses inside the duct as it contributes to reduced dynamic pressure at the duct exit.
According to Fig. 10-a, turbine damping is positively affected by the inlet angle of the DGV, where it peaks at close to the upper bound of this parameter. On the other hand, the outlet angle is less effective, where the turbine damping has not experienced any changes by varying this parameter. This figure reveals that the inlet guide vane angle can affect the flow behaviour just at the rotor exit and the flow-pressure
-30 -20 -10 0 10 20 30 40 50 60
Efficiency Downstream Losses Damping
L
oc
al
S
en
si
ti
vi
ty (
%
)
R
Diffuser Angle DGV Inlet Angle DGV Outlet Angle
[image:6.595.49.284.195.353.2]7
relationship in the system. As can be seen in Fig. 10-b, the duct radius variations in the first half-range has more impact on the turbine damping, and the damping value is approximately unchanged over the second half-range. It can be explained by the fact that smaller duct radius values can affect pressure losses and cause flow congestion at the duct entrance. The curve of diffuser angle variations shows that use of a diffuser in the duct exit has minor effects on the damping. [image:7.595.54.282.176.478.2]Fig. 9 Effects of design variables on the downstream loss coefficient
Fig. 10 Effects of design variables on the turbine damping
B. Optimized and initial designs
[image:7.595.313.557.337.521.2]The optimized design obtained in this study and the initial design are illustrated in Fig. 11. It can be seen that the DGVs in the optimum design have lower curvatures compared to the initial DGVs. In addition, the duct radius is obviously larger than the initial geometry leading to easier transmission of the airflow at the downstream section, and has a wider outlet to diffuse the flow with lower velocity.
Fig. 11 Schematic of the optimum design and the initial design.
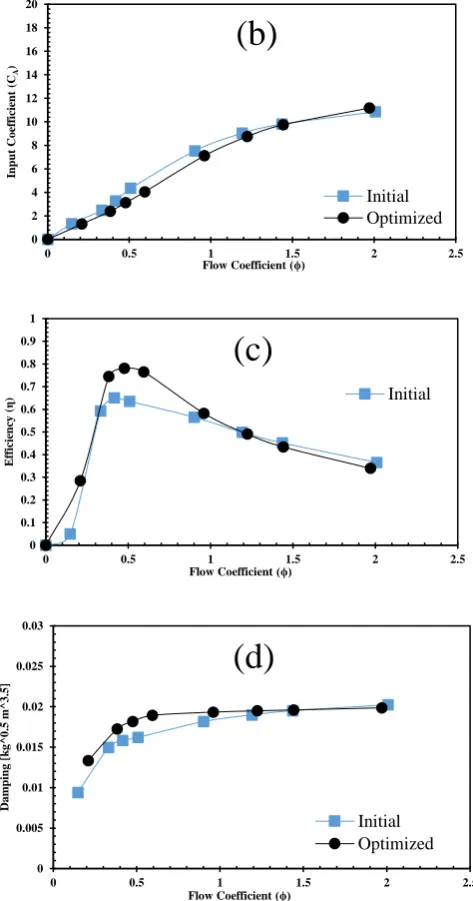
Turbine characteristics in both configurations are shown in Fig. 12. It can be seen that the torque coefficient curve (Fig. 12-a) is the same for both geometries, this is because the optimization study was concentrated on the downstream section and the same rotor section was used in both initial and optimum geometries. Considering the input power coefficient plot in Fig. 12-b, it is observed that the plot of the optimized geometry is lower than the initial geometry for flow coefficients smaller than
φ
= 1.25. This means that theoptimized geometry has a more efficient use of the input power in generating torque. This difference in
C
A plots of bothgeometries can be explained by lower losses of the total pressure in the fixed elements particularly the downstream
1 1.2 1.4 1.6 1.8 2 2.2 2.4 2.6 2.8
0 0.1 0.2 0.3 0.4 0.5 0.6 0.7 0.8 0.9 1
D o w n st re a m L o sse s Non-dimensional Variations
(a)
DGV Outlet Angle (0 to 20 degrees) DGV Inlet Angle (10 to 90 degrees)
1 1.2 1.4 1.6 1.8 2 2.2 2.4 2.6 2.8
0 0.1 0.2 0.3 0.4 0.5 0.6 0.7 0.8 0.9 1
D o w n st re a m L o sse s Non-dimensional Variations
(b)
R (80 to 120 mm)
Diffuser Angle (0 to 10 degrees)
0.014 0.0145 0.015 0.0155 0.016 0.0165 0.017 0.0175 0.018
0 0.1 0.2 0.3 0.4 0.5 0.6 0.7 0.8 0.9 1
D am p in g [k g^ 0. 5 m ^ 3. 5] Non-dimensional Variations
(a)
DGV Outlet Angle (0 to 20… DGV Inlet Angle (10 to 90…
0.014 0.0145 0.015 0.0155 0.016 0.0165 0.017 0.0175 0.018
0 0.1 0.2 0.3 0.4 0.5 0.6 0.7 0.8 0.9 1
D am p in g [k g^ 0. 5 m ^ 3. 5] Non-dimensional Variations
(b)
R (80 to 120 mm)
[image:7.595.50.286.505.650.2]8
section (as shown in Fig. 13). Fig. 12-c reveals that efficiency of the optimum design peaks at near 80% atφ
=0.47, whichhas about 14% higher performance compared to the initial geometry. According to the equation (3), efficiency has a direct relationship with
T
C and a reverse relationship with CA. As the
T
C plot is similar in both cases, the efficiency increment is
due to the modified A
C trend of the optimum design.
Regarding the damping plots (Fig. 12-d), it is obvious that the optimum design has more damping values than the initial design for flow coefficients smaller than
φ
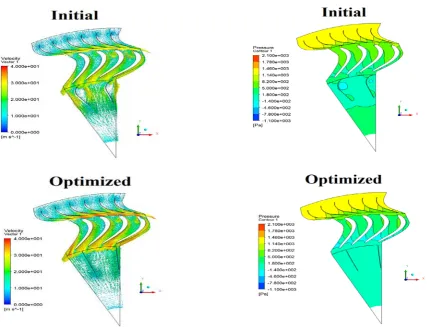
= 1.5. Thisimplies the fact that the optimized downstream section has allowed more flow rates into the turbine-duct configuration compared to the initial downstream section for a given pressure drop. Comparison of the velocity vectors of the initial and the optimized geometries in Fig. 14 indicates that the airflow velocity in the rotor section of the optimized case is higher than the initial case while the same pressure drop of 1400 Pa is provided to both cases. As the rotor area is equal in both geometries, therefore higher flow rate has passed through the optimized case. The value of damping parameter (being the ratio of turbine’s volumetric flow rate per square root of the pressure drop, as shown in equation (5)) is used to size the turbine for a proper integration with the OWC chamber [24].
Comparison of the downstream losses between the initial and the optimized geometries in Fig. 13 illustrates that the pressure losses decrease significantly when using the optimized downstream section especially at flow coefficients near the peak efficiency point. This has two main reasons considering the flow behaviour in the DGV section and in the duct section. According to Fig. 14 and Fig. 15, the optimized DGV shape is able to direct the flow into the duct properly while in case of the initial geometry there is some flow separation in the DGV curvature. The low pressure area near the DGV curvature in the initial geometry is observed in Fig. 15 which clearly shows the negative impact of the initial DGVs on the pressure at the rotor
downstream. Fig. 12 Comparison of turbine characteristics between the optimum design
and initial design, a) Torque coefficient, b) Input coefficient, c) Efficiency and d) Damping.
In addition, regarding the equation (6) the downstream losses are related to the total pressure drop and the flow velocity inside the duct. As illustrated in Fig. 16, the initial geometry allows the airflow to leave the duct at high velocities, meaning that a large amount of kinetic energy leaves the turbine unused. In contrast, the optimized duct has reduced the air velocity at the downstream section to a high extent and the diffuser has recovered the kinetic energy properly. Considering Fig. 17, it is obvious that the optimized geometry has lower total pressure at the downstream section compared to the initial geometry which again implies on the recovery of the kinetic energy and reduction of the dynamic pressure at the duct outlet in the optimized configuration. 0 1 2 3 4 5 6 7 8 9 10
0 0.5 1 1.5 2 2.5
T o rq u e C o ef fi ci en t (C T )
Flow Coefficient (ϕ)
(a)
Initial Optimized 0 2 4 6 8 10 12 14 16 18 200 0.5 1 1.5 2 2.5
Input C o ef fi ci ent (C A )
Flow Coefficient (ϕ)
(b)
Initial Optimized 0 0.1 0.2 0.3 0.4 0.5 0.6 0.7 0.8 0.9 10 0.5 1 1.5 2 2.5
E ff ici en cy ( η )
Flow Coefficient (ϕ)
(c)
Initial 0 0.005 0.01 0.015 0.02 0.025 0.030 0.5 1 1.5 2 2.5
D am p in g [k g^ 0. 5 m ^ 3. 5]
Flow Coefficient (ϕ)
(d)
[image:8.595.308.545.58.509.2]9
Fig. 13 Comparison of the downstream losses between the optimum designand the initial design.
VII. CONCLUSIONS
The downstream section of a unidirectional radial turbine configuration was investigated to improve the turbine efficiency using the optimization techniques. Four parameters considering shape of the downstream guide vanes and the duct were selected as the design variables. The inlet angle and outlet angle parameters were defined to control the curvature and direction of the parametric DGVs. It was concluded that the
inlet DGV angle can significantly affect the flow behaviour at the downstream section. The optimized guide vanes tend to act similar to flat plates with minor curvatures, by leading to lower swirls and pressure losses at the rotor downstream. In addition, proper diameter of the duct can lead to more efficiency and lower pressure losses. Use of a diffuser with a proper angle at the turbine-chamber connection can help in recovery of the kinetic energy and reduce the losses at the downstream section.
The downstream modification mainly affected the turbine pressure drop and the energy lost at the DGV and duct elements. The turbine efficiency was increased by 14% compared to the initial design, and the energy losses at the downstream section were shown to decrease significantly over the range of flow coefficients focused in this study. The turbine damping was affected by the selected parameters as the lower losses at the downstream section clearly affect the volume flow rate passing through the turbine. Damping is a key parameter regarding the turbine-chamber coupling and can be even more affected by optimizing the rotor section rather than the downstream section. Therefore, there is a gap for more research on the damping parameter and full-scale sizing using the design optimization methods.
Fig. 14 Comparison of the velocity vectors of the initial and optimized geometries at
0 =
P
[image:9.595.60.488.365.692.2]∆ 1400 Pa equivalent to a point near the peak efficiency.
Fig. 15 Comparison of the pressure contour of the initial and optimized geometries at
0 =
P
∆ 1400 Pa equivalent to a point near the peak efficiency.
0 0.5 1 1.5 2 2.5 3 3.5 4
0.15 0.33 0.42 0.51 0.90 1.19 1.44 2.01
D
o
w
n
st
re
a
m
l
o
sse
s
flow Coefficient
10
Fig. 16 Comparison of the flow velocity in the downstream section of initial and the optimized geometries at0 = P
∆ 1400 Pa equivalent to a point near the peak efficiency.
Fig. 17 Comparison of the total pressure in the downstream section of initial and the optimized geometries at
0 =
P
∆ 1400 Pa equivalent to a point near the peak efficiency.
REFERENCES
[1] Fleming, A., et al. Power performance prediction for a vented oscillating water column wave energy converter with a unidirectional air turbine power take-off. in The 12th European Wave and Tidal Energy Conference (EWTEC). 2017.
[2] Bull, D. and M.E. Ochs, Technological Cost-Reduction Pathways for Oscillating Water Column Wave Energy Converters in the Marine Hydrokinetic Environment. SAND2013-7205, 2013. [3] Das, T.K., P. Halder, and A. Samad, Optimal design of air turbines
for oscillating water column wave energy systems: A review. The International Journal of Ocean and Climate Systems, 2017. 8(1): p. 37-49.
[4] Raghunathan, S., The Wells air turbine for wave energy conversion. Progress in Aerospace Sciences, 1995. 31(4): p. 335-386.
[5] Inoue, M., et al., SIMULATION OF STARTING CHARACTERISTICS OF THE WELLS TURBINE. Unknown Journal, 1986.
[6] Raghunathan, S. and C. Tan, Performance of the Wells turbine at starting. Journal of Energy, 1982. 6(6): p. 430-431.
[7] Setoguchi, T., et al., Study of an impulse turbine for wave power conversion: effects of Reynolds number and hub-to-tip ratio on performance. Journal of Offshore Mechanics and Arctic Engineering, 2004. 126(2): p. 137-140.
[8] Maeda, H., et al., Performance of an impulse turbine with fixed guide vanes for wave power conversion. Renewable Energy, 1999. 17(4): p. 533-547.
[9] Setoguchi, T., et al., A review of impulse turbines for wave energy conversion. Renewable energy, 2001. 23(2): p. 261-292.
[10] Pereiras, B., et al., Tip Clearance Effect on the Flow Pattern of a Radial Impulse Turbine for Wave Energy Conversion. Journal of Turbomachinery, 2011. 133(4): p. 041019.
[11] Mohamed, M., et al., Multi-objective optimization of the airfoil shape of Wells turbine used for wave energy conversion. Energy, 2011. 36(1): p. 438-446.
[12] Mohamed, M.H. and S. Shaaban, Numerical optimization of axial
turbine with self‐pitch‐controlled blades used for wave energy
conversion. International Journal of Energy Research, 2014. 38(5): p. 592-601.
[13] Raghunathan, S., T. Setoguchi, and K. Kaneko. Aerodynamics of monoplane Wells turbine-a review. in The First International Offshore and Polar Engineering Conference. 1991. International Society of Offshore and Polar Engineers.
[14] Raghunathan, S. and C. Tan, Effect of blade profile on the performance of the Wells self-rectifying air turbine. International journal of heat and fluid flow, 1985. 6(1): p. 17-22.
[15] Gomes, R., et al., Multi-point aerodynamic optimization of the rotor blade sections of an axial-flow impulse air turbine for wave energy conversion. Energy, 2012. 45(1): p. 570-580.
[16] Badhurshah, R. and A. Samad, Multiple surrogate based optimization of a bidirectional impulse turbine for wave energy conversion. Renewable Energy, 2015. 74(Supplement C): p. 749-760.
[17] Samad, A., et al., Multiple surrogate modeling for axial compressor blade shape optimization. Journal of Propulsion and Power, 2008. 24(2): p. 302-310.
[18] Halder, P., S.H. Rhee, and A. Samad, Numerical optimization of Wells turbine for wave energy extraction. International Journal of Naval Architecture and Ocean Engineering, 2017. 9(1): p. 11-24. [19] Setoguchi, T., et al., A performance study of a radial turbine for
wave energy conversion. Proceedings of the Institution of Mechanical Engineers, Part A: Journal of Power and Energy, 2002. 216(1): p. 15-22.
11
[21] Cui, Y. and B.-S. Hyun, Numerical study on Wells turbine withpenetrating blade tip treatments for wave energy conversion. International Journal of Naval Architecture and Ocean Engineering, 2016. 8(5): p. 456-465.
[22] Pereiras, B., et al., An improved radial impulse turbine for OWC. Renewable Energy, 2011. 36(5): p. 1477-1484.
[23] El Marjani, A., et al., Numerical modelling in wave energy conversion systems. Energy, 2008. 33(8): p. 1246-1253.
![Fig. 1 Concept of the UniWave OWC, the airflow passes through the turbine when valves are closed [1]](https://thumb-us.123doks.com/thumbv2/123dok_us/8399832.325396/2.595.64.269.339.605/fig-concept-uniwave-airflow-passes-turbine-valves-closed.webp)
![Fig. 6 Comparing the accuracy of the CFD results of the bidirectional geometry from the current study versus the published experimental [19] and](https://thumb-us.123doks.com/thumbv2/123dok_us/8399832.325396/5.595.324.539.54.187/comparing-accuracy-results-bidirectional-geometry-current-published-experimental.webp)