EUROPEAN ECONOMIC COMMUNITY
COMMISSION
ECONOMIC DEVELOPMENT PROSPECTS
IN THE EEC FROM 1960 TO 1970
EUROPEAN ECONOMIC COMMUNITY
COMMISSION
ECONOMIC DEVELOPMENT PROSPECTS
IN THE EEC FROM 1960 TO 1970
Report by a working party
CONTENTS
Page
Foreword by the European Economic Commission . . . 5
Introduction . . . 11
Part One: Economic significance of the projections . . . 13
I. The general trends in expansion . . . . . . 15
II. The breakdown of the overall projections . . . 17
III. Economic projections for the Community . . . 18
Part Two: Economic growth in the EEC from 1960 to 1970: results of the projections. . . 21
Section I. Overall national economic projections . . . 22
Section II. The overall economic projections for the Community 39 Section III. Gross EEC product: projections of categories of ex-penditure . . . . . . 48
ANNEX
Table 1 - Trends of gross national product and the principal categories of expenditure in the EEC countries from 1950 to 1960 (in m. US dol. at constant prices and at prices and exchange rates of 1960) . . . 63Table 2 -Trends of gross national product and the principal categories of expenditure in the EEC countries from 1950 to 1960 (Index num-ber: 1950
=
100 (a) and 1955=
100 (b)). . . . . . 64Table 3 - Trends of principal categories of expenditure of gross national product in the EEC countries from 1950 to 1960 (Percentage of gross national product) . . . . . . 65
Table 4 - Demographic and economic projections 1960 -1970 Germany (F .R.) . . . . . . 66
Table
.?
-Demographic and economic projections 1960 -1970 Belgium . . . . . . 67Table 6 -Demographic and economic projections 1960-1970 France . . . . . . 68
[image:3.482.40.398.109.653.2] [image:3.482.39.397.147.348.2]Page
Table 8 -Demographic and economic projections 1960-1970
Netherlands . . . 70
Table 9 -Demographic and economic projections 1%0-1970 EEC... 71
Fig. 1 - Trends of gross national product in the EEC countries (1950 -1970) . . . . . . 72
Fig. 2 - Trends of gross national product and the principal categories of expenditure in the EEC countries (1955 -1970) -Germany (F.R.) . . . . . . . . . . . 73
- Belgium ... o • o o • o o o o o • o 7 4 -France ... o o • • • • o . . . 75
-Italy ... , . . . 76
- Netherlands ... o • • • • • • • • • o • • • • • • • • • • 0 o 0 . 0 0 • • 0 0 o o o • o • • o • • • 77 - EEC... 78
Fig. 3 - Trends of the share of each country in the EEC gross national product (in %) . . . . . . . . . . . . 79
Fig. 4 - Trends of gross national product and gross fixed capital for-mation from 1950 to 1970 -Germany (F .R.) . . . 80
- Belgium . . . 81
-France ...
o...
82-Italy . . . . . . . . . 83
- Netherlands . . . 84
- EEC... 85
Source of 1950-1960 statistical series. SOEC General Statistical Bulletin, Vol. 12, 1961.
[image:4.484.90.447.73.406.2]FOREWORD BY THE
EUROPEAN ECONOMIC COMMUNITY COMMISSION
1. One of the tasks assigned to the European Economic Community under
Article 2 of the Rome Treaty is that of promoting a harmonious development of economic activities and a continous and balanced expansion throughout the Community. The same Article stipulates that these aims are to be attained by progressively approximating the economic policies of Member States.
Since the Treaty came into operation, noteworthy progress has been made towards the co-ordination of economic policies, particularly monetary and
con-junctura! policies. In future the annual end-of-year comparison of economic
budgets in the Economic Policy Committee will give a more exact picture of development prospects in the Community as a whole during the ensuing year and make it easier for the Community's institutions to suggest appropriate measures for securing a balanced expansion of Member States' economies.
2. This approximation of economic policies cannot however be confined to
short-term measures, but must cover the longer term growth policies of the Common Market countries. With a view to the closer co-ordination of action lby Member States to develop their economies, the Commission has felt the need for information on long-term economic trends which would give an idea of the general conditions for the Community's economic expansion during the transi-tion period.
With this in mind the Commission instructed the working party of inde-pendent experts which at its request drew up the report published in Septem-ber 1958 on "The economic situation of the Community countries" to study the conditions for economic development during the transition period. The mem-bers of the working party, who are particularly well-known for their high quali-fications in the field of national accounting and economic forecasting, worked in close co-operation with the Commission's staff.(l)
3. The members of the working party, under the chairmanship of M. Pierre Uri, were: (1)
- M. Wilhelm Bauer, Director of the Institute of Economic Research of Land North-Rhine Westphalia, Essen,
- M. Albert Kervyn de Lettenhove, Director of the Economic Planning Bureau, Brussels,
- M. Claude Gruson, Director General of the National Institute of Statistics and Economic Studies, Paris,
- M. Salvatore Guidotti, Economic adviser to the Bank of Italy, Rome,
- M. Pieter de Wolff, Director of the Central Planning Bureau, The Hague.
The Commission wishes to thank the members of the working party for their efforts in a particularly difficult field, and for devoting so much of their time to the task alloted them.
4. The working party's preliminary findings are embodied in the attached
report, submitted to the Commission in June 1962. Part I sets out the methods of study and the programme adopted. Part II gives estimates of the Community's overall economic expansion for 1960- 1970.
The first step was to define the method to be used for making projections in a set of countries in process of integration, and to fix an order of priority for the operations. The working party intends to proceed by successive approxima-tions ; this means that the initial results may be reviewed at any time as the work advances. The working party's programme as described in Part I of the report includes four main stages:
a) Selecting working hypotheses on future trends in overall employment and general productivity; these two hypotheses combined determine the projected growth of gross national product during the period considered.
b) Breaking down the overall projections of gross national product by the main sectors of demand: private and public investment, private and public consump-tion, balance of external trade. stock changes.
c) A more detailed breakdown of the above estimates according to a few leading branches of activity: the nomenclature chosen by the working party distinguishes twelve industrial branches and five categories of services. This stage will include projections of imports and exports by main categories of goods and services.
d) The last stage of the programme will comprise a tentative breakdown of the overall estimates of inv.estment and employment by main branches of activity.
(1) M. Pasquale Saraceno, Central Director of the Institute of Industrial Reconstruction, Rome, took part in the work until the end of 1959. Dr Karl-Heinz Raabe, Ministerialrat in the Federal Ministry of Economics, Bonn, has attended the meetings since the beginning of 1962.
A Luxembourg expert, M. Bartel is collaborating in the Working Party's studies, However, in view of the importance of agriculture and steel in the Luxembourg economy, and the special problems of compiling projections in these sectors, no overall projections for the Grand Duchy have been made for the time being. The development of its economy will be taken into account during the next stage
The working party has based its studies on the 1960 figures, although in that year the conjunctural situation varied somewhat from one member country to another. The projections are taken to the end of the transition period in 1970. However, to bring out possible changes in the pace of expansion during the 10-year period, projections to 1965 have also been given.
5. Part II of the report gives the working party's provisional findings. These
cover the first two stages of. the programme. The report therefore presents esti-mates of the projected growth of the gross national product of the Community States in 1965 and 1970, together with a breakdown of these estimates into the main components of the national product.
The working hypotheses on future employment trends were established after studying demographic prospects .in general and allowing for migrations, foreseeable changes in the rate of employment (female labour, school-leaving age,
retirement age) and probable vaariations in numbers of unemployed. It will be
possible to review these hypotheses as the future employment situation,
accord-ing to region, industrial sector and skills, becomes clearer. Similarly, the
hypotheses on overall productivity in terms of gross product per person employed can be amended when sector trends are better known.
It was deemed advisable not to compile one estimate only of the future
growth of the national product, but to produce alternative projections. The
higher of these is considered by the working party as the major growth hypoth-esis given favourable general conditions. To study the implications of rather slower growth, another set of projections was worked out.
In breaking down the overall projections according to the main components of national income, working hypotheses on the development of private and public investment were adopted. They are based on previous trends in capital forma-tion, on likely changes in the relationship between investment and gross product, and on any known programmes for house building and major public infrastructure works.
Of course these hypotheses may be altered after a detailed investigation of the relationship between investment and output in the leading sectors of economic activity. The working party also chose working hypotheses, set out in the report, on the future development of public and private consumers'
expend-iture. As regards the balance of external trade, it was assumed that in 1970
EEC would have a surplus on current balance adequate to finance both capital export and aid to the developing countries.
6. The estimates of expansion adopted vary from country to country according
to the expected trend in the supply of labour and in productivity. Forthe Commu-nity as a whole employment should grow by 7%, though with great variations
between countries - the increase is expected to be only 3.4% in Germany but
14.1% in the Netherlands. In the ten years envisaged the rise in the gross
with certain differences in national rates (40% in Belgium, hut about 60% in Italy). As the anticipated increase in productivity is higher in those countries where the product per employed person is at present low, the projections indicate a levelling up of overall productivity which is in conformity with the objectives of the Rome Treaty and pardy attributable to the establishment of the Common Market.
When aggregated, the national economic projections show for the Community
as a whole an average overall expansion of about 4.8 % per annum between
1960 and 1970 under the major growth hypothesis. The table below summarizes the results for each country between 1950 and 1960 and the development pros-pects for 1960- 1970 as they emerge from the working party's report.
GROWTH OF GROSS NATIONAL PRODUCT IN EEC: RESULTS AND PROSPECTS
(on the major expansion hypothesis)
(percentage increase per 5-year period)
Country 1950-1955 1955 -1960 1960-1965 1965-1970
Germany 54.2 35.0 24.1 21.9
Belgium 17.6 12.9 20.5 21.1
France 24.2 22.9 28.R 25.8
Italy 33.6 33.0 33.5 32.3
Netherlands 31.3 22.6 23.4 27.2
EEC 35.0 2R.1 27.0 25.3
7. Thus the working party's report provides even at this stage a broad but
consistent general picture of economic development in the Member States between
now and 1970. The Commission therefore felt that the document should not
merely be reserved for internal use, but has authorized its publication.
There have in fact been repeated requests for estimates of potential economic growth in the Member States during the years ahead. Such projections are useful to private transactors, by enabling them, while remaining completely free in their investment decisions, to allow for the probable future trend of the
market. They are also useful as a guide to public authorities in the choices
which have to be made. Thus it seems increasingly necessary to orientate
conjuncture policy in the light of medium and long-term growth prospects. Sim-ilarly, a well-advised policy of income distribution presupposes the possession of information on the way production is likely to shape, since plans to develop the economic and social infrastructure must take account of availabilities and needs which will make themselves felt several years hence.
At European level the decisions of principle called for in the setting up of the Common Market - for instance on agriculture, energy, transport and
voca-tional training - have to rely on certain hypotheses as to the Community's
8. It s~oulc:l also be remembered that the first Ministerial Council of OECD, meeting on 16 and 17 November 1961, took as the collective target for member countries of the Organization in the period 1960 - 1970 a 50% increase in gross
national product. This decision implies that the OECD countries will follow
the requisite economic policies for reaching the target set. In view of the impor-tance of the Six as an economic unit within OECD, it is of the greatest moment that the Common Market countries should joindy reflect on the Community's
economic prospects for the ten years ahead. The work whose fruits are set
out in this document is the technical prerequisite for a confrontation of the growth policies of the Member States.
9. For all these reasons the Commission attaches great importance to this
report, but, like the members of the working party themselves, is keenly aware of the special difficulties inherent in this kind of studies and of the limitations of such work.
Even in a national setting, development projections are seriously handi-capped by technical and statistical difficulties. Establishing economic projections for a body of countries which are in process of integration and whose structures are therefore undergoing far-reaching change, involved even greater problems, and there was no precedent to guide the working party in solving them. Before this work could be undertaken difficulties of a statistical order - not all of which have yet been solved - had to be cleared away: the most considerable is the lack of any input/output tables for the Community as a whole, but the work now in hand should shordy fill the gap.
The working party has described its investigations in the following terms : "The work undertaken does not in itself constitute an attempt at planning; it does not set up any imperative target, either for the whole economy or for
indi-vidual business sectors. Stricdy speaking, it is not even forecasting [ ••• ]
The aim is to clarify economic policies."
The working party chose the term "projections" for its study. Projections are not forecasts, since they make no allowance for the manifold technical or political changes which may occur or for fluctuations in the economic situation. By observing previous economic developments and adopting certain working hypotheses, they chart the possible expansion of the economy during the period considered on the basis of existing economic and financial policies. Outstand-ingly efficient economic policies will probably encompass better results; con-versely, unforeseen economic contingencies or less successful policies might result in slower growth.
Nor should it be overlooked that the significance of the working party's
hypou~eses varies from one country to another. To be sure, it is not simply a matter of aggregating national data but rather of attempting coherent projections for the Community as a whole: the projections submitted by the members of the working party for their respective countries were discussed and reviewed at
10
resulting from the Common Market. Nevertheless, the diversity of the means
used by Governments to ensure the growth of their national economies has a bearing on the significance of the estimates presented. In Belgium and France for instance, the projections for 1965 are based on the growth targets set by the Government.
The members of the working party also stress that this report, which covers only part of the programme adopted, is to some extent provisional: the
estimates adopted may be revised as the studies advance, and this will
neces-sarily affect the final result. This first report will shordy be completed and, where necessary, corrected by a further one containing estimates of final demand by main categories of products and of output in the industries supplying them.
10. The Commission believes that the document, whatever its limitations,
already affords food for thought to those directing economic policy, and hopes that it will trigger off a wide-ranging discussion inside the Community that will, among other things, result in improved projection methods in the different countries and assist the working party in its efforts to build on the results already obtained. The report emphasizes the Community's solidarity and inter-dependence, and the possibilities and prerequisites of sustained expansion for
the benefit of all member countries; it demonstrates the need for joindy defining
measures or programmes to secure the objectives laid down in Article 2 of the Treaty of Rome, i.e. the rapid growth, harmonious development and full utili-zation of all productive forces.
The Commission trusts that the prosecution of these studies will result in greater knowledge of development prospects in Community countries and of
the economic policy problems which may arise. Its hope is that the already
INTRODUCTION
1. In September 1958 the Commission of the European Economic Community
published a report drawn up by a group of experts under the chairmanship of M. Pierre Uri on the economic situation in the Community countries.
This report was not an analysis of the economic situation at a given point in time, nor an attempt at forecasting. Its aim was to describe a basic situation on the eve of the initial measures for the establishment of the European Common
Market. It therefore endeavoured to bring out the salient features of the economic
position of each country and of the Community as a whole and the trends which could be noted. By underlining similarities and dissimilarities in the structure and growth of production, the external trade balance, and financial and price systems, it provided material for evaluating the changes which the establishment of the Common Market would involve, the adaptations which would prove neces-sary and the points on which action would have to be focused.
2. It became clear that a further study was-needed to throw light on the shape
of things to come. The problems which the establishment of the Common Market involves both for Governments and industrialists vary according to the pace of expansion in the Community as a whole and in each member country and industry.
In particular the longer the period allowed for investment - whether in plant,
research or personnel training - to go on yielding results, the more essential it is to guide the choices that must be made. The European Economic Commission therefore decided to instruct the same group of experts to produce a survey of long-term development prospects.
The work does not in itself constitute an attempt at planning; it does not set up any imperative target, either for the whole economy or for individual
sectors or firms. Strictly speaking, it is not even forecasting. In other words
it is not claimed that the predictions will necessarily be fulfilled as they stand. One reason is that technically and politically unforeseeable changes may occur,
particularly over an extended period. Predictions have to be made on certain
hypotheses which, though they take for granted a particular rate of economic and technological progress, nevertheless ignore any possibility of major upsets. Long-term prospects are moreover not the same thing as conjunctural swings; they concern an underlying trend, whereas in the very years covered by the period considered, activity may be higher or lower due to short-term fluctuations. Finally, the chief object of the exercise is to clarify the economic policies and the actions of those concerned with a view to obtaining better results therefrom. Among the terms used in this field the working party has chosen "projecting"
12
PART ONE
ECONOMIC SIGNIFICANCE OF THE PROJECTIONS
3.
Two sets of changes have occurred during the period since1958:
changesdue to economic growth and those attributable to the establishment of the Common
Market. It is obviously reasonnable that the projec·tions should be carried
forward to the point at which the transition period under the Treaty of Rome
should normally close, i.e.
1970,
taking1965
as an intermediate bench-mark. Inany case allowance should also be made for technological changes such as new sources of energy supply or advances in automation.
The establishment of the Common Market has altered the tempo and forms of development by hastening the decline of certain uneconomic or obsolescent productions' but much more by strengthening incentives to investment and pro-ductivity and imposing a more efficient and rational orientation of economic policies.
4. This grouping of several countries to form a Common Market, with its
combination of two types of structural change, presents obvious difficulties for compiling projections and determines the choice of methods to be used. The available statistical data are not necessarily uniform from one country to another; the figures are not necessarily as meaningful for the future, according to whether or not the country concerned has, like France or, in different forms, Belgium and the Netherlands, an overall economic programme: the quantified projections thus vary in nature from targets to mere computations.
5. From the methodological standpoint, the combination of several countries,
each having its own structures and conditions of mutation, precludes the ex-clusive use of a model based on a small number of parameters and coefficients. Formulas of this kind, in which the principal variables are the supply of labour and of capital, together with, in more accurate and realistic models, an independ-ent factor for higher productivity, do allow developmindepend-ent curves to be plotted
which match pretty well the trends actually recorded. But such a synthetic
method disregards precisely those details of structural change, i.e. leads and lags in development between sectors or regions, which in practice set the most concrete problems for solution.
All these considerations explain why the method chosen was that of
interconnected moves, and at the same time making it possible as the work proceeds to find and establish the necessary quantified data on criteria that
are as uniform as can be Here we will attempt to state the conceptual
frame-work of the method, leaving an account of the initial results for Part II.
6. The basic phenomenon is that demand does not grow in the same
pro-portion for every sort of goods or services as we go up the scale of incomes.
This is true first of all if final expenditure is broken down into its four main
components: private consumption, public consumption, investment (private and public) and exports.
It should be noted incidentally that public consumption is not the same
thing as total current public expenditure. A considerable share of budgets goes to transfers whose effect is to take away from some people's purchasing power and to give more to others, with consequences visible in the consumption or investment by the latter.
Public consumption therefore represents expenditure on goods and serv-ices by the public authorities as required for their functioning, in particular
the employment of their officials. Some of this public consumption develops
on fairly autonomous lines: this is the case in particular with defence
expend-iture. But other elements are tied in the long term to variations iri production
and consumption. Such are the maintenance and operational costs of transport systems, expenditure on health and social equipment, education and scientific and technical research.
Investment is broken down into fixed capital and stock changes. If
con-junctura! variations are eliminated, the increase of stocks results from the increase of production itself, which demands greater supplies and above all involves expansion of the volume of work in progress as well as of goods for
sale. The level of fixed investment, public or private, is of decisive
import-ance for the actual rate at which output can expand.
Exports depend on the level of external demand, on competition from other suppliers and on the margins left over by internal demand.
Finally, the major factor in overall demand is private consumption. As basic needs in food, clothing and housing are satisfied, demand turns increasing-ly to other categories of goods, in particular consumer durables and miscel-laneous services. This progressive shift in demand means uneven growth possi-bilities in the various sectors of supply.
7. In the initial stage there is no choice but to analyze these variations of
demand in abstraction from price variations, and in terms of higher output, i.e.
real income. However, this is only a provisional step. Even without general
price movements - which moreover have to be kept within narrow limits by a
according to production and supply conditions, and spurts in demand, and these in their turn react on demand itself. The equilibrium which has to be established both internally and externally must apply not only to quantity but to value. In due course therefore hypotheses, necessarily vague and subtle, on relative price variations by main categories of products or services will have to be introduced.
8. Thus, our reason for taking as a starting-point variations in the composition
of demand according to income levels is not to rule out other considerations. It
is that these variations depend on fairly well-defined relationships, whereas changes in production conditions are governed by technological innovation and sector leads and lags in productivity which cannot be foreseen during the initial phase of the work and before the trend of demand is roughly determined. Such alterations in the composition of demand enable the most probable rate of devel-opment to be determined. The disparity in develdevel-opment rates by sector and in production conditions helps to place a limit on the indeterminacy of the probable
growth-rates. In this way the relation between investment and output and the
call which a given form of demand makes on any particular category of resources determine a probable area of equilibrium. In short, consideration of demand in itself throws into relief the cardinal influence of supply.
9. The most spectacular transformations in the working of the economy result
from advances in certain sectors of production due either to more plentiful
re-sources or to new techniques which step up productivity. It should be noted
straight away that these variations in productivity affect relative prices: this is the way in which a balance is struck between availabilities and demand.
It is therefore when we go beyond the pha~e of analysis at constant prices that
the supply factors, in so far as estimates of them are not too hazardous, can most validly be drawn into the analysis.
10. A second basic r~mark is called for: future projections do not prejudge
the economic policies to be actually followed, except in their most general
features. We are bound to assume that these policies will manage to secure a
high level of employment and avoid intolerable external imbalances. Converse-ly, as our account of the oudook gains in substance and in depth, one of the ess entia! services it renders is to bring out the differing effects of different
economic policy measures. In this way the attention of Governments can be
drawn to the precise significance and scope of measures they are called upon to take, and the projection becomes more accurate by taking in more detailed hypotheses on the line of action which the public authorities will follow.
The projection work will be done in the light of these general remarks,
following a growth model shortly to be submitted.
I. THE GENERAL TRENDS IN EXPANSION
11. A projection of the growth of production generally comes down to a
evaluation of the probable advances in productivity. While the first component already inevitably includes uncertainties, albeit their range of effect is limited, particularly as regards demographic trends, school-leaving age, retirement age, working hours and numbers of women in employment, the second includes a considerable element of conjecture.
Should we apply the rates of productivity increment noted over a very long period, say a century? Should we, on the contrary, in the light of experience over the last fifteen years, concede that the rate is tending to speed up now-a-days? Or should we adopt an intermediate solution, more favourable than the secular trend, but steering clear of simply extrapolating the results of a recent
period abnormally influenced by reconstruction and rehabilitation? It is
rea-sonable to adopt this last approach, filling in the gaps by taking account of phases of development and structural changes in sectors where productivity seems to be making most rapid strides. An analysis of the ratio of investment to product against time will provide guidance in the choice of this middle solution.
However we cannot improve upon such subjective evaluations without methodically building a coherent model which takes account of changes in demand. This is why the first place of the work combines two sets of studies: on the relation of income growth to demand, and on the expansion rate of GNP.
a) Relation of demand to incomes
12. The first set of studies calls for an analysis of the relations between
the development of overall income and that of the different forms of demand -in the first instance the four main types of demand mentioned above: private
consumption, investment, public consumption, exports - and thereafter more
specifically a study of the trend of the various forms of private consumption according to categories of products and services at different income levels.
These relationships can be expressed in the form of a coefficient of elasticity,, i.e. the ratio between the percentage variation of a type of demand and the percentage variation of a global quantity such as gross national product, income available for consumption or total consumption. Provided the influence
of other factors can be eliminated or determined, the apparent elasticity
consti-tutes a sufficiently accurate instrument of projection. These elasticities are
not necessarily constant, and more complex relations may have to be brought
into the picture. Suffice it to note for the present that such an analysis is
hypothetical in the strict sense of the term: meaning that if the global variable changes by X points, the form of demand considered changes by Y points.
b) The choice of provisional expansion hypotheses
13. These variations should therefore be hitched to relatively fixed values, in
will be of such and such a value in the period considered. This can only be
a provisional hypothesis. It is only when the work is completed that a valid
model of the trend can be produced. This is a sufficient reason for not initially choosing a single growth-rate but adopting at least two values. Nevertheless it was deemed advisable that one of these two values should be treated as the principal growth hypothesis corresponding to favourable general conditions. Factors which might possibly determine a slower expansion rate may vary from country to country, whether it is a question of, say, balance of payments diffi-culties, manpower shortages or problems arising from a downturn in the business
situa cion. However, there is no reason why all these factors should operate
simultaneously. The alternative rates chosen at the outset therefore do not
merely reflect uncertainty as to the favourable or unfavourable circumstances in which economic policies will operate or as to the policies' effectiveness, but also answer a basic methodological requirement: if we are not to take a great number of variant growth hypotheses, the possible consequences of more than one must be analyzed so that there shall be nothing arbitrary about the results presented. By bringing out the effects of different growth-rates first on the structure of demand then on the structure of production, on the Community's internal and external trade, on manpower and capital requirements, we can finally determine an optimum rate representing the best possible compromise
between expansion and equilibrium. It is also by analyzing such hypotheses of
varying degrees of optimism that the action to be expected of the public
author-ities, national or European, can be more precisely determined.
II. THE BREAKDOWN OF THE OVERALL PROJECTIONS
For this we have to proceed from demand projections to output projections. By a combination of studies on demand in relation to income with overall devel-opment hypotheses, we can fix the values of the various types of demand at constant prices. From this we can compute the required outputs in two succes-sive stages.
a) 11 Function-product 11
cross-tabulation
14. Each type of final expenditure is itself broken down into a series of
products and services supplied by what might be called the delivering sectors, which in any of the countries may be either a production, an importation or
distribution. Thus, the demand for food is made up of concrete needs, such as
those for meat or fruit, and is satisfied either directly by agricultural outputs, or by commercially distributed domestic or imported products, or industrially processed foods.
b) Input-output tables according to sector of origin of the products
15. The final products are themselves but the elaboration of intermediate
man-made fibres, i.e. of home-grown agricultural products or imports or products of the chemical industry. Clearly the required volume of investment or manpower needs can only be determined once we pass from final expenditure sectors to the productive sectors as a whole. This calls for the establishment of an inter-industry table displaying relations between sectors which are mutual suppliers and purchasers and demonstrating how final and intermediate demand are covered by production and imports.
III. ECONOMIC PROJECTIONS FOR THE COMMUNITY
16. The transition from national to Community economic projections poses
the difficult problem of the consistency of the hypotheses chosen for the
indi-vidual countries. Over and above the material comparability of the national
projections, membership of the Common Market carries with it vital consequences: now that the Market has been set up, increased demand in any country may no longer be met by allocating more than its fair share to domestic output. This is one first reason for the aggregation, at Community level, of the increments in production corresponding to the higher demand estimated for each individual country under the alternative initial hypotheses.
a) Projections of external trade
17. This theoretical reason is supported by a practical argument: in supply,
at any rate of finished products, as in overall markets, external trade always
represents the most doubtful factor, since it is dependent on the pace of
devel-opment in foreign countries, changes in their trade policy and competition from
other suppliers. For the Community as a whole external trade as such, i.e.
relations with third countries, represents a much smaller fraction of total output than the total external trade of each Member State with other Community countries. The incidence of the inevitable uncertainties is also proportionately lower. Analysis of the relationship between production and imports is comparatively simple at Community level, where the mass of imports from non-member countries consists of a few essential primary commodities, chiefly important raw ma-terials(!).
In view of the intense demand for the products which the Community countries have to sell, it may be assumed that exports of goods and services will finance the necessary purchases. The re-emergence of Europe as a lender, its level of development, the requirements of the world we live in, warrant the belief that the Community will henceforward be able to maintain a surplus on
(1) It still remains true that, apart from materials whose demand is directly regulated by the rate of output within the Community, imports of food products competing with domestic productions. of energy products and of manufactured goods are govemed by overall agriculrural. energy and trade
its current external balance sufficient to finance capital exports and aid to the less-favoured countries. This surplus, plus total purchases of goods and serv-ices, gives the estimated external demand for the goods and services supplied by the Community.
b) Consideration of national price structures
18. Consideration of the external balance itself implies an assessment of
variations in price relationships between what the Community supplies or pur-chases.
In the same way an estimate of die investment requires for the increased outputs indicated in the table for the various final or intermediate sectors pre-supposes an estimate of the relative prices of capital goods.
c) Analysis of the basic balances
19. Social accounting must take in first, manpower availabilities; second, the
external balance - which should not involve any abnormal problem; and third
- and even more important - the possibilities of internal equilibrium, i.e. of
financing, out of tax revenue and savings, the needs of the public authorities, internal investment and the surplus on the current external balance.
Such an analysis of the basic balances, taking fully into account the conditions of supply and treating as an essential factor relative price variations resulting from both supply and demand, enables an overall long-term growth-rate for the Community as a whole to be arrived at.
d) Breakdown of growth within the Community
20. A valid estimate of the trend in countries' outputs in terms of the
compet-Itive situation of each of their industries must be approached no longer in this manner directly, but by way of the Common Market as a whole. But even then
it is necessary to check each country's external balance. The aim should be to
show what the conditions for equilibrium are in each case. Will it occur spon-taneously, with relative variations of national prices or unequal growth-rates
or movements of capital or labour - remaining within moderate limits? Or,
on the contrary, is there not a danger that these stabilizing mechanisms in each separate balance of accounts will assume such proportions that their total effect is to impair the competitive situation of the indus tries in different regions? In this case would they not have to be supplemented by a concerted policy, notably with the aim of securing a harmonious distribution of specializations
20
Finally, one of the essential objects of the study will be to try and predict the trend in the regional distribution of activities, particularly the development of new areas of growth. Such a geographical redistribution depends both on the overall rates of expansion, on the relative development of the various industrial sectors, on technological changes, and on economic policy measures and their effect on the siting of industry. We are here dealing with a field in which long-term projections are both most difficult and most indispensable, having regard to the time it takes to make the required investments, whether it be for infra-structure, personnel training and even - unless we wish to see stmctural reforms carried out, through lack of forethought, under deplorable human conditions
-the creation of new conurbations. Thus we see how a study by successive
approximations supplies an overall framework into which the sector studies, each with its own contribution to make, particularly in agriculture, regional studies, and the comparative analysis of public budgets and of the tools of conjunctural policy, can be fitted.
21. Too much emphasis cannot be laid on the magnitude of the difficulties of
various kinds met with at each stage in the work. Some stem from the inadequacy or heterogeneity of the statistical data available, and a great effort is now being
made in the Community to complete and harmonize these. Others result from
the impossibility of foreseeing important changes, particularly in technique,
sources of supply or working conditions. Still others relate to the interplay
of predictions and policy. Hence both the progressive approach adopted, and
the emphasis on the idea of a projection as something clearly distinct from a forecast.
The method adopted, with its successive stages, focuses on a common centre the analysis of overall economic situations and the Community sector analyses, which can only be properly carried out with due heed for the external
equilibrium of the separate national economies. The method also has the
PART TWO
, ECONOMIC GROWTH IN THE EEC FROM 1960 TO 1970:
RESULTS OF THE PROJECTIONS
22. Following the principles set out in Part I, the Working Party adopted
growth hypotheses for each country's gross national product between 1960,
1965 and 1970. We shall begin by stating these basic hypotheses and the
grounds for choosing them. The national economic projections were then aggre-gated in such a way as to display developments in the Community as a whole during the ten-year period. But before they could be aggregated these projections had first to be compared and confronted: in particular the hypotheses for each country had to take account of the interdependence of the national economies in the growth process. But it was also necessary to avoid the contradictions which might have resulted simply from differences of opinion on general or particular special points between the experts in their appraisal of future pros-pects. Much mutual consultation was needed to thrash out ideas on the economic outlook that would be, if not similar, at any rate not too far apart and not in-compatible.
These confrontations, which went on during the whole time the projections were being established, called for much thought on changing structures and the growth trend. The guiding concern at all times was to narrow down any differ-ences not founded on comparisons between the present state of affairs and the way economic structures are shaping.
The projections established for each country were then broken down by categories of expenditure of the gross product, in such a way as to show, for the Community as a whole, what shares went to investment by firms and Govern-ment departGovern-ments and to private and public consumption. It was also necessary to compare the different gross national products as broken down before sum-mation.
This first report will merely set out the national economic projections chosen, compare and collate them in the Community setting, and lastly break
Section I
OVERALL NATIONAL ECONOMIC PROJECTIONS
23. For the EEC countries the Working Party chose the growth hypotheses
of gross national product from 1960-1965 and 1970 shown in Table 1.
Of the two variants chosen, B is considered as the major growth hy-pothesis, while A shows the results of more moderate growth.
In view of past economic trends it is not possible to assume that the
future pace of growth will remain constant, nor to locate the point in 1960 at
which the acceleration revealed by a comparison between previous results and the projections, set in.
It is necessary to stress the importance of changes in the growth-rate, whether they occur gradually with the passing years or are produced by the supervention of some determining factor, whether they are the fruits of a delib-erate policy of speeding up expansion or reflect the play of forces which deter-mine the volume of product attainable.
Although it is not necessary to indicate the anticipated growth,
disre-garding cyclical rate fluctuations, for each year from 1960 to 1970, a trend can
be discerned by choosing an intermediate benchmark : 1965.
The projections are established at constant prices, taking 1%0 as
refer-ence year. For purposes of overall comparison they have been converted into
dollar units of account at 1960 rates. The parities used are the following, in
US dollars : Germany 0.23975 - Belgium 0.02004 - France 0.20390 - Italy
0.00161 - Netherlands 0.26511.
The application of these parities to the components of the gross product nevertheless distorts the comparison of overall per capita expenditure within EEC in so far as the real purchasing power of individuals for their own con-sumption, and of enterprises for equipment, does not correspond exactly to the results obtained by using the official parities.
24. The overall national economic projections are based on the anticipated
trend in numbers employed and in productivity of labour during the period.
growth-rate on the other, only one employment hypothesis was used for the projections, coupled with two different hypotheses as to gross product per person employed.
However, productivity and labour force trends are not independent of one
another. It is only in the first approximation that a single growth hypothesis
of employed manpower can be taken. The evaluation of sectoral and inter-regional transfers of manpower associated with differing rates of expansion would subsequently call for more than one estimate of the employment trend.
The prospective trends in labour force (1) were estimated by applying to
the probable pattern of total population in 1965 and 1970 either constant activity rates weighted for certain special factors, or variable rates estimated on the basis of past results.
The productivity figures were in principle based on hypotheses regarding productivity per man/hour and working hours.
These basic hypotheses must be worked out in such a way as to show
the foundations on which the projections are based and if possible the
direc-tions which action to maintain or speed up economic expansion should take.
The demographic projections chosen b'y the experts are summarized in the tables below; thereafter a rapid description of the methods used in each country is given.
(1) The estimates of employed manpower in 1965 and 1970 on which the national economic
projec-tions were based do not always tally with the projecprojec-tions published by the Statistical Office of the European Communities ("Informations statistiques • 1961 No. 3 ). The discrepancies arise first from the date chosen for the evaluations: 1 January by the Statistical Office and mid-year by the Working Party A further factor is the date when the hypotheses on the trend of the active population were established: in some cases additional information came to hand after the Sta· tistical Office's estimates had been published. This applies particularly to the evaluation of migratory movements and of the natural growth of total population. Lastly, differences may be due to divergent appraisals of the weightings to be applied to the basic forecasts established at constant activity rates. So far as possible the weighting factors used by the experts have been indicated in the report. Incidentally, the Statistical Office of the European Communities will continue its work towards improved means of determining future trends in total and active population using the latest available data, particularly census results and more accurate studies
Germany
(F.R.)
Belgium France Italy Netherlands EEC
a) Total population
Natural growth Migrations
Total
b) Labour force
Initial forecast (1 )
Corrections for: School-leaving age Women employed Retirement age Migrations Adjustment
Total
Rate of activity
c) Employed manpower
(Unemployed)
Total
Rate of occupation
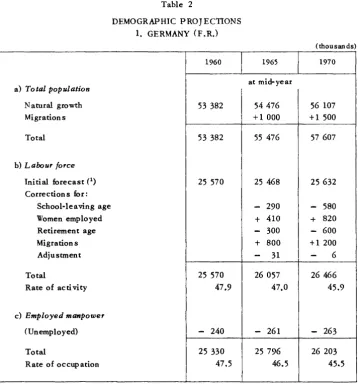
Table 2
DEMOGRAPHIC PROJECTIONS 1. GERMANY (F .R.)
1960
53 382
53 382
25 570
25 570 47.9
- 240
25 330 47.5
(thousands)
1965 1970
at mid-year
54 476 56 107
+1 000 +1 500
55 476 57 607
25 468 25 632
-
290-
580+ 410 + 820
-
300-
600+ 800 +1 200
-
31-
626 057 26 466
47.0 45.9
- 261 - 263
25 796 26 203
46.5 45.5
(1) Initial forecast: application to the structure of the population in 1965 and 1970 of the rates of activity arrived at for the year.
a) Sources: Official population statistics: see "Wirtschaft und Statistik" 1962 No. 2.
b) Hypotheses:
Natural growth with constant fertility and decreasing infant mortality.
Migrations: an annual average surplus of 75 000 men and 25 000 women from mid-1961
to mid-1970. A further surplus of 600 000 for the year 1960 to 1961. 80% is taken as the rate of activity of migrants.
Employed manpower: the hypotheses on the trend in the rate of occupation indicate
a change from 47.5% in 1960 to 46.5% in 1965 and 45.5% in 1970. The percentage of unemployed remains constant. With slight adjustment, these hypotheses correspond to a
[image:25.485.36.395.60.445.2]26
2. BELGIUM
(thousands)
1960 1965 1970
a) Total population at mid-year
Natural growth 9153 9364 9 558
Migrations + 65 + 130
Total 9153 9429 9688
b) Labour force
Initial forecast 3670 3673 3752
Corrections for:
School-leaving age
-
20-
40Women employed + 38 + 76
Retirement age
-
4-
8Migrations + 38 + 75
Total 3670 3725 3855
Rate of activity 40.1 39.5 39.8
c) Employed manpower
(Unemployed)
-
65-
70-
70Total 3605 3655 3785
Rate of occupation 39.4 38.8 39.1
a) Source: Bureau de programmation economique.
b) Hypotheses: Initial forecasts for 1965 and forecasts of labour force weighted by interpolation.
3. FRANCE
(thousands)
1960 1965 1970
I
::1) Total population at mid-year
Natural growth 45 542 46378 47907
Migrations
+
770+
1543Total 45 542 47148 49450
b) Labour force
Initial forecast 19730 20390 21270
Corrections for:
School-leaving age
-
460-
810Women employed
+
50+
100Retirement age
-
100-
200Migrations
+
350+
720Labour force available
for employment 19730 20230 21080
National service - 550 - 360 - 350
Total 19180 19870 20730
Rate of activity 42.1 42.1 41.9
c) Employed manpower
(Unemployed) - 220 - 250 - 300
Total 18960 19620 20430
Rate of occupation 41.6 41.6 41.3
a) Sources: Demographic statistics established by INSEE on the basis of the 1954 census.
b) Hypotheses
-Natural growth: projections at constant fertility and declining mortality rates (INSEE); Immigration: net balar-ce calculated on the basis of 1960, relying on certain hypotheses
(Fourth Plan, INSEE, Statistical Office of the European Communities, a national expert);
Initial forecast of the projections of worlcing population: constant activity rates,
basis 1954, after corrections and adjustments for variations between 1954 and 1960. Other weightings calculated on the hypotheses adopted for the Fourth Plan, by INSEE and by the Statistical Office of the European Communities.
28
4. ITALY
(thou sands)
1960 1965
I
1970I
a) Total population at mid-year
Natural growth (49 250) (51 520) (53 853)
Migrations (- 750) (-1 500)
Total 49250 50777 52 353
b) Labour force
Initial forecast (20645) (21 289) (21 723)
Corrections for:
School-leaving age (- 160) (- 410)
Women employed (+ 640) (+1 250)
Retirement age (- 260) (- 460)
Migrations
-
-Total 20645 21311 21992
Rate of activity 41.9 42.0 42.0
c) Employed manpower
(Unemployed)
-
850-
590-
311Total 19795 20 721 21681
Rate of occupation 40.2 40.8 41.4
Sources and hypotheses:
The del"lographic statistics relate to the present population; hypothesesonmigrations and nul"lbers of unel"lployed are, as stated, calculated on the basis of surveys by the Italian Central Statistical Institute (taking the average of the four annual surveys). (1) TTntil such time as new population projections based on the last census are available, it may be noted that the forecasts of the Statistical Office of the European Communities assumed an in· crease in the active population at constant activity rates of 3.12% between 1960 and 1965 and of 2.03% between 1965 and 1970. Applied to the working population in mid-1960, this gives totals of 21289000 in 1965 and 21723000 in 1970.
The Statistical Office of the European Communities has also applied the following weight-ings after 1960 :
- 160 000 in 1965 and- 410 000 persons in 1970, to allow for later school-leaving; - 260 000 in 1965 and- 460 000 persons in 1970, to allow for earlier retirement;
+640000 in 1965 and +1250000 persons in 1970, to allow for greater numbers of women in employment.
The basic forecasts are calculated on the present population.
The figures between brackets are estimates which are independent of the chosen hypo· theses of demographic changes.
5. NETIIERLANDS
(thousands)
1960 1965 1970
a) Total population at mid-year
Natural growth 11507 12 211 12 939
Migrations
-
58-
113
-Total 11507 12153 12 826
b) Labour force
Initial forecast 4224 4616 4973
Corrections for:
School-leaving age
-
61--
122Women employed
+
25+
50Retirement age
-
10-
20Migrations
-
19-
48Total I (2) 4224 4 551 4833
Total II (2) 4 396 (1) 4 738(1) 5033(1)
Rate of activity (calculated on total I) 36.7 37.4 37.7
c) Employed manpower
(Unemployed)
-
49-
65-
71Employed
in private enterprises 3 854 (1) 4 148 (1) 4411 (1) mployed
in public authorities 493 (1) 525(1) 551(1
)
Total III (2
) 4175 4486 4 762
Total IV (2) 4 347
(1) 4 673 (1) 4 962 (1)
Rate of occupation (calculated on total III) 36.3 36.9 37.1 in%
e)
In thousands of man/years.(2) The estimates of the active population given in thousands of man/years are derived from social security statistics. and estimates of the active population in thousands are based on a sample survey in 1959.
a) Sources: Demographic statistics of the Centraal bureau voor de statistiek.
b) Hypotheses:
Basic forecasts of working population established at constant activity rates, weightings made by the Centraal bureau voor de statistiek.
The changeover from forecasts by thousands of persons to those by thousands of ma1 /years has been effected on the basis of the ratio between these two sets of data in 1960. (2
)
30
For the remaining components of the projection the following hypotheses and methods were adopted :
1. GERMANY
The growth. estimates for the period 1960-1970 were computed on the basis of three sets of hypotheses concerning the trend of the occupied popu-lation, the length of the working week and productivity per man/hour.
a) Employed manpower: For the period 1960-1970 Table 2-1 shows an
increase of 3.4% in occupied persons : the rate of occupation for the whole population will fall, according to these figures, from 47.5% in 1960 to 46.5% in 1965 and 45.5% in 1970.
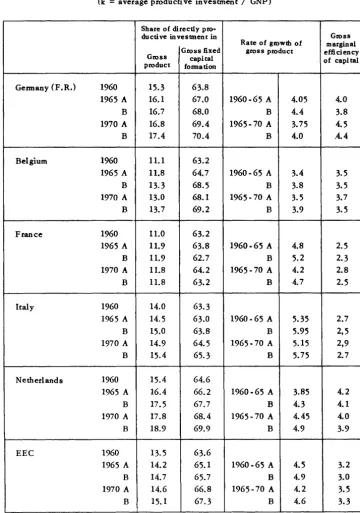
25. b) Productivity per man/ hour: This was DM 4.87 in 1960; it is estimated
that it could rise to DM 6.25 by 1965 and DM 7.87 by 1970 under variant B, the major growth hypothesis. This would correspond to a gain of 28% in pro-ductivity between 1960 and 1965, and of 62% between 1960 and 1970. Under
variant A, the increase would be only 26% - DM 6.14 by 1965 and 57%
-DM 7.63 by 1970. These hypotheses are based on the relation of productivity increment to total investment in the past. The share of GNP accounted for by directly productive investment, which was 15.3% in 1960, would rise to 16.7% in 1965 and to 17.4% in 1970 under the major growth hypothesis (16.1% in 1965 and 16.8% in 1970 under variant A).
26. c) The length of the working week: This averaged 44 hours in 1960;
under the hypotheses adopted it would fall to 41.8 hours by 1965 and 39.8 hours by 1970, a reduction of nearly 10% for the whole period. 15% of this would be offset by improved hourly productivity resulting directly from the shorter hours, so that at constant productivity the working week would merely be reduced
from 44 to 42.1 hours in 1965 and to 40.4 hours in 1970. For variant B the
trend in productivity per man/ year resulting from these estimates is as follows :
2 673 dollars in 1960
3 257 dollars in 1965 (+ 22 %)
3 905 dollars in 1970 (+ 46 %)
Under variant A the figures are as follows :
3 200 dollars in 1965 (+ 20 %)
3 786 dollars in 1970 (+ 42 %)
27. The major growth hypothesis B shows an expansion of 51% in Germany's
gross national product at constant prices between 1960 and 1970, i.e.
The same trend in growth-rate, showing a slight falling off in relation to the previous 10 years, is adopted for hypothesis A:
46.5% from 1960 to 1970 22% from 1960 to 1965 20% from 1965 to 1970.
Comparison of these figures with past results shows a slight slowdown in growth in the course of the decade. It should be recalled that at constant prices the gross national product in Germany grew by
54.2% between 1950 and 195·5, then by 34.5 % between 195 5 and 1960
i.e. 107% from 1950 to 1960.
The expected increase from 1960 to 1970 would be no more than 46.5% (variant A) or 51.1% (variant B).
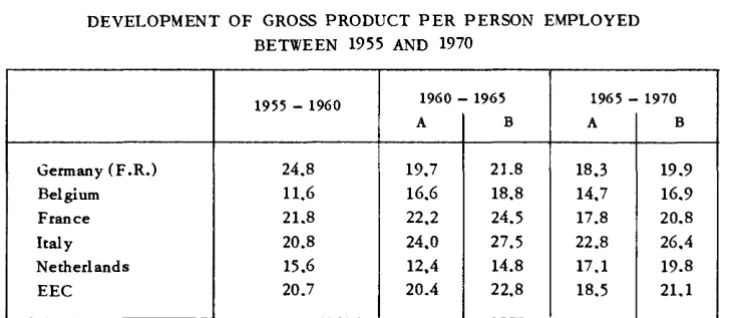
From 1955 to 1960 productivity rose by 24.8 %. In future, the figures
would fall, under the two hypotheses, to
2. BELGIUM
21.8% and 19.9% from 1960 to 1965, and to 19.7% and 18.3% from 1965 to 1970.
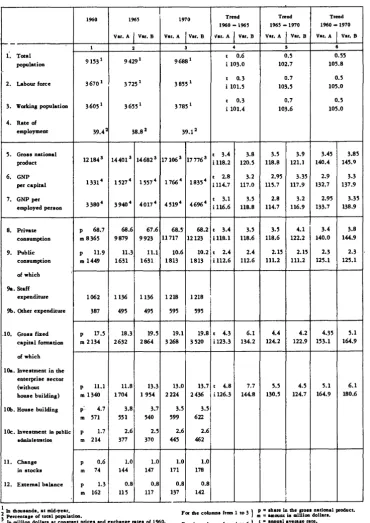
28. The eronomic projections for Belgium established by the Bureau de
programmation economique (Office for Economic Programming) are based on four independent development hypotheses, relating to :
i) The diminished domestic product (gross domestic product less the added
value of public services and housing);
ii) Services rendered by civil servants, imputed rents and capital consumption ;
iii) Housing;
iv) Net factor income from abroad.
The last three components of gross national product in 1965 and 1970 were estimated in the following way:
a) Housing. This depends on the demographic trend and the tendencies making for a more rapid renewal of housing accomodation. It is expected to increase by 7.8% over the ten-year period.
b) For the added value of public services an increase in establishment of 14.6% between 1960 and 1970 has been predicted; imputed rents and capital consumption by the State have been estimated separately.
c) As regards net factor income from abroad, it is assumed that the present surplus would be maintained, since the trends which would be liable to modify
For the diminished domestic product an endeavour has been made first to define possible general trends in the expansion of the gross national product leading to conditionally possible increases in the gross domestic product.
The major growth hypothesis assumes that the GNP will rise by 20.5%
between 1960 and 1965, i.e. an average of 3.8% per year. This variant B,
which has been called an "overtaking hypothesis", assumes that by 1965 Belgium will have sloughed off the effects of the 1958-1960 downturn and the ensuing lag in growth. Variant A - an 18.2% growth in GNP - corresponds to a long-term increase of 3.4% per year, taken as a feasible target in the absence of any deliberate policy of speeding up growth. For 1970, variant B assumes that the overtaking rate of the 1960-1965 period has become a structural rate, and that everything will be done to continue it in the long-term beyond 1970.
Under variant A the long-term increase, after taking up the slack of the lean years 1958-1960, will maintain the same pace as in 1960-1965. Thus the overall rise in GNP between 1960 and 1970 under hypotheses A and B will be 40.4% and 45.9%.
To fulfil these conditions, the diminished domestic product would expand by 57.8% under variant B, and by 50.9% under variant A.
In 1965 the diminished domestic product would have to increase by 25% under variant A and 27.8% under variant B.
3. FRANCE
29. a) Trend of the GNP
The French projections are made by using the concept of gross domestic output.
We will first examine the growth prospects selected under this head, before going on to consider those elements on which the conversion from gross domes tic output to GNP can be effected.
The final comprehensive figures for the Fourth Plan show the growth of gross domestic output for the years 1959/1961 - 1965.
The indices adopted are the following:
Growth 1959-1961: 111.4 Growth 1961-1965: 124.0 Growth 1959-1965: 138.1
The Report on the National Accounts for 1961 shows that gross domestic output advanced by 6. 7% between 1959 and 1960.
On the basis of these figures, the increase of gross domestic output