This is a repository copy of Worth the Risk? : The Behavioural Path to Well-Being. White Rose Research Online URL for this paper:
http://eprints.whiterose.ac.uk/109749/ Version: Accepted Version
Article:
Howley, Peter orcid.org/0000-0002-3385-629X, Dillon, Emma, Heanue, Kevin et al. (1 more author) (2016) Worth the Risk? : The Behavioural Path to Well-Being. Journal of Agricultural Economics. ISSN 0021-857X
https://doi.org/10.1111/1477-9552.12202
[email protected] https://eprints.whiterose.ac.uk/
Reuse
Items deposited in White Rose Research Online are protected by copyright, with all rights reserved unless indicated otherwise. They may be downloaded and/or printed for private study, or other acts as permitted by national copyright laws. The publisher or other rights holders may allow further reproduction and re-use of the full text version. This is indicated by the licence information on the White Rose Research Online record for the item.
Takedown
If you consider content in White Rose Research Online to be in breach of UK law, please notify us by
1
Worth the risk? The behavioural path to well-being
Peter Howley, Emma Dillon, Kevin Heanue and David Meredith1
Abstract:There is an increasing interest in the ‘economicsof happiness’, reflected in
the volume of articles appearing in mainstream economics journals exploring the major determinants of self-reported well-being. We contribute by exploring the factors influencing how satisfied farmers are with their quality of life. We find that farm income, subjective perceptions relating to the adequacy of household income, debt, health and personal characteristics such as age and relationship status are
significantly associated with farmers’ self-reported life satisfaction. While significantly associated with farm income, farm structural variables such as farm size, farm type and the presence of a farm successor were not found to be significantly related with life satisfaction. Our results also suggest that farmers who are more risk averse enjoy significantly lower levels of both life satisfaction and farm income than their more risk seeking or risk neutral counterparts. We suggest that, in the same way that risk aversion inhibits farmers from making choices that could lead to an increase in their income, it may also constrain farmers (and the wider public at large) from engaging in certain types of behaviors that could lead to an increase in their self-reported quality of life. Finally, we find that while farm income is significantly related with self-reported life satisfaction, the direct correlation between these variables is weak suggesting that farmer life satisfaction can be distinct from business success.
Keywords: life satisfaction, risk aversion; farm income
JEL Classifications: Q12; I31
1. Introduction
One of the central assumptions underpinning neo-classical economics is that utility is
formed based on consumption of goods. In keeping with this conceptualisation of
well-being, economists have typically focused on increasing the choices available to
people through, for example, raising incomes so that individuals can satisfy their
preferences (Harsanyi 1982; Dolan and White 2007). Recently, however, there has
been a resurgence of interest among economists in subjective indicators of well-being
as money and economic growth are increasingly recognised as inadequate indicators
of progress, especially in developed countries (Constanza et al., 2014). For example,
1 Peter Howley is the contact author ([email protected]) in the Environment
2
even though GDP has tripled over the past 50 years in the US, life satisfaction has
remained largely unchanged (Diener & Seligman, 2004). While consumers are
becoming increasingly satiated with products, this is not matched by increases in how
they rate their quality of life (Forgeard et al., 2011). The abundance of goods and
services coupled with static or declining levels of life satisfaction has been described
as the ‘progress paradox (Easterbrook, 2003).
Economists have traditionally paid much less attention to the determinants of
subjective as opposed to objective indicators of well-being, due to concerns as to
whether subjective data can really serve as an adequate proxy measure of utility.
Emerging interdisciplinary research has begun to address these concerns and
increasingly suggests that self-rated questions about life satisfaction have a high
scientific standard in terms of internal consistency, reliability and validity, and can be
a valid approximation for individually experienced welfare or utility (see Dolan and
White 2007 for a review). Research in psychology has shown, for instance, that
responses to questions about life satisfaction correspond with external reports on
respondents by others (e.g. friends and partners) and life satisfaction ratings have also
been shown to be highly correlated with actual behaviour, e.g. suicide (Di Tella et al,
2003; Bray and Gunnell, 2006; Clark et al., 2008). As a result of these developments,
there has been increasing work on using indicators of subjective well-being for
economic and soical policy (e.g. Donovan and Halpern, 2002; Kahneman and Sugden,
2005; Layard, 2005; HM Treasury, 2008; Dolan and Metcalfe, 2012). This work has
analysed how economic factors such as income, wealth, and employment as well as
non-economic factors such as personality traits, health and socio-demographics affect
individuals self-reported life satisfaction (see Dolan et al., 2008 for a review).
We add to this body of work by seeking to understand the dynamics of life
satisfaction for a sub-group of the population where little life satisfaction work has
previously been undertaken. Farmers are an interesting group to explore as farming is
often associated with both having a satisfying life as well as a way of making a living
(Howley 2015). Outside the farming context, a wide range of studies have shown that
3
organizationally employed, reflecting greater autonomy of choice (Blanchflower and
Oswald 1998; Benz and Frey 2008a,b). Being a farm operator also offers greater
autonomy of choice, but there are likely to be a number of other nonpecuniary
benefits that are of relevance to farming that may not be observable, at least to the
same degree, in other types of self-employment. These include benefits such as
working outdoors and more generally perceived lifestyle benefits from living in a
rural area and close to work. In other words, farmers farm for reasons other than
maximizing profit and, for many, farming itself may be an occupation that increases
life satisfaction (Howley, 2015; Howley et al., 2015; Maybery et al., 2005; Willock et
al., 1999a: 1999b), at least for those who choose it. Ruth Gasson’s classic study in
1973, for example, identified four broad ‘value orientations’ that were important for
farmers. These were ‘instrumental’ (make money, expanding the business), ‘social’ (maintaining a tradition), ‘expressive’ (creativity) and ‘intrinsic’ (enjoyment of work
tasks, lifestyle preference) (Gasson 1973).
In seeking to better understand the dynamics of farmers’ well-being, we examine the relationship between a variety of variables such as age, education, relationship status,
off-farm work, income, debt, subjective perceptions of financial health, farm
structural factors and health with farmers’ self-reported life satisfaction. Apart from our focus on farmers, where little happiness-related research has being undertaken,
our additional novel contribution is an examination of the relationship between risk
aversion and self-reported life satisfaction. A common conjecture in economics is that
risk aversion can discourage people from engaging in risky activities that might
advance their economic well-being (MacCrimmon and Wehrung 1990; Guiso and
Paiella 2005; 2008). Focusing specifically on farmers, there is much empirical
evidence to suggest that risk aversion could inhibit farmers from adopting
efficiency-enhancing technologies that would on average be net-income efficiency-enhancing, but carry
risks of failure (Marra et al., 2003; Yesuf 2007). We hypothesise that a similar
argument could also be made in relation to self-reported life satisfaction. To put it
simply, in the same way that risk aversion inhibits individuals from making choices
that could lead to an increase in their income, it may also constrain people from
4
quality of life. We provide a useful first step in testing this proposition by examining
the relationship between risk attitudes and both farm operators’ self-reported life
satisfaction as well as their farm income.
2. Risk attitudes
Investment and production decisions by farmers take place within environments that
are affected by a multitude of risks. Consequently, the role of risk attitudes on
farmers’ land use and management decisions has been a topic of continuing interest
for agricultural economists (e.g. Binswanger 1980; Chavas and Holt 1996; Liu 2013).
Risk attitudes have been posited as a potential barrier to the adoption of
efficiency-enhancing technologies or alternative land use activities carrying a higher expected
return. The argument here is that risk aversion can lead to farmers foregoing
welfare-improving opportunities by being less willing to undertake activities and investments
that have higher expected outcomes, but carry with them risks of failure (Marra et al.,
2003; Yesuf 2007). Beyond the agricultural economics domain, there is now a large
body of research which suggests that risk-averse individuals are relatively more likely
to forego higher expected returns, for returns with lower variability (Hartog et al.,
2002; Guiso and Paiella 2005; 2008). The net effect is that more risk-averse
individuals should have less variable earnings but end up with, on average, less
income and wealth.
In the same way that risk aversion could hinder individuals from making choices that
would increase earnings, risk aversion may also constrain individuals from making
choices that would have a net positive effect on their overall life satisfaction. We
derive a measure of the level of farmers’ risk aversion and test the association
between this measure and the life satisfaction of farm operators as a useful first step in
testing this proposition. In order to determine the role of risk aversion on life
satisfaction, we developed a psychometric scale reflecting risk attitudes, based on a
number of attitudinal statements reflecting the importance of general farming related
risks. The statements draw on a variety of previous work (see Bard and Barry 2000;
Pennings and Garcia 2001; Xu 2005; Winsen et al. 2016) and are designed to assess
5
reduce these data to a latent construct reflecting farmers’ degree of risk aversion. To
date, at least in the economics literature, responses towards lottery-type experiments
(e.g. variants of the Holt and Laury, 2002 multiple price lists) are often used as the
basis for measuring risk aversion. However, there is an increasing body of evidence,
especially in the psychology literature, which suggests that risk attitudes are highly
malleable with respect to context (MacCrimmon and Wehrung 1990; Goldstein and
Weber 1995; Weber et al. 2002; Johnson et al., 2004; Dohmen et al., 2011). In other
words, risk preferences elicited using lottery-type experiments may apply only to
gambling behavior, and may not serve as a good representation of risk preferences in
other contexts, e.g. in farming. Responses to multi-item scales have the advantage of
providing a context-specific measure of risk aversion and are also rather less
cognitively demanding for participants.
3. Methodology
The data used in this study come from a cross sectional survey of 364 principal farm
operators in County Offaly, Ireland, conducted over 12 weeks between January and
April 2013. A survey company was hired to conduct the interviews with farmers. A
quota controlled sampling procedure was followed to ensure that the survey was
broadly representative of the farming population in Ireland along the key dimensions
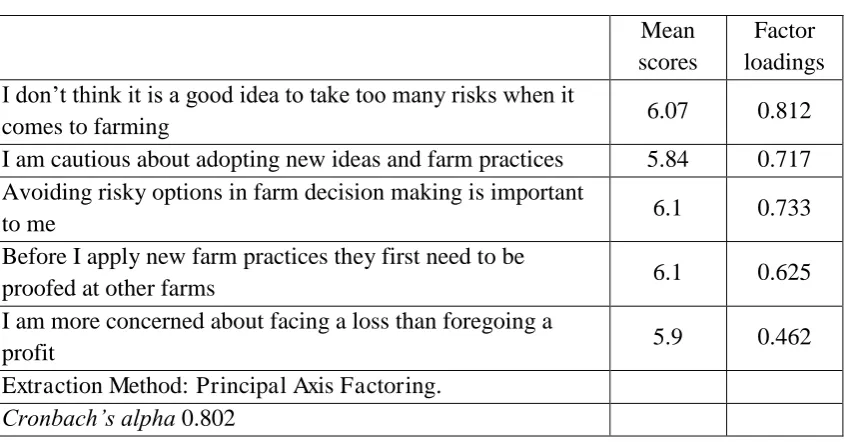
of farm size and farm type. To provide a measure of farmers’ risk aversion,
respondents were read a list of 5 general statements (see table 1) and were asked to
state their agreement on a scale from 1 (completely disagree) to 7 (completely agree).
An exploratory factor analysis of these attitudinal statements resulted in one factor
with an eigenvalue greater than one.
As can be seen in table 1, all of the attitudinal statements had high loadings on this
factor, labelled as ‘farming risk aversion’. The higher a farm operator’s score on this
scale, the more averse they are to farm related risks. A number of tests were applied to
test the validity of the factor analysis. The Kaiser-Meyer-Olkin measure of sampling
adequacy is 0.83 indicating that the data matrix has sufficient correlation to justify the
application of factor analysis. Using Bartlett’s measure of sphericity we reject the
6
alternative hypothesis that there is a significant relationship between the variables (p <
.0001). Furthermore, there is a high degree of consistency in responses to the
attitudinal statements reflecting farming risks, as indicated by a Cronbach’s alpha of
0.802.
The life satisfaction indicator used in this paper is based on responses to the following
question (see table 2): ‘Thinking about the good and bad things in your life, which of
these answers best describes your life as a whole?’,on a scale from 1 to 7 (‘As bad as
can be’; ‘very bad’; ‘bad’; ‘all right’; ‘good’; ‘very good’; ‘exceptional’). In the literature to date, the answer to this question has been referred to as subjective
well-being, (Blanchflower and Oswald 2004; Ferrer-i-Carbonell 2005), or as self-reported
life satisfaction (Luttmer 2005; Brereton, Clinch and Ferreira 2008), or as quality of
life (Bryla, Burzynska and Maniecka-Bryla 2013). Since our measure of life
satisfaction may not be cardinal (i.e. a given interval between measures may not have
a consistent meaning), an ordinal model such as an ordered probit or ordered logit is
preferable to a linear regression model. In our analysis, we ran an ordered logit model
in Stata to examine the relationship between a variety of characteristics of the farm
and farmer with life satisfaction.
To ascertain farm income, respondents were given a payment card with various
intervals and asked to indicate which of these best describes their annual farm income
before taxes and exclusive of subsidies such as the single farm payment (see table 3).
A payment card approach was used as it was thought that this method (as opposed to
asking respondents an open-ended question) would result in a relatively high response
rate. As illustrated in table 3, we observed a relatively high response rate especially in
light of the commonly reported difficulty of getting respondents to answer income
related questions in surveys. In addition to collecting data on farm income, a question
to provide a measure of farmers’ own subjective assessment of the adequacy of their
household income was also included in the survey questionnaire. Respondents were
simply asked to rate the financial situation of their own household on a scale from 1
(very bad) to 5 (very good). We hypothesized that a subjective assessment relating to
7
satisfaction than objective measures of farm income. To provide further insight into
the role of perceptions relating to financial health on subjective well-being, farmers
were also asked to assess their levels of debt. Farmers were thus asked: ‘which of the
following would best describe the level of debt in your farm business’ and given three
options, namely none at all, lightly in debt or heavily in debt. Background personal
characteristics such as age, education, gender and relationship status as well as farm
structural characteristics including farm size, farm type and presence of an identified
farm successor were also collected and included in the regression analysis of life
satisfaction (see table 4 for more details in relation to the structure of these variables).
Insert table 1 here
Insert table 2 here
One of the more robust findings in the literature relating to the determinants of
individuals’ life satisfaction is the effect of self-reported measures of health status
(see Dolan et al. 2008 for a review of this literature). We included two measures of
subjective health status in the survey questionnaire. First, farmers were given 5
options ranging from 1 (very bad) to 5 (very good) as a response to a question which
asked farmers ‘how is your health in general?’. This can be thought of as reflecting
respondents’ general long-term evaluation of their health status. Second, farmers were presented with a vertical, visual analogue scale (EQ-VAS) with endpoints
labelled ‘the best health you can imagine’ and ‘the worst health you can imagine’.
Farmers were then asked to simply ‘mark an X on the scale to indicate how your
health is TODAY’ and then to ‘write the number you marked on the scale in the box
below.’ The EQ VAS is a quantitative measure of health as judged by the individual
respondent and is widely used in clinical trials, observational studies, and other health
surveys (e.g. see Hurst et al., 1997; Jia and Lubetkin 2005; Konig et al., 2009).
Insert table 3 here
8
4. Results
4.1 Self-reported life satisfaction
Farmers in our survey appear to be largely satisfied with their quality of life (see table
3) with twenty-one percent reporting that it is either very good or exceptionally good,
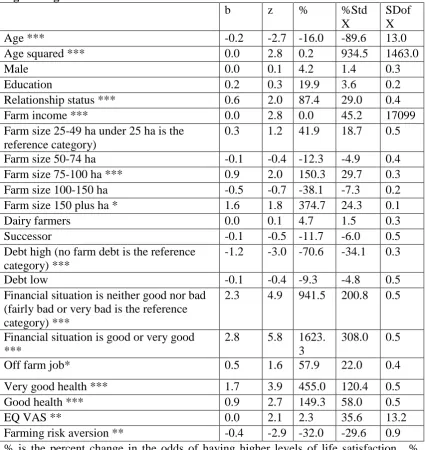
and 51 percent reporting that their quality of life is good. Table 5 presents the results
of our ordered logistic model of life satisfaction. Ordered logit models imply a
non-linear relationship between the explanatory variables and the ordinal dependent
variable. Under this specification, the coefficients cannot be directly interpreted with
any substantive meaning. Effects for the logistic model can, however, be interpreted
in terms of changes in the odds by taking the exponential of both sides of our equation
(see Long and Freese 2006). This is interpreted as follows: for a unit change in the
independent variable, the odds of having higher levels of life satisfaction are expected
to change by a factor of exp ( n), holding all other variables constant.
The odds ratios for both a unit and standard deviation change of the independent
variables are presented in table 5. Examining the effect of a standard deviation change
(column headed % StdX2) is particularly useful when variables have heterogeneous
scales as in this study. As these standardised coefficients are all on the same scale
(standard deviation changes), this is a useful method for communicating not just the
signs and significance of our explanatory variables but also the overall magnitude of
their effect on life satisfaction, i.e. the bigger the number in the column headed %
StdX the more substantive the relationship.
We find a negative relationship between age and life satisfaction but a positive
relationship between age squared and life satisfaction. This is consistent with
previous research, which suggests a U shaped relationship between age and life
satisfaction, with higher levels of well-being for the relatively younger and older
groups and with lowest levels of satisfaction in middle age (Blanchflower and Oswald
2004: Ferreri-Carbonnell and Gowdy 2007). While some previous studies have also
2 The Spost9 collection of Stata ado files was used for post-estimation interpretation (see Long and
9
found a positive association between education and life satisfaction (Blanchflower
and Oswald 2004) we find no statistically significant effect of education in our
sample. As noted by Dolan et al. (2008), the coefficient on education is often
responsive to the inclusion of other potentially confounding variables in the regression
analysis such as health and income, both of which we control for in our analysis.
Farmers who are in a relationship are 87 percent more likely to have a higher life
satisfaction score than farmers who are not in a relationship, also consistent with
much previous work (Helliwell 2003). This could be primarily due to selection
effects, i.e. those who are happier are more likely to be in a relationship and married
people may also have greater access to and stronger social ties with extended family,
neighbours, friends, and spouse’s colleagues and friends (Putnam 2000). Farm
structural factors such as farm system and the presence of a successor do not appear to
be significantly related to life satisfaction, and there is no consistent pattern for the
effect of farm size.
Again, consistent with the literature, we find a positive relationship between income
(in this instance farm income) and life satisfaction (Blanchflower and Oswald 2004
Ferrer-i-Carbonell 2005). A one standard deviation increase in farm income
(approximately €17,000) is associated with a 45% increase in the probability of
having a higher life satisfaction score. The extent to which this effect is truly causal is
an open question with evidence suggesting that happiness may lead to higher future
incomes (Diener et al. 2002; Graham et al., 2004). In addition to objective measures
of income, there is now a rich literature documenting the importance of individuals’
subjective assessment of the adequacy of their income (Clark 2003; Luttmer 2005;
Ferrer-i-Carbonell 2005). Our findings are also consistent with this research, as we
find that farmers’ subjective evaluations to be a much more important predictor of life
satisfaction than farm income. As can be seen from the column headed %StdX (table
5), this measure also appears to have a much stronger relationship with life
satisfaction than any of the other explanatory variables included in the regression
analysis. Consistent with previous research (Brown, Taylor and Wheatley Price 2005;
Bridges and Disney 2010), debt was also found to be a significant predictor of life
10
significantly less likely to have a higher life satisfaction score than farmers who
reported no farm debt. Farm operators with an off-farm job are 22 percent more likely
to have a higher life satisfaction score. Self-reported health status has frequently been
found to be a strong correlate of subjective well-being (Helliwell and Putnam 2004;
Shields and Wheatley Price 2005). In our sample, both long term and current health
status (EQ VAS) are significant predictors, though respondents’ assessment of their
health in general has a more substantive relationship with life satisfaction than their
current health status (EQ VAS).
Finally, ‘farming risk aversion’ has a significant association with variation in life satisfaction. A one standard deviation increase in our measure of risk aversion is
associated with a 30 percent decrease in the odds of a higher life satisfaction score.
The farmer with the lowest score for the variable ‘farming risk aversion’ (i.e. least
risk averse) has a mean predicted probability of reporting a very good or exceptional
life satisfaction of 0.32; i.e. all things being equal, it would be expected that 32
percent of farmers with these characteristics would report a very good or exceptional
quality of life. On the other hand, the farmer with the highest factor score (most
risk-averse) had a mean predicted probability of 0.07; i.e. all things being equal, it would
be expected that 7 percent of farmers with these characteristics would report a very
good or exceptional quality of life. The %StdX column (table 5) indicates that
farming risk aversion has an important association with life satisfaction equivalent to
that of relationship status and levels of farm debt, but is substantially less substantive
than farmers’ self-reported health status and their subjective assessment of household
income. In unreported regressions (available upon request), we also estimated our
model of life satisfaction using ordinary least squares (OLS), which generated the
same signs and significance of the explanatory variables. Using OLS has the
advantage of allowing for the estimation of the explanatory power of the model as a
whole, and indicates that the explanatory variables account for a reasonable share of
the variation in farmers’ life satisfaction (R² = 0.37). However, almost two thirds of
the variation in reported life satisfaction appears to be related to other uninvestigated
or unknown factors, or is random noise.
11
4.2 Determinants of farm income
As discussed in section 2, there is a substantial body of research which suggests that
risk aversion is negatively related to objective indicators of well-being such as income
and wealth. Therefore, one potentially useful mechanism to test the construct validity
of our risk attitude measure is to examine if this is significantly related with farm
income. To obtain a measure of farm income, farmers were presented with a payment
card (see table 3). For analytical ease, the midpoint in each interval on the payment
card was taken as a measure of respondents’ farm income, thereby allowing us to use
conventional ordinary least squares regression (OLS) in examining the relationship
between our measure of risk aversion and farm income. Reported findings, were
found to be robust when compared to alternative modelling approaches such as using
a Tobit (one observation right censored at €100,000) or an interval regression model.
The results from the regression analysis of farm income can be seen in table 6. For
consistency, we used the same set of control variables as that used in our analysis of
life satisfaction. The regression model as a whole accounted for a reasonably large
share of the variation in farm income (R² =0.38), though as with the life satisfaction
model above, almost two thirds of the variation in farm incomes remains unexplained
by these factors. ‘Farming risk aversion’ is negatively related with farm income (table
6), as it is with reported life satisfaction (table 5). Relatively more risk-averse farmers
are likely to earn on average significantly less from their farm business than more risk
neutral or risk seeking individuals. For instance, the average predicted farm income
for the farmer with the highest score on the attitudinal construct ‘farming risk
aversion’ (most risk averse) was €17,546 whereas for the farmer with the lowest score (least risk averse) it was €26,829.
The results for the other explanatory variables are as expected. For example, dairy
farmers earned on average €7,686 more from their farm enterprise than non-dairy farmers (e.g. livestock or tillage producers). Dairy farming in Ireland is relatively
more intensive than other farming systems and as a result the marginal productivity is
generally higher (Hennessy and Moran, 2014). Farm size was also positively related
12
incomes. There are a number of possible explanations for this relationship. First,
succession planning presents a complex challenge for family farms, as farmers face
conflicting objectives such as the need to maintain a viable farm business for the next
generation, treat all of their children fairly and provide for their own retirement
(Wheeler 2012). This complexity and the potential family conflict and tension such a
planning process might generate, may hinder farmers in pursuing behaviors that
increase farm profitability (Lobley et al. 2010). Internal family settlements, e.g.
provision of land for housing of other family members or cash payments to siblings,
may also impinge on the capacity of the successor to implement changes. In general,
farmers with an identified farm successor may place relatively more weight on
ensuring the succession and survival of the family farm as opposed to maximising
profit (Gasson and Errington 1994; Kimhi and Nachlieli 2001; Sottomayor et al. 2011;
Ingram et al. 2013).
Age, gender and relationship status were not found to be statistically significant
predictors of farm income, unlike life satisfaction where age and relationship status
were found to be important. On the other hand, education in contrast to life
satisfaction, was found to be significantly related with farm income, as farmers with a
third level education were found to earn, on average, €12,270 less on the farm than
those without a third level education. This could be suggestive of higher marginal
returns to education in the off-farm labor market or simply reflect the fact that
individuals who pursued a third level education are perhaps less likely to want to
spend time working on the farm (Howley et al. 2014; Heanue and O’Donoghue 2014).
Whereas debt was negatively related with life satisfaction, farm indebtedness was
found to be positively associated with farm income. For example, farmers who felt
that their farm business was heavily in debt or lightly in debt were found to have a
farm income which was, on average, €6,655 and €4,569 higher respectively than
farmers who reported no farm debts. This may either reflect acquired debt being used
to finance increased farm income, or simply that debt service costs requires an
increase in productive effort. Much previous work suggests that health issues are an
important driver of agricultural productivity as well as life satisfaction and the
13
Specifically, farmers who report themselves as having a very good health status, earn
on average €10,513 more from their farm business than those farmers who report that
their health is less than good. The EQ VAS measure of health was not found to have
a significant relationship with farm income.
Next we examine the direct correlation between farm income and self-reported life
satisfaction, to ascertain the extent to which one can be held as a reliable proxy for the
other, when considering farmer welfare. While farm income, as can be seen in table 5,
is significantly related with self-reported life satisfaction, the direct correlation
between these variables is weak (spearman’s rho = 0.29) which suggests that farmer
life satisfaction can be quite distinct from farm business success. In addition, the
correlation between farmers’ perceptions of the adequacy of their household income and self-reported life satisfaction is also weak (spearman’s rho = 0.26) which suggests
that subjective measures of income can also give a significantly different
representation of farmer welfare than self-reported life satisfaction. Both our income
measures were also only weakly correlated with each other (spearman’s rho = 0.18)
which highlights the differences than can emerge when considering objective and
subjective representations of income.
Insert table 6 here
4.2 Study limitations
Although the relationships reported here are consistent with existing theory, they may
be limited to Irish farmers. Farmers in Ireland are relatively low-intensity and heavily
reliant on subsidy payments and off-farm income. It would be useful in future work
to investigate the drivers of farmer’s life satisfaction in other countries to establish the
findings’ generaliseability utilising a range of representative samples. One further unavoidable limitation of this work is that findings are limited by their cross sectional
nature. Future longitidinal work and/or research using instrumental variables would be
important directions for future work to help us to rule out biases associated with the
presence of confounding factors and bi-directional causality when examining the
relationship between risk and both economic and subjective indicators of well-being.
14
overview of some of the main factors associated with farmers’ life satisfaction and
also some indication of the importance of risk aversion in affecting both income and
self-reported life satisfaction.
5. Concluding Remarks
Income and wealth are important facets of well-being, allowing people to satisfy their
needs and pursue goals that they deem important to their lives. That said, well-being
as a concept encompasses more than simply financial status as there can be a
significant disparity between individuals’ objective circumstances and their
perceptions as to the overall quality of their life. For instance, we find that farmers
self-reported life satisfaction and farm income, which can be seen as an objective
measure of welfare, are only weakly correlated with each other, suggesting that
business success may not necessarily translate into increased life satisfaction. As
such, much research within the social sciences has used individuals’ self-reported life
satisfaction as an empirically valid and adequate approximation for individually
experienced welfare or utility, and has sought to better understand the determinants of
self-reported life satisfaction or happiness. The main aim of this study was to
examine what factors are related with farmers’ self-reported life satisfaction, with a
particular focus on the role of risk aversion. In keeping with research of non-farmers,
we find that pecuniary factors such as farm income, farm debt and subjective
perceptions relating to the adequacy of household income are significantly related
with life satisfaction. Subjective health status and background personal characteristics
such as age and relationship status also emerged as being significantly related with
farmers’ life satisfaction. While significantly related with farm income, farm structural variables such as farm size, farm type and the presence of a farm successor
were not found to be significant predictors of life satisfaction for this group. Another
difference between farm income and life satisfaction was in relation to the role of
farm debt. While perceptions in relation to the level of farm debt was negatively
related with life satisfaction, it was positively related with farm income, perhaps
15
Outside of the agricultural sphere, risk aversion has been found to be significantly
associated with economic well-being (e.g. income and wealth). The argument here is
that risk aversion affects investment behavior, with risk averse individuals being
relatively more willing to forego higher expected returns, for returns with lower
variability. Our analysis of farm operators is in line with this existing research, as we
find that farmers who are more risk averse earn, all things being equal, less income
from their farm business. In addition to being significantly related with objective
indicators of success, our results also suggest that farmers who are relatively more
risk averse are less likely to enjoy higher life satisfaction scores. One potential
explanation is that in the same way that risk aversion inhibits people from engaging in
certain behaviours that are net-income enhancing, but carry risks of failure, it may
also constrain farmers (and indeed the general public at large) from activities that
would on average improve their self-reported life satisfaction. Of course it is possible
that bi-directional causality could be partly driving these results in that happiness
itself could lead individuals to be less risk averse. Future longitudinal and/or work
using instrumental variables would be useful to further unpick the direction of these
relationships. There is also perhaps a need for further work to explore the extent to
which farmers, as a group, are more or less risk averse than other groups, and also
whether the apparent association between risk aversion and life satisfaction which we
find in our sample is replicated among other groups in society.
References
Bard, S.K., and P.J. Barry. 2000. “Developing a Scale for Assessing Risk Attitudes of Agricultural Decision Makers.” International Food and Agribusiness Management Review 3: 9-25.
Benz, M., and B.S. Frey. 2008a. “Being Independent is a Great Thing: Subjective
Evaluations of Self-employment and Hierarchy.” Economica 75(298): 362– 383.
—2008b. “The Value of Doing What You Like: Evidence from the Self-Employed in
23 Countries.” Journal of Economic Behavior and Organisation 68(3-4): 445-455.
16
Blanchflower, D.G., and A.J. Oswald. 2004. “Well-Being over time in Britain and the
USA.” Journal of Public Economics 88: 1359-1386.
Bray, I., and D. Gunnell. 2006. “Suicide rates, life satisfaction and happiness as markers for population mental health.” Social Psychiatry and Psychiatric Epidemiology 41: 333–337
Brereton, F.P., P. Clinch, and S. Ferreira. 2008. “Happiness, Geography and the Environment.” Ecological Economics 65: 386–96.
Brown, S., K. Taylor, and S. Wheatley Price. 2005. “Debt and Distress: Evaluating the Psychological cost of Credit.” Journal of Economic Psychology 26(5): 642–663
Bridges, S., and R. Disney, 2010. “Debt and Depression.” Journal of Health Economics 29(3): 388–403
Bryla, M., M. Burzynska, and I. Maniecka-Bryla. 2013. “Self-Rated Quality of Life of City-Dwelling Elderly People Benefitting from Social Help: Results of a Cross-Sectional Study.” Health and Quality of Life Outcomes 1-11.
Chavas, J.P., and M.T. Holt. 1996. “Economic Behavior under Uncertainty: a Joint Analysis of Risk Preferences and Uncertainty.” Review of Economics and Statistics 78(2): 329-335.
Clark, A. 2003. “Unemployment as a Social Norm: Psychological evidence from panel data.” Journal of Labor Economics 21: 324–351.
Clark, A.A., Fritjers, P. and Shields, M.A. 2008. Relative income, happiness and utility, Journal of Economic Literature 46: 95-144.
Costanza, R., Kubiszewski, I., Giovannini, E., Lovins, H., McGlade, J., Pickett, K.E., Ragnarsdottir, K.V., Roberts, D., De Vogli, R., and Wilkinson, R. 2004.
Nature “Time to leave GDP behind.” 505:283-285.
Di, Tella., R. MacCulloch, and A.J. Oswald. 2003. “The macroeconomics of
happiness.” Review of Economics and Statistics 85: 809–827
Diener, E., R.E. Lucas, S. Oishi, and M.S. Eunkook. 2002. “Looking up and Looking Down: Weighting Good and Bad Information in Life Satisfaction
Judgements.” Personality and Social Psychology Bulletin 28(4): 437–445.
17
Dohmen, T., A. Falk, D. Huffman, U. Sunde, J. Schupp, and G.G. Wagner. 2011.
“Individual Risk Attitudes: Measurement, Determinants and Behavioral Consequences.” Journal of the European Economic Association 9: 522-550.
Dolan, P., and M.P. White. 2007. “How can Measures of Subjective Well-Being be used to Inform Public Policy?” Perspectives in Psychological Science 2: 71– 85.
Dolan, P., T. Peasgood, and M. White. 2008. “Do we Really Know What Makes us Happy? A Review of the Economic Literature on the Factors Associated with Subjective Well-Being.” Journal of Economic Psychology 29: 94–122.
Dolan, P., and R. Metcalfe. 2012. “Measuring subjective wellbeing: Recommendations on measures for use by national governments.” Journal of Social Policy 41(2): 409–427.
Donovan, N. and Halpern, D. 2002. “Life Satisfaction: The State of Knowledge and Implications for Government”, London: Prime Minister’s Strategy Unit.
Diener, R.B., and E. Diener. 2001. “Making the Best of a Bad Situation: Satisfaction
in the Slums of Calcutta.” Social Indicators Research 55: 329-352.
Easterbrook, G. 2003. The progress paradox: How life gets better while people feel worse. New York: Random House.
Easterlin, R.A. 1974. Does Economic Growth Improve the Human Lot? Some empirical evidence. In P.A. David & M.W. Reder (Eds.), Nations and households in economic growth (pp. 89–125). New York: Academic Press.
Easterlin, R.A. 2001. “Income and happiness: Towards a unified theory.” Economic Journal 111: 465–484.
Easterlin, R.A. 2005. “Feeding the Illusion of Growth and Happiness: A Reply to Hagerty & Veenhoven.” Social Indicators Research 74: 429–443.
Ferrer-i-Carbonell, A. 2005. “Income and Well-Being: an Empirical Analysis of the
Comparison Income Effect.” Journal of Public Economics 89: 997-1019.
Ferrer-i-Carbonell, A., and J.M. Gowdy. 2007. “Environmental Degradation and
Happiness.” Ecological Economics 60: 509-516
Forgeard, M. J. C., Jayawickreme, E., Kern, M. L., & Seligman, M. E. P. 2011. Doing the right thing: Measuring well-being for public policy. International Journal of Well-being 1(1): 79–106.
18
Gasson, R., and A. Errington. 1994. Farming Systems and the Family Farm Business. In: Dent, J.B., McGregor, M.J. (Eds.), Rural and Farming Systems Analysis. CAB Inter-national, Wallingford, pp. 181–192.
Goldstein, W.M., and E.U. Weber. 1995. Content and Discontent: Indications and Implications of Domain Specificity in Preferential Decision Making. In: Busemeyer, J.R. (ed) The Psychology of Learning and Motivation. New York, Academic Press.
Graham, C., A. Eggers, and S. Sukhtankar. 2004. “Does Happiness Pay? An Exploration based on Panel Data from Russia.” Journal of Economic Behavior and Organization 55(3): 319–342.
Guiso, L., and M. Paiella. 2005. “The Role of Risk Aversion in Predicting Individual Behavior.”Banca D’Italia Working paper 546.
Guiso, L., and M. Paiella. 2008. “Risk Aversion, Wealth, and Background Risk.” Journal of the European Economic Association 6: 1109-1150.
Harsanyi, J.C. 1982. Morality and the Theory of Rational Behavior. In A. Sen & B. Williams (Eds.), Utilitarianism and beyond (pp. 39–63). Cambridge, England: Cambridge University Press
Hartog, J., A. Ferrer i Carbonell, and N. Jonker. 2002. “Linking Measured Risk Aversion to Individual Characteristics.” Kyklos 55(1): 3 26.
Heanue, K., and O’Donoghue, C. 2014. “The Economic Returns to Formal Agricultural Education.” Teagasc. Oakpark. ISBN: 978-1-84170-613-9
Helliwell, J.F. 2003. “How’s life? Combining Individual and National Variables to Explain Subjective Well-Being.” Economic Modelling 20: 331–360
Helliwell, J.F., and R.D. Putnam. 2004. “The Social Context of Well-Being.” Philosophical Transactions of the Royal Society 1435-1446.
Hennessy, T. and Moran, B. 2014. Teagasc National Farm Survey. Available at: http://www.teagasc.ie/publications/2015/3596/
TeagascNFSPrelimResults2014 final.pdf (accessed 17.12.15.)
Holt, C.A. and S.K. Laury. 2002. “Risk Aversion and Incentive Effects.” The American Economic Review, 92(5): 1644–1655.
Howley, P., E. Dillon, and T. Hennessy. 2014. “It’s Not All About the Money:
19
Howley, P., Buckley, C., O Donoghue, C. and Ryan, M. 2015. “Explaining the
economic ‘irrationality’ of farmers’ land use behaviour: the role of
productivist attitudes and non-pecuniary benefits.” Ecological Economics, 109, 186-193.
Howley, P. 2015. “The happy farmer: the effect of non-pecuniary benefits on behaviour”. American Journal of Agricultural Economics, 97, 1072-1086.
HM Treasury 2008. Developments in the Economics of Well-Being, Treasury Economic Working Paper 4, J. Lepper and S. McAndrew, London: HM Treasury.
Hurst, N.P., P. Kind, D. Ruta, M. Hunter, and A. Stubbing. 1997. Measuring Health-Related Quality of Life in Rheumatoid Arthritis: Validity, Responsiveness and Reliability of EuroQol (EQ-5D). British Journal of Rheumatology 36: 551–559.
Ingram, J., P. Gaskell, J. Mills, and C. Short. 2013. “Incorporating Agri-Environment Schemes into Farm Development Pathways: a Temporal Analysis of Farmer Motivations.” Land Use Policy 31: 267–279.
Jia, H., and E.I. Lubetkin. 2005. “The Impact of Obesity on Health-Related Quality-of
Life in the General Adult US Population.” Journal of Public Health 27: 156– 164.
Johnson, J.G., A. Wilke, and E.U. Weber. 2004. “Beyond a Trait View of Risk-Taking: A Domain-Specific Scale Measuring Risk Perceptions, Expected Benefits, and Perceived-Risk Attitude in German-Speaking Populations.” Polish Psychological Bulletin 35(3): 153-163.
Kahneman, D., and R. Sugden 2005. “Experienced utility as a standard of policy evaluation”. Environmental and Resource Economics 32: 161–81
Konig, H.H., S. Bernert, M.C. Angermeyer, H. Matschinger, M. Martinez, G. Vilagut, J.M. Haro, G. de Girolamo, G. de Graaf, V. Kovess, and J. Alonso. 2009.
“Comparison of Population Health Status in six European Countries: Results
of a Representative Survey Using the EQ-5D Questionnaire.” Medical Care 47:255–261.
Kimhi, A., and N. Nachlieli. 2001. “Intergenerational Succession on Israeli Family Farms.” Journal of Agricultural Economics 52: 42–58.
20
Liu, E. M. 2013. “Time to Change What to Sow: Risk Preferences and Technology Adoption Decisions of Cotton Farmers in China.” Review of Economics and Statistics 95 (4): 1386–1403.
Lobley, M., J. Baker, and I. Whitehead, 2010. “Farm Succession and Retirement:
Some International Comparisons.” Journal of Agriculture, Food Systems, and Community Development 1: 49-64.
Long, J.S., and J. Freese. 2006. “Regression models for categorical dependent variables using Stata”, 2nd ed. College Station, TX: Stata Press
Luttmer, E.F.P. 2005. “Neighbors as Negatives: Relative Earnings and Well-Being.” The Quarterly Journal of Economics 963-1002.
Macrimmon, K., R. Kenneth, and D.A. Wehrung. 1990. “Characteristics of Risk
Taking Executives,” Management Science 36: 422-435.
Maybery, D., L. Crase, and C. Gullifer. 2005. “Categorising Farming Values as Economic, Conservation and Lifestyle.” Journal of Economic Psychology 26(1): 59-72.
Mara, M., D.J. Pannell, and A.A. Ghadim. 2003. The Economics of Risk, Uncertainty and Learning in the Adoption of New Agricultural Technologies: Where are we on the Learning Curve? Agricultural Systems 75: 215-234.
Nielsen, T., A. Keil, and M. Zeler. 2013. “Assessing Farmers’ Risk Preferences and their Determinants in a Marginal Upland area of Vietnam: a Comparison of Multiple Elicitation Techniques.” Agricultural Economics 44: 255-273.
Osborne, A., C. Blake, B.M. Fullen, D. Meredith, D. Phelan, J. McNamara, C. Cunningham. 2014. “The Lived Experience of Low Back Pain Amongst Irish Farmers.” Journal of Agromedicine 19(2): 181-190.
Osborne, A., C. Blake, B.M. Fullen, D. Meredith, D. Phelan, J. McNamara, and C. Cunningham. 2013. “Work-Related Musculoskeletal Disorders Among Irish
Farm Operators.” American Journal of Industrial Medicine 56(2): 235-242.
Pennings, J. and Garcia, P. 2001. “Measuring Producers’ Risk Preferences: A Global
Riskattitude Construct.” American Journal of Agricultural Economics 83: 993–1009.
Reynaud, A., and S. Couture. 2012. “Stability of Risk Preference Measures: Results from a Field Experiment on French Farmers.” Theory and Decision 73: 203-221.
21
Shields, M., and S. Wheatley Price. 2005. “Exploring the Economic and Social Determinants of Psychological Wellbeing and Perceived Social Support in England.” Journal Royal Statistical Society (Part 3) 513–537.
Sottomayor, M., R. Tranter, and L. Costa. 2011. Likelihood of Succession and Farmers’ Attitudes towards their Future Behaviour: Evidence from a Survey in Germany, the United Kingdom, and Portugal. International Journal of Sociology of Agriculture and Food 18: 121–133.
Weber, E.U., A.R. Blais, and N.E. Betz. 2002. “A Domain-Specific Risk-Attitude Scale: Measuring Risk Perceptions and Risk Behaviors.” Journal of Behavioral Decision Making 15: 263-290.
Wheeler, S., H. Bjornlund, A. Zuo, and J. Edwards. 2012. “Handing down the Farm?
The Increasing Uncertainty of Irrigated Farm Succession in Australia.” Journal of Rural Studies 28(3): 266-275.
Winsen, F.V., Y.D. Mey, L. Lauwers, S.V. Passel, M Vancauteren. and E. Wauters
M. 2016. “Determinants of risk behaviour: effects of perceived risks and risk attitude on farmer’s adoption of risk management strategies.” Journal of Risk Research 19: 56-78.
Xu, P., C. Alexander, P. George. And W. Musser. 2005. “Effects of farmers’ risk attitude and personality types on production and marketing decisions.” Staff Paper 05-10, August, Department of Agricultural Economics, Purdue University.
22 Table 1: Farming Risk Aversion
Mean scores
Factor loadings
I don’t think it is a good idea to take too many risks when it
comes to farming 6.07 0.812
I am cautious about adopting new ideas and farm practices 5.84 0.717 Avoiding risky options in farm decision making is important
to me 6.1 0.733
Before I apply new farm practices they first need to be
proofed at other farms 6.1 0.625
I am more concerned about facing a loss than foregoing a
profit 5.9 0.462
Extraction Method: Principal Axis Factoring.
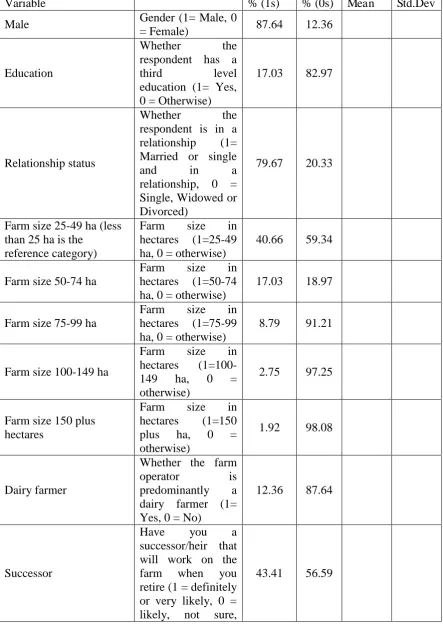
23 Table 2: Summary Statistics
Variable % (1s) % (0s) Mean Std.Dev
Male Gender (1= Male, 0
= Female) 87.64 12.36
Education
Whether the
respondent has a
third level
education (1= Yes, 0 = Otherwise)
17.03 82.97
Relationship status
Whether the
respondent is in a relationship (1= Married or single
and in a
relationship, 0 = Single, Widowed or Divorced)
79.67 20.33
Farm size 25-49 ha (less than 25 ha is the
reference category)
Farm size in
hectares (1=25-49 ha, 0 = otherwise)
40.66 59.34
Farm size 50-74 ha
Farm size in
hectares (1=50-74 ha, 0 = otherwise)
17.03 18.97
Farm size 75-99 ha
Farm size in
hectares (1=75-99 ha, 0 = otherwise)
8.79 91.21
Farm size 100-149 ha
Farm size in
hectares
(1=100-149 ha, 0 =
otherwise)
2.75 97.25
Farm size 150 plus hectares
Farm size in
hectares (1=150
plus ha, 0 =
otherwise)
1.92 98.08
Dairy farmer
Whether the farm
operator is
predominantly a dairy farmer (1= Yes, 0 = No)
12.36 87.64
Successor
Have you a
successor/heir that will work on the
farm when you
retire (1 = definitely or very likely, 0 = likely, not sure,
24
unlikely, definitely not)
Very good health (less than good is the reference category)
Respondents
evaluation of their health in general (1= Very good, 0 = Otherwise)
30.22 69.78
Good Health
Respondents
evaluation of their health in general (1= Good, 0 = Otherwise)
49.45 50.55
EQ VAS (Health score)
Respondents
evaluation of their health at the time of the survey
83.05 13.29
Debt High ( no debt is reference category)
Respondents
evaluation of the level of debt in their
farm business
(1=Heavily in debt, 0 = Otherwise)
13.19 86.81
Debt Low (No debt is reference category)
Respondents
evaluation of the level of debt in their farm business (1= Lightly in debt, 0 = Otherwise)
45.33 54.67
Off-farm job 1 = Has an off-farm
job, 0 = Otherwise 25.27 74.73
Financial situation is neither good nor bad
Respondents’
evaluation of the financial situation of their household? (1= neither good
nor bad, 0 =
otherwise)
32.14 67.86
Financial situation is good or very good
Respondents’
evaluation of the financial situation of their household? (1=good or very
good, 0 =
otherwise)
42.03 57.97
Age
Age of the farm operator (1=20, 2=30, 3=40, 4=50,
% youngest
(0.55)
% oldest
25
5=60, 6=70, 8=80)
Farming risk aversion
Derived factor
variable reflecting domain specific risk preferences
min (-3.03)
max
(1.73) -1.31 0.91
Dependent variables
Farm income
Annual farm
income before taxes (euros) and not including the single
farm payment? €20,959 €17,099
Subjective well-being
Respondents were asked: Thinking about the good and bad things in your life, which of these best describes your life as a whole? (1= As bad as can be, 2= Very bad, 3= Bad, 4=Alright,
5=Good, 6=Very
good,
7=Exceptional)
4.87 0.87
26 Table 3: Life satisfaction
Freq. Percent
As bad as can be 3 0.82
Very bad 3 0.82
Bad 6 1.65
All right 92 25.27
Good 185 50.82
Very good 71 19.51
Exceptionally good 4 1.1
Table 4: Farm Income
Freq. Percent
€0 - €3,999 per annum 41 11.58
€4,000 - €9,999 per annum 81 22.88
€10,000 - €19,999 per annum 97 27.4
€20,000 - €29,999 per annum 47 13.28
€30,000 - €39,999 per annum 26 7.34
€40,000 - €49,999 per annum 37 10.45
€50,000 - €59,999 per annum 16 4.52
€60,000 - €69,999 per annum 6 1.69
€70,000 - €79,999 per annum 2 0.56
€80,000 - €89,999 per annum 0 0
€90,000 - €99,999 per annum 0 0
€100,000+ per annum 1 0.28
[image:27.595.85.360.266.489.2]27
Table 5: Factors related with farmers’ life satisfaction– results from ordered
logistic regression
b z % %Std
X
SDof X
Age *** -0.2 -2.7 -16.0 -89.6 13.0
Age squared *** 0.0 2.8 0.2 934.5 1463.0
Male 0.0 0.1 4.2 1.4 0.3
Education 0.2 0.3 19.9 3.6 0.2
Relationship status *** 0.6 2.0 87.4 29.0 0.4
Farm income *** 0.0 2.8 0.0 45.2 17099
Farm size 25-49 ha under 25 ha is the reference category)
0.3 1.2 41.9 18.7 0.5
Farm size 50-74 ha -0.1 -0.4 -12.3 -4.9 0.4
Farm size 75-100 ha *** 0.9 2.0 150.3 29.7 0.3
Farm size 100-150 ha -0.5 -0.7 -38.1 -7.3 0.2
Farm size 150 plus ha * 1.6 1.8 374.7 24.3 0.1
Dairy farmers 0.0 0.1 4.7 1.5 0.3
Successor -0.1 -0.5 -11.7 -6.0 0.5
Debt high (no farm debt is the reference category) ***
-1.2 -3.0 -70.6 -34.1 0.3
Debt low -0.1 -0.4 -9.3 -4.8 0.5
Financial situation is neither good nor bad (fairly bad or very bad is the reference category) ***
2.3 4.9 941.5 200.8 0.5
Financial situation is good or very good ***
2.8 5.8 1623.
3
308.0 0.5
Off farm job* 0.5 1.6 57.9 22.0 0.4
Very good health *** 1.7 3.9 455.0 120.4 0.5
Good health *** 0.9 2.7 149.3 58.0 0.5
EQ VAS ** 0.0 2.1 2.3 35.6 13.2
Farming risk aversion ** -0.4 -2.9 -32.0 -29.6 0.9
28
Table 6: Factors related with farm income – results from ordinary least squares
regression analysis
Coef. Std. Err.
t
Age 178 428 0.4
Age squared -1 4 -0.3
Male 205 2354 0.1
Education *** -12270 4058 -3.0
Relationship status 3193 2059 1.6
Farm size 25-49 ha under 25 ha is the reference category) ** 4891 2003 2.4
Farm size 50-74 ha *** 10651 2491 4.3
Farm size 75-100 ha *** 13322 3136 4.3
Farm size 100-150 ha * 9206 5034 1.8
Farm size 150 plus ha *** 22524 5924 3.8
Dairy farmers *** 7686 2432 3.2
Successor *** -4426 1606 -2.8
Debt high (no farm debt is the reference category) ** 6655 2769 2.4
Debt low ** 4569 1903 2.4
Financial situation is neither good nor bad (fairly bad or very bad is the reference category)
-3183 2917 -1.1
Financial situation is good or very good 686 2922 0.2
Off farm job -1105 1907 -0.6
Very good health *** 10513 2851 3.7
Good health 1878 2269 0.8
EQ VAS -40 75 -0.5
Farming risk aversion ** -1910 885 -2.2
N = 354 R² = 0.38