This is a repository copy of
Tracking resource use relative to planetary boundaries in a
steady-state framework: A case study of Canada and Spain
.
White Rose Research Online URL for this paper:
http://eprints.whiterose.ac.uk/100774/
Version: Accepted Version
Article:
Fanning, AL and O'Neill, DW orcid.org/0000-0002-0790-8295 (2016) Tracking resource
use relative to planetary boundaries in a steady-state framework: A case study of Canada
and Spain. Ecological Indicators, 69. pp. 836-849. ISSN 1470-160X
https://doi.org/10.1016/j.ecolind.2016.04.034
[email protected] https://eprints.whiterose.ac.uk/ Reuse
Unless indicated otherwise, fulltext items are protected by copyright with all rights reserved. The copyright exception in section 29 of the Copyright, Designs and Patents Act 1988 allows the making of a single copy solely for the purpose of non-commercial research or private study within the limits of fair dealing. The publisher or other rights-holder may allow further reproduction and re-use of this version - refer to the White Rose Research Online record for this item. Where records identify the publisher as the copyright holder, users can verify any specific terms of use on the publisher’s website.
Takedown
If you consider content in White Rose Research Online to be in breach of UK law, please notify us by
Tracking resource use relative to planetary boundaries in a steady-state framework: A case study of Canada and Spain
Andrew L. Fanninga,b,* and Daniel W. O'Neillb,c
a Faculty of Marine and Environmental Sciences, University of Cádiz, Polígono Río San Pedro s/n, Puerto Real, 11510, Cádiz, Spain
b Center for the Advancement of the Steady State Economy, 5101 S. 11th St., Arlington, VA 22204, USA
c Sustainability Research Institute, School of Earth and Environment, University of Leeds, Leeds, LS2 9JT, UK
Tracking resource use relative to planetary boundaries in a steady-state framework: A case study of Canada and Spain
Abstract
There is a growing understanding of the biophysical processes that regulate the stability of the Earth-system, yet human pressures on the planet continue to increase rapidly. Here, recent advances in defining Earth-system thresholds using the planetary boundaries framework are translated down to national and sub-national levels. A set of 10 indicators is developed in a biophysical accounting framework that links the sustainability of resource flows from the biosphere to final consumption. The indicator set includes three measures of physical stocks, three measures of aggregate resource consumption, and four indicators of sustainable scale. The four scale indicators are ratios of (i) cumulative carbon footprint relative to carbon budget, (ii) nutrient use relative to biogeochemical boundaries, (iii) blue water consumption relative to monthly basin-level availability, and (iv) land footprint relative to biocapacity. Taken together, the indicators measure how close high-consuming societies are to meeting the conditions of a “steady-state economy”, defined here as an economy with non-growing physical stocks and flows maintained within shares of planetary boundaries. The
framework is applied over a 15-year period to the economies of Canada and Spain, along with two sub-national regions (Nova Scotia and Andalusia). Nova Scotia is the only study site experiencing stable or decreasing biophysical stocks and flows. None of the study sites are consuming resources within their shares of all four planetary boundaries. Overall, the set of indicators provides guidance for prioritizing which environmental pressures need to decline (and by how much) for societies to be more effective stewards of Earth-system stability.
Keywords: planetary boundaries, environmental footprints, steady-state economy, indicators, input-output analysis
Highlights:
Indicators are applied to assess how close 4 regions are to a steady-state economy Planetary boundaries are translated to national and sub-national levels
Input-output analysis is used to estimate consumption-based environmental footprints None of the regions fulfill the conditions of a true steady-state economy
1. INTRODUCTION
There is convincing evidence that humanity's central role in geology and ecology has ushered in a new epoch, the Anthropocene, whereby our activities are already pushing the Earth-system rapidly into a “less biologically diverse, less forested, much warmer, and probably wetter and stormier state” (Steffen et al., 2007: 614). Rockström et al. (2009) define planetary boundaries for nine Earth-system processes whose transgression risks altering the planet's remarkably stable Holocene-like state of the past ~10,000 years. Maintaining the Earth-system in Holocene-like conditions is desirable because these are the only conditions that are known with certainty to be capable of supporting modern society.
The planetary boundaries framework has been the subject of considerable attention and debate from both scientific and policy perspectives. From a scientific viewpoint, Steffen et al. (2015) provide a revised update to the boundaries framework that incorporates specific inputs from
researchers along with more general advances in Earth-system science over the past six years. From a policy point of view, one of the main obstacles impeding the application of the planetary boundaries framework in national and/or regional development planning is that the boundaries were not designed to be “disaggregated” to smaller levels (Ibid). However, there is a need to translate the alarming evidence from Earth-system science to national and sub-national levels where the governance of natural resources predominantly takes place.
To date, there are only a few studies that utilize “planetary boundary thinking” to define
ecological boundaries at lower levels. The planetary boundaries framework (i) identifies key processes that regulate Earth-system stability, (ii) chooses appropriate control variables to measure these
processes, (iii) attempts to define the range of uncertainty within which a threshold effect could occur, and finally (iv) proposes a boundary on the lower bound of uncertainty based on the precautionary principle (Rockström et al., 2009).
A bottom-up approach to defining national or sub-national ecological boundaries maintains the four-step logic of the original planetary boundaries framework but adapts the first and/or second steps to fit the scope of the analysis in question. Dearing et al.'s (2014) case study of two Chinese localities is a bottom-up analysis that defines ecological processes and control variables based wholly on local environmental conditions within the case study sites. A top-down approach, on the other hand, adheres strictly to the Earth-system processes and control variables defined at the planetary level, while attempting to disaggregate them to lower levels. Nykvist et al. (2013) use a top-down approach to attribute and compare national shares of four disaggregated planetary boundaries (climate change, freshwater use, land-system change, and nitrogen) across 61 countries. In a South African case study, Cole et al. (2014) apply an interesting mix of both top-down and bottom-up approaches, depending on whether the specific environmental dimension is characterized as a global boundary, a national limit or a local threshold.
The present article contributes to the nascent literature seeking to define maximum sustainable thresholds for national and sub-national resource use based on shares of global Earth-system
boundaries. Like Nykvist et al. (2013), we adopt a top-down approach in order to compare the national and sub-national biophysical performance of high-consuming societies relative to their respective shares of planetary boundaries. We track four indicators of environmental pressure relative to disaggregated planetary boundaries: (i) cumulative carbon footprints relative to carbon budgets, (ii) nutrient use (nitrogen and phosphorus) relative to biogeochemical boundaries, (iii) blue water
physical size of the economy on our finite planet. Here, we define a steady-state economy as an economy with constant population and constant stock of physical capital, maintained by a low rate of throughput that is within safe boundaries of intrinsic biophysical processes that regulate the stability of the Earth-system.
The main objective of our analysis is to develop and apply an integrated biophysical accounting framework that incorporates the safe operating space of the planetary boundaries framework explicitly into the measurement of steady-state economies. The idea that voluntarily transitioning from a growth-based economy to a steady-state would be a desirable goal for society dates back to the classical economist John Stuart Mill (1848). That being said, O'Neill (2015a) provides the only analysis to our knowledge that estimates national economy-wide trends in physical stocks and material/energy flows with the intent of explicitly measuring their proximity to the steady-state conditions of sustainable scale and biophysical stability.
A set of 10 indicators is developed here in a biophysical accounting framework that links resource flows from the biosphere to the scale of the production of goods and services for final
consumption. Accompanying the four indicators of sustainable scale described above, the indicator set also includes three measures of change in physical stocks (population, livestock and built capital) and three measures of change in flows of aggregate resource consumption (energy, material and blue water). The latter group of consumption-based footprint indicators are estimated using environmental input-output analysis. We apply the biophysical accounts to four case study sites to evaluate and compare the sustainability of physical stocks and material/energy flows with respect to shares of planetary boundaries. The analysis integrates insights from the planetary boundaries framework (Rockström et al., 2009; Steffen et al., 2015), steady-state economics (Daly, 1977; O'Neill, 2012) and environmental input-output analysis (Wiedmann et al., 2007; Miller and Blair, 2009).
Comparable biophysical accounts are compiled for four case study sites over a 15-year time period (1995-2009). The sites include two nations (Canada and Spain) and two sub-national regions (Nova Scotia and Andalusia). The national sites were chosen because Canada and Spain are both high-consuming countries with large environmental footprints, but they have followed significantly different development paths. Nova Scotia and Andalusia were chosen as sub-national case studies for two reasons. First, an empirical assessment of sub-national regions' proximity to a steady-state economy has not yet been attempted. Second, Nova Scotian and Andalusian performance is below their respective national averages in conventional economic indicators (i.e. gross domestic product) so we were interested to see if this finding would also be reflected in our analysis of physical stocks, flows and scale of economic activities.
The remainder of the article is structured as follows. Section 2 presents the biophysical accounting framework and environmental input-output model used to estimate the indicators of environmental pressure for each site. Section 3 describes the development of the stock, flow and scale indicators at national and sub-national levels. Section 4 reports the results including a
comparative analysis that highlights the performance of each case study site in relation to steady-state conditions and describes the reductions in resource use needed to achieve a steady-state economy. Section 5 discusses implications of the results, limitations of the analysis and ideas for further research. Section 6 concludes.
2. BIOPHYSICAL ACCOUNTS AND ENVIRONMENTAL INPUT-OUTPUT MODEL
In this section, we begin by presenting the conceptual framework used to link (i) changes in economy-wide biophysical stocks and flows, and (ii) the sustainability of environmental pressures known to impact key Earth-system processes. Next, we discuss the construction of the environmental input-output (EIO) model that was used in this study.
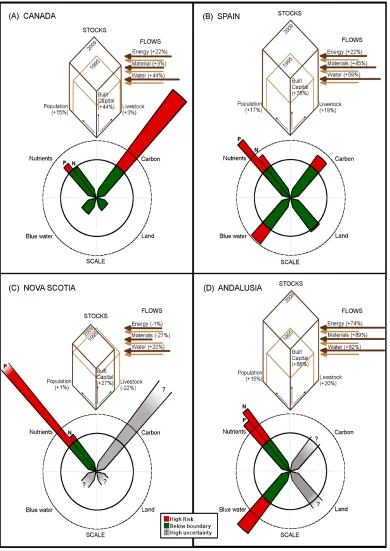
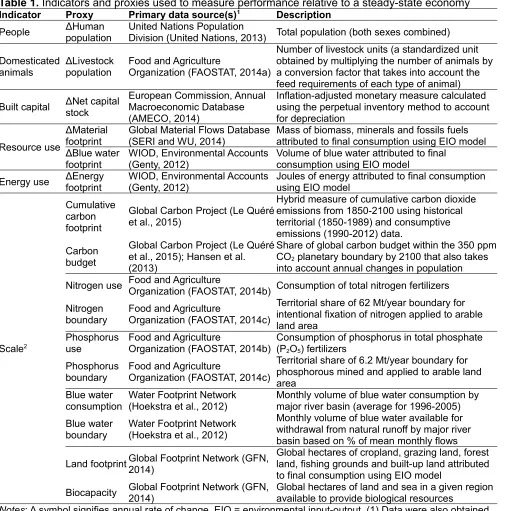
The biophysical accounts are organized following the method discussed in detail by O'Neill (2012) which is, in turn, based on Herman Daly's (1977) Means framework. In Daly's Ends-Means framework, items are organized hierarchically from ultimate means (the capacity of the environment to provide useful sources of matter-energy, and sinks to assimilate useless wastes) to intermediate means (the stocks of people, domesticated animals and built capital that transform flows of low-entropy matter-energy into goods and services) to intermediate ends (the social goals that the economy is expected to provide) to the ultimate end (that highest goal desired only for itself). The biophysical accounts described here measure the use of the means in the bottom two rungs of the Ends-Means hierarchy, whereas a separate set of social accounts would measure progress towards the ends in the top tiers (O'Neill, 2012). Figure 1 summarizes the set of biophysical indicators tracked in this study and Table 1 provides more detail, including primary data sources (see Section 3 for specific methods used to develop each indicator).
The biophysical accounts can also be described in terms of the causative Driver-Pressure-State-Impact-Response (DPSIR) framework used by the European Environment Agency. Within this framework, environmental pressures exerted by society are defined as the “release of substances (emissions), physical and biological agents, the use of resources and the use of land by human activities [...whereas impacts...] are only those parameters that directly reflect changes in
environmental use functions by humans” (Gabrielsen and Bosch, 2003:8). The benefit of tracking performance in relation to steady-state economy conditions is on measuring progress towards
stabilizing environmental pressures within planetary boundaries. Once environmental pressures have been stabilized, humanity's proven creativity and ingenuity for avoiding or mitigating the environmental impacts of those pressures can be effective. As O'Neill (2015b) argues, the question of what to do about the impacts caused by the environmental pressure from any particular material outflow lies within the domain of conventional environmental policy, which will certainly still be necessary in a steady-state economy.
There is one difference between Figure 1 and the biophysical accounts proposed by O'Neill (2012: Figure 4) that is worth noting. In this study, a single 'Resource Use' indicator is suggested rather than two separate flow indicators tracking 'Material Inflows' and 'Material Outflows'. In essence, this modification drops outflows from the conceptual framework. If the societal response of
transitioning to a steady-state economy is successful in reducing pressures on the environment by limiting the quantity of aggregate material inflows, then logically it must also reduce environmental pressures caused by the quantity of aggregate material outflows. That being said, there certainly is a case to be made for tracking those specific material outflows known to impact the resilience of the Earth-system, which we attempt to do using indicators of sustainable scale, as shown in Figure 1 and discussed in Section 3.3.
2.2 Environmental input-output (EIO) model
A basic premise of this research is that the ultimate responsibility for the environmental pressures created by economic activity lies with the consumers who benefit from that activity, regardless of where those environmental pressures take place. In practice, a consumption-based approach measures the environmental pressures embodied in goods and services produced or imported within a region, while excluding the pressures associated with exports. In this study, the flow indicators (energy, material, and blue water footprints) and the land footprint are estimated using environmental input-output (EIO) analysis. The EIO method is particularly relevant in a world of international trade because it can account for the total upstream environmental pressures created throughout production processes, no matter where they occur, and allocate them to the economy where final consumption takes place (Wiedmann et al., 2015).
2009). The assumptions and limitations of the EIO method are discussed thoroughly in the literature so they will not be covered in detail here (see Miller and Blair 2009 for an in-depth and accessible discussion). The unique benefit of the EIO method is that it provides a snapshot of all inter-industry transactions throughout the entire supply chain, which allows total upstream resource flows associated with the production of both domestic and foreign goods to be allocated to final demand.
One of the major empirical uncertainties in EIO analysis is related to the estimation of
resource/emissions intensities in traded goods (Druckman et al., 2008). A multi-regional input-output (MRIO) model linking our national and sub-national case study sites with each other and the rest of the world is the theoretically preferred approach (Miller and Blair, 2009; Tukker and Dietzenbacher, 2013). However, such a model that spans administrative levels (i.e. national and sub-national) does not currently exist and the data- and resource-intensive development of a MRIO was beyond the scope of this study. Instead, we attempt to differentiate between environmental pressures generated domestically and abroad by extending the two-region environmental input-output model for carbon emissions described by Jackson et al. (2007: 29-34). We use this model to attribute to final demand the flow indicators outlined in Figure 1 for each of the four study sites. This method uses the “domestic technology assumption” and applies the same resource/emissions intensities to imported goods as domestic goods in a two-region framework. Each site is analyzed separately so the two regions in the model include the site under consideration and the rest of the world.
For our two national case studies, comparable annual time series of national input-output tables from 1995-2009 for 40 countries (including Canada and Spain) were publicly available at 35-sector resolution from the World Input-Output Database (WIOD). Comparable data for the two sub-national case studies (Nova Scotia and Andalusia) were estimated by adapting their respective national input output tables by the proportion of sub-national final demand supplied by sub-national domestic industries using data from national statistics agencies. Details of the national and sub-national two-region EIO models are provided in the Supplementary Information.
3. INDICATORS OF BIOPHYSICAL STOCKS, FLOWS AND SCALE
In two previous articles, O'Neill (2012; 2015a) discusses the rationale for including the idealized indicators and available proxies outlined in Figure 1. This section discusses the main
challenges encountered when adapting several of the specific proxies to our case studies, EIO model and the planetary boundaries framework. Table 1 outlines the full set of indicators, proxies and primary data sources used in this study.
3.1 Stocks
In a steady-state economy, stocks of people, domesticated animals and built capital would be roughly constant with population birth rates equal to death rates, and new investment equal to depreciation of the built capital stock (Daly, 1977). Human population and livestock totals were
obtained from UN sources and national statistics agencies. However, annual data on the stock of built capital in physical units were not available for any of the case study sites.
As a proxy for the rate of change of the built capital stock, we used an annual monetary
measure – net capital stock at constant (2010) prices – reported for both countries over the 1995-2009 period in the European Commission's Annual Macro-economic Database (AMECO, 2015). This variable is calculated using the perpetual inventory method. It accounts for depreciation in the capital stock, as well as inflation. To ground-truth this monetary data source, we used linear regression to correlate annual accumulation in the AMECO net capital stock measure with results from Matthews et al. (2000), who have calculated economy-wide net additions to stock in physical terms for five
no correlation between the AMECO monetary data and the Matthews et al. (2000) physical data; the reason for this finding is not clear given the high degree of correlation for the other countries. Overall, the average correlation across all five countries was reasonably high (R2=0.61) leading us to conclude the monetary AMECO data may be an acceptable proxy for measuring rates of change in the physical stock of built capital.
For Nova Scotia, we estimated the annual time series of net capital stock by multiplying the AMECO data for Canada by the provincial share of total net residential and non-residential stocks from 1995 to 2009, as reported in monetary terms by Statistics Canada (2015a,b). Similarly for Andalusia, we multiplied the AMECO total for Spain by the regional share of Andalusian net capital stock in Spain as reported in BBVA and Ivie (2014).
3.2 Flows
In a steady-state economy, rates of change of energy, materials and water would be either stable or declining (due to efficiency gains) corresponding to the minimum levels required to maintain constant stocks. Energy and blue water data by sector were obtained from the WIOD Environmental Accounts (Genty et al., 2012). The only change made to the WIOD data was to remove, for both countries, the quantity of blue water associated with the “Electricity, gas and water supply” sector due to evaporation from hydroelectric reservoirs. This quantity was removed to ensure consistency with our scale indicator relating blue water consumption to availability (see Section 3.3.4).
In order to estimate material footprints for Canada and Spain from 1995-2009, we obtained domestic extraction data (biomass, fossil fuels, industrial & construction minerals and metal ores) from the Global Material Flows Database compiled by SERI and WU (2014). We then associated the totals for each material flow category from the Global Material Flows Database with a WIOD industrial sector. Biomass was associated with the “Agriculture, Hunting, Forestry and Fishing” sectors of each country with no issues. However, we encountered an aggregation issue when attempting to associate the domestic extraction of the three categories of non-renewable material flows with the WIOD's highly aggregated “Mining and Quarrying” sector.
The relationship between the mining and quarrying sector to final demand in the WIOD was too broad to accurately capture the flows of less-aggregated material categories in our case study sites. In Canada, the mining and quarrying sector exported roughly half of the value of its total output most years whereas Spain was generally an importer of non-renewable raw materials. It does not follow, however, that the same proportions of fossil fuels, industrial & construction minerals and metal ores are imported and/or exported by each country. For both nations, for example, the relatively low-value flows of industrial and construction minerals generally produced and consumed domestically are dominated by the trade flows of fossil fuels and metal ores. We corrected the aggregation bias by associating country-specific shares of the total of each non-renewable material category with the mining and quarrying sector and another constant share with each material category’s largest domestic purchaser (see Table 2).
3.3 Scale
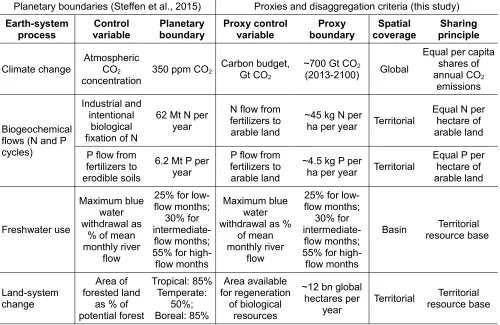
Second, only climate change, ocean acidification and stratospheric ozone depletion are truly global boundaries where a strong argument can be made for disaggregation across nations based on per capita shares. The remaining six boundaries are aggregations of critical sub-global processes (Rockstrom et al., 2009). Due to the spatial heterogeneity of the sub-global processes, there is more ambiguity concerning the question of how to disaggregate them using a top-down approach. The two main options are to apply (i) equal per capita shares or (ii) territorial shares. Table 3 summarizes the planetary boundary control variables along with the proxy indicators and disaggregation criteria used in this study.
The remainder of this section describes the methods used to relate national and sub-national footprints for carbon, nutrients, blue water and land to maximum sustainable quotas for our case study sites, drawing heavily on the planetary boundaries literature.
3.3.1 Ratio of carbon footprint to carbon budget
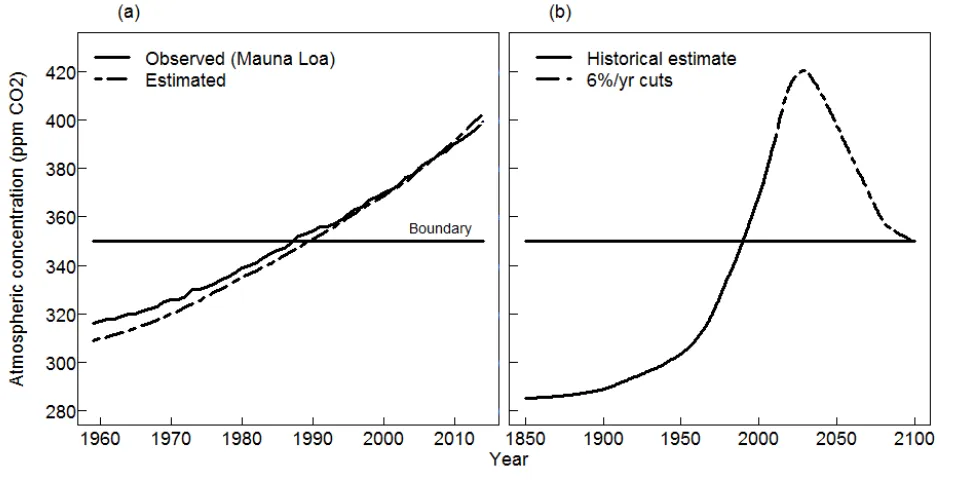
The planetary boundary for climate change proposed by Steffen et al. (2015) is for an atmospheric concentration of carbon dioxide (CO2) below 350 parts per million (ppm). In order to calculate shares of the 350 ppm planetary boundary for our case study sites, we developed a novel method that relates cumulative carbon footprints to carbon budgets, taking into account carbon uptake by ecosystems. Cumulative emissions are attractive indicators for a number of reasons, not least of which because they can be converted directly into atmospheric CO2 concentrations as long as carbon sequestration by terrestrial and marine ecosystems is taken into account (Allen et al., 2009; Frame et al., 2014).
To enable direct comparison between historical cumulative emissions and the atmospheric concentration of CO2, we accounted for carbon uptake by ecosystems using an approach based on the Bern carbon cycle model (Kharecha and Hansen 2008; Hansen et al. 2013). We used the static-sink pressure-response function from Kharecha and Hansen (2008: 4) to estimate the proportion of CO2 remaining in the atmosphere from its emission to year t. The function implies that approximately half of CO2 emitted in any given year will have been removed from the atmosphere 25 years later, but a third will still remain after 100 years and roughly a quarter will be in the atmosphere after 250 years. We began our analysis of cumulative emissions in 1850, and ran it to 2100. Following Hansen et al. (2013), a global emissions reduction pathway to achieve a concentration of 350 ppm CO2 by 2100 was defined with cuts to fossil fuel emissions of 6% per year beginning in 2016, along with ambitious reforestation efforts that capture ~90 Gt C. This emissions pathway yields a global carbon budget of ~700 Gt CO2 between 2013 and 2100. Historical global emissions data were obtained from Boden et al. (2013), updated in Le Quéré et al. (2015). The static-sink pressure-response function from Kharecha and Hansen (2008) was then applied recursively to the global emissions data and the results were integrated from 1850 to 2100. An initial (year 1850) concentration of 285.2 ppm CO2 was used. We assumed that fossil fuel emissions contributed a constant 85% of annual CO2 emissions and estimated land use change emissions as a residual for each year.
Figure 2a compares a sub-set of our estimated atmospheric concentration of CO2 during the industrial era (1850-2100) with available data from the Mauna Loa observatory (Tans, 2015), and shows good agreement between the two. Figure 2b replicates Hansen et al.’s (2013) finding showing the effect of an annual 6%/year cut beginning in 2016.
data were used for the initial period due to a lack of consumption-based data. Since the most recent years are more important given the decreasing relevance of past CO2 emissions due to carbon uptake by ecosystems, our method provides the closest approximation available for cumulative carbon footprints over the entire period. We note that the data obtained from Le Quéré et al. (2015) should be considered an underestimate as they do not include CO2 emissions related to international aviation and maritime transport.
The final step required to estimate the scale ratio for carbon was to estimate national carbon budgets. Central to the idea of a carbon budget lies the concept of a right to emit CO2. Following Yu et al. (2011), the distributive criterion used was that each person, in any country and in any year, holds the right to emit a quantity of CO2 emissions equivalent to global per capita emissions for that year. According to this criterion, national carbon budgets have to take into account annual variability in global emissions, the global population and the national population over the applicable period (1850-2100, in our case). Having defined (i) the time period, (ii) a global emissions pathway that accounts for carbon uptake by ecosystems, and (iii) a distributive criterion, we calculated national carbon quotas for each year as follows:
(1)
where
t
ran from 1850 to 2100.E
i(t)
is the annual quota of CO2 emissionsE
for regioni
in yeart
, whereasE(t)
is the annual global emissions for the same year.P(t)
andP
i(t)
are human populations in yeart
for the world and regioni
, respectively.We calculated the carbon budgets for Canada and Spain from 1850 to 2100 in two steps. First, for each year, every person on the planet was allocated an equal right to emit a quantity of CO2 that was equivalent to that year's global per capita emissions, or
E(t)/P(t)
. Each country’s emissions quota for any year was then equal to the annual per capita emissions allocation multiplied by regioni
's population in the same year,P
i(t)
. In the second step, we applied the static-sink pressure-response function from Kharecha and Hansen (2008) recursively to the annual emissions quotas and integrated the results to yield carbon budgets for Canada and Spain over the 1850-2100 period. We were then able to calculate the scale indicator for CO2 emissions as the ratio of cumulative footprints to budgets. This equal per capita approach accounts for annual variability in regional population dynamics as well as changes in global emissions and carbon uptake by ecosystems.3.3.2 Ratio of nutrient use to biogeochemical boundaries
Due to the high industry aggregation in the WIOD input-output tables, along with the domestic technology assumption for imported products, our EIO model was too coarse to adequately attribute the economy-wide flows of nitrogen and phosphorus consumption to final consumers. Instead, following Nykvist et al.'s (2013) method, we use annual time series of N and P2O5 fertilizer
consumption for Canada and Spain obtained from FAOSTAT (2014b). Although this method does account for international trade in fertilizers, the nutrients embodied in the trade of final agricultural products are not captured. For Nova Scotia, we approximated fertilizer consumption based on
territorial shares of cropland using aggregated data available for the four Atlantic provinces (Statistics Canada, 2015c,d). Andalusian fertilizer data were obtained from the Spanish Ministry of Agriculture, Food and Environment. P2O5 consumption was multiplied by the atomic mass share of P (0.436) to isolate the quantity of reactive phosphorus.
Steffen et al. (2015) estimate the planetary boundary for industrial and intentional biological fixation of nitrogen as 62 Mt/year. For phosphorus, a planetary boundary of 6.2 Mt/year of phosphorus mined and applied to erodible (agricultural) soils is proposed. These boundaries are relatively straight-forward to disaggregate by either (i) global population or (ii) total arable land area. A land-area
Ei(t)=
(
E(t)
boundary is arguably more appropriate for the biogeochemical processes because their impacts are felt primarily at the local/regional scale. We divided the planetary boundaries for N and P by the global total of arable land area (~1.4 billion ha) obtained from FAOSTAT (2015) to yield uniform annual boundaries of 45 kg N/ha and 4.5 kg P/ha. These uniform per hectare boundaries for N and P were then multiplied by the national arable land area of Canada and Spain that was also obtained from FAOSTAT (2015). For Nova Scotia and Andalusia, we followed the same procedure except sub-national arable land areas were calculated by multiplying the sub-national totals obtained from FAOSTAT (2015) by their respective shares of arable land area collected from national statistics agencies. The final biogeochemical scale indicators were calculated as the ratio of nitrogen use and phosphorus use compared to their respective disaggregated boundaries.
3.3.3 Ratio of blue water consumption to availability
In recognition of the fact that blue water available for consumption varies substantially by region and throughout the year, we obtained monthly data by major river basin from Hoekstra et al. (2012). A downside to this approach is that, to the best of our knowledge, there are no monthly data at the basin level that account for the blue water embodied in trade. Blue water consumption refers to the volume of surface water or groundwater withdrawn from the basin that is not returned because it evaporated or was incorporated into a product (Ibid). Data were collected on average blue water consumed over the 1996-2005 period for five major river basins in Canada (Fraser, Nelson, Saguenay, St. Lawrence and St. John) and five in Spain (Ebro, Duero, Tagus, Guadiana and Guadalquivir). The five Canadian rivers collectively contribute ~99% of Canada's territorial blue water consumed. We were unable to quantify the scale of blue water consumption in Nova Scotia due to a lack of data. Andalusian blue water consumption was attributed to the Guadalquivir river basin.
The blue water boundary was estimated in two steps. First, natural runoff data for each of the selected basins were obtained from the Hoekstra et al. (2012) dataset. Second, Steffen et al. (2015) endorse a basin-level boundary for maximum blue water withdrawal that takes into account the environmental flow requirements of ecosystems and varies by flow regime. This variable boundary, which is based on Pastor et al. (2014), was set to (i) 25% of the natural runoff during low-flow months, (ii) 30% during intermediate-flow months, and (iii) 55% during high-flow months.
Ratios of monthly blue water consumption relative to availability were calculated for each of the major river basins included in our analysis. The scale indicator sums the number of months per year that monthly blue water consumption exceeds availability, averaged across river basins flowing within/through the region. Finally, we set the river basin boundary to be outside the safe zone if water consumption exceeded availability more than three months in a year. The proposal for a boundary at three months was based on the observation that a majority of the major rivers in the Hoekstra et al. (2012) dataset experience at least one month of water scarcity (largely due to climate variability). 3.3.4 Ratio of land footprint to biocapacity
Annual land footprint data for Canada and Spain were obtained from the 2014 version of the National Footprint Accounts compiled by the Global Footprint Network (GFN, 2014). Based on the method used by Wiedmann et al. (2006), we estimated consumption-based land footprints for our national and sub-national case studies using EIO analysis. Total land area appropriated for production (disaggregated by land type) from the National Footprint Accounts was associated to WIOD industrial sectors in each site. Cropland, grazing land, forest land and fishing grounds were associated entirely with the “Agriculture, Hunting, Forestry and Fishing” sector, with the exception of a small portion of forest land (~1%) related to the final household consumption of fuelwood. The relatively small built-up land category was associated completely with final demand due to a lack of comparable data on the land area occupied by industrial infrastructure.
The National Footprint Accounts also estimate maximum sustainable thresholds for land footprints based on the capacity for biological resources to regenerate (i.e. biocapacity). Annual global biocapacity can be disaggregated relatively simply using either an area-based or a population-based approach. As with the biogeochemical boundaries (Section 3.3.2), we distributed biocapacity shares across our case study sites by territorial land area. Our final scale indicator was calculated as the ratio of land footprints estimated using EIO analysis relative to territorial biocapacity totals obtained from GFN (2014).
4. RESULTS
4.1 Overall findings
Based on the indicators tracked in the biophysical accounts, the steady-state economy conditions imply that (i) biophysical stocks and flows must be non-growing over timeand (ii) carbon, nitrogen, phosphorus, blue water and land must be kept within shares of planetary boundaries. The most general observation from the results (summarized in Figure 3) is that none of the case studies fulfill the steady-state economy criteria over the 1995-2009 analysis period.
As illustrated in Figure 3, rates of change of stock and flow indicators are highest in Andalusia, followed by Spain and then Canada. In these three regions, we find unambiguous growth in physical stocks and material/energy footprints. The boundaries for biogeochemical flows and especially carbon are being transgressed in Canada, whereas all four boundaries are being transgressed in Spain (and likely Andalusia). Nova Scotia seems to be the only region moving towards a biophysically stable state by demonstrating ambiguous growth trends in stocks and flows, though our results suggest that at least the nutrient boundaries have been transgressed (Figure 3; Table 5). Additionally, although we were unable to quantify a sub-national carbon boundary, there is good reason to believe that it has also been transgressed in the Nova Scotian case, given that consumption habits and standard of living are similar to the rest of Canada.
4.2 Rate of change of stocks and flows
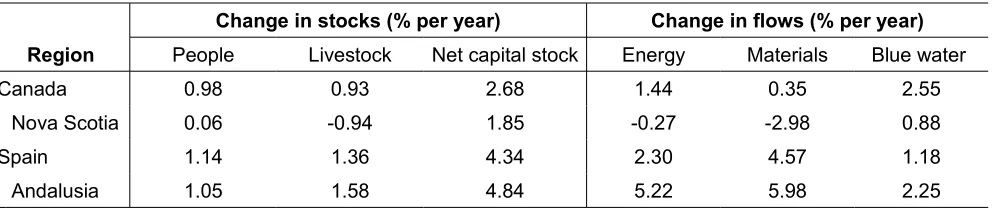
A steady-state economy calls for stable stocks of people, livestock and built capital. There are no physical reductions required to fulfill the steady-state criterion of constant stocks, by definition. It may be the case, though, that the other steady-state criterion – i.e. keeping material/energy flows within levels that respect Earth-system boundaries – makes it impossible or undesirable to maintain existing stocks. Table 4 reports positive growth rates in all three stock indicators for three of the four regions (Canada, Spain, and Andalusia). The situation in Nova Scotia is different, where population is relatively stable and livestock numbers are decreasing. The highest growth rates in all four regions are for built capital, which is increasing at between 2 and 5% per year.
blue water footprints are growing at 1.5% and 2.5% per year, respectively. In Spain, all of the flow indicators are growing, and they are increasing particularly dramatically in Andalusia. For example, the Andalusian energy and material footprints have growth rates greater than 5% per year. At this rate, material and energy use in Andalusia would double in less than 14 years.
4.3 Scale relative to planetary boundaries
The most general finding from our analysis of scale, as shown in Figure 3 and Table 5, is that resource use in all of the case study sites is transgressing shares of Earth-system capacity to
assimilate excess carbon, nitrogen and phosphorus. We find the sustainability of land and blue water consumption, on the other hand, to be dependent on region-specific endowments of these resources across the case study sites. This section describes the results for each of the four scale indicators in more detail.
4.3.1 Carbon footprints relative to carbon budgets
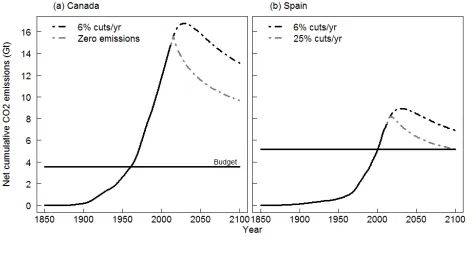
Figure 4 presents the cumulative emissions of Canada and Spain (net of carbon uptake by ecosystems) from 1850 to 2100 along with their respective carbon budgets. Canada's carbon budget is roughly two-thirds of Spain's due to differences in population dynamics over the 1850-2100 period. Canada had a small population size in 1850 (~20% of Spain's population) but is projected to overtake Spain around 2060, during the period when annual additions to global cumulative emissions must be declining in absolute terms. Thus, the historical and projected Canadian population dynamics lead to the situation where Canada receives a smaller share of the right to emit CO2 relative to Spain at the beginning of the period, and a larger share of the responsibility to cut emissions at the end.
Our estimates suggest that the Canadian economy has already emitted four times more CO2 than its entire cumulative budget up to the year 2100. This means Canada would not be within its share of the planetary boundary by 2100 even if all CO2 emissions from fossil fuels and land use change were stopped immediately, due to the time required for past emissions to be cycled out of the atmosphere (Figure 4a). The Spanish economy transgressed its entire estimated carbon budget around the year 2000, which is much more recent than Canada (ca. 1960). As shown in Figure 4b, the annual carbon footprint in Spain needs to decrease by 25% per year beginning in 2016 to be within the equitable carbon budget by end-century. Some implications of these rather striking findings are discussed further in Section 5.2.
At the sub-national level, it was not possible to estimate cumulative carbon budgets for Nova Scotia or Andalusia so, in the absence of evidence to the contrary, we have assumed ratios similar to their national counterparts (see Figure 3).
4.3.2 Nutrient use relative to biogeochemical boundaries
The application of nitrogen and phosphorus in fertilizers exceeds territorial area-based shares of the biogeochemical boundaries for all case study sites, with the exception of Canada's nitrogen use (which is using virtually all of its share). Nova Scotia's nitrogen use would need to decline by 20% to avoid transgressing its share, whereas the application of phosphorus needs to be reduced by more than 70%. Nitrogen and phosphorous use both decreased in Spain and Andalusia over the analysis period, though they still need to decline another ~30-50% in order to be within their share of the biogeochemical boundaries. Canadian phosphorus use needs to decline by 20% from current levels to be within the biogeochemical boundary.
It is worth noting that the results for Canada are particularly sensitive to the choice of disaggregation criteria due to its large arable land area and relatively small population. For
shares of the boundaries (results not shown).
4.3.3 Blue water consumption relative to availability
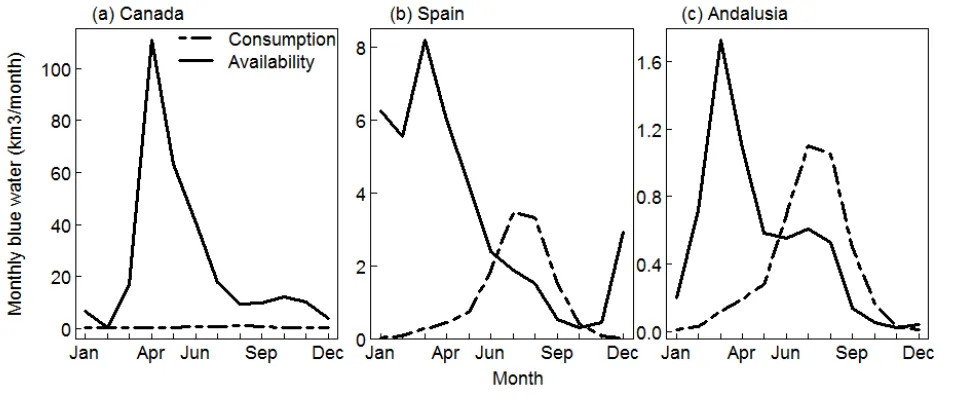
Figure 5 compares average monthly blue water consumption and availability (i.e. natural runoff minus environmental flow requirement) over the 1996-2005 period for Canada, Spain and Andalusia. According to our estimates, Canadian blue water consumption exceeds availability ~1.5 months of the year, on average. As shown in Figure 5a, the reason for this is that blue water availability drops in February and March because the majority of Canadian rivers are frozen over. This seasonal variability is not, in our view, indicative of water scarcity and is a primary reason for proposing a boundary based on exceeding availability for more than three months of the year (as discussed in Section 3.3.3). It was not possible to estimate the water scarcity ratio for Nova Scotia due to a lack of data, so Figure 3 displays an uncertain ratio for this region based on the Canadian value.
Spain's blue water consumption, on the other hand, exceeds availability by more than four months of the year on average, whereas Andalusia spends six months of the year in a situation of water scarcity (Figures 5b and 5c). Our findings indicate that blue water consumption during the low-flow months in Spain (July-October) needs to decline by 30-65%, depending on the month, to be within the boundary. In Andalusia, the situation is more extreme with monthly blue water consumption needing to decrease by 20-70%, depending on the month, between June and November (see Section 5.3 for a discussion).
4.3.4 Land footprints relative to national biocapacity
Although the average per capita land footprint in Canada is larger than in Spain (4.3 versus 1.4 global hectares per capita, gha/cap), the huge difference in available biocapacity between the two nations means that Canada consumes only 30% of its national biocapacity, whereas Spain overshoots its territorial biocapacity. According to our EIO estimates, the Spanish land footprint needs to decrease slightly (~5%) in order to be within national biocapacity. For our sub-national case studies, we estimate land footprints using our EIO model (see Table 5) but estimates of biocapacity for Nova Scotia and Andalusia could not be determined so Figure 3 displays an uncertain ratio based on national values.
5. DISCUSSION
In this section, the empirical results of each case study site are used to illustrate several challenging issues, including source and sink capacities, sharing the global carbon budget, blue water scarcity, and transitioning to steady-state economies.
5.1 Source and sink capacities
Our results suggest that all of the case study sites are transgressing their shares of carbon, nitrogen and phosphorus assimilative capacity, whereas sources of land and blue water are generally within or near their boundaries. The overshoot of sink capacity is understandable in a market-based economy because sinks are generally freely available for all, whereas sources are frequently owned (privately or publicly) and managed (Daly and Farley, 2011). The good news from an environmental policy perspective is that examples abound of societies taking ownership of sources and sinks through both formal and informal governance, especially at local and regional levels, as a means to
successfully regulate depleting and polluting behaviour (Ostrom, 2010). The bad news is that addressing global environmental problems, like climate change and biosphere integrity, requires unprecedented (and costly) communication and cooperation that has proven elusive, despite widespread consensus that urgent, collective action is required.
exhausting resources (Malthus, 1798; Hardin, 1968), only one of the nine planetary boundaries proposed by Steffen et al. (2015) – freshwater use – is unambiguously located on the source end of economic activity. On the sink end, six boundaries – climate change, novel entities, stratospheric ozone depletion, atmospheric aerosol loading, ocean acidification and biogeochemical flows – can be characterized wholly as issues of absorptive capacity (or lack thereof). Land-system change and biosphere integrity, the two remaining boundaries, defy categorization as sources or sinks because they encompass both aspects within a broader systems perspective. In our case, however, the proxy indicator for land-system change used in this study is characterized wholly on the source end.
5.2 Sharing the global carbon budget
Our results for Canada's CO2 emissions are particularly illustrative of the profound challenges for equitably sharing the transformation to sustainability among nations. We find that there is no amount of emissions reductions that could bring Canada's historic cumulative carbon footprint back within an equitable share of the 350 ppm CO2 carbon budget by 2100. To be within its equitable share of the planetary boundary, we find that Canada would need to immediately cut CO2 emissions to zero and then become a net remover of carbon (i.e. negative emissions) from the atmosphere at a rate of ~8% per year from 2016 until the year 2100. From a technical and socio-economic perspective, the notion that Canada could ever follow such a path is virtually inconceivable. The Canadian government is certainly not considering that path, as communicated in their intent to “achieve an economy-wide target to reduce our greenhouse gas emissions by 30% below 2005 levels by 2030” (Government of Canada, 2015: 3). This target corresponds to emissions cuts of ~2% per year beginning in 2016, far below the global average cuts of 6% per year that Hansen et al. (2013) suggest are necessary to be within the planetary boundary.
In order to demonstrate the wide extent of potential options for sharing the global carbon budget, our results can be compared with Raupach et al.'s (2014) analysis that also explores options for sharing a global carbon budget among several nations, including Canada. The authors argue that the most viable distribution of national budgets lies at the mid-point between a spectrum of sharing principles extending from equal per capita cumulative emissions to the continuation of the present distribution of emissions (Ibid). Our carbon budgets, on the equal per capita end of the spectrum, are based on (i) a risk-averse global carbon budget of 700 Gt CO2 from 2013 to end-century that is (ii) shared among nations according to a criterion of perfect equity, and (iii) includes historic emissions (net of carbon uptake by ecosystems). On the other hand, one of Raupach et al.'s (2014) pathways finds that Canada's intended mitigation target of ~2% per year is consistent with (i) an available global carbon budget of 1400 Gt CO2 that is twice as large and considerably more risky, (ii) shared among nations according to the present, highly inequitable, distribution of emissions, and (iii) excludes historic emissions.
While it may be the case that meaningful action on climate change requires compromise between the above extremes (Grasso and Roberts, 2014), we agree with Brown and Taylor (2014) that ethical obligations require governments, at the very least, to explain how their intended emissions reduction targets and timelines are justified based on assumptions of fairness and the sharing of an explicitly defined global carbon budget. This sentiment is echoed in the landmark ruling that found the Dutch government acted unlawfully by failing to commit to the minimum emissions reductions (i.e. 25% below 1990 levels by 2020) deemed necessary by climate science for developed nations to fulfill their fair share of averting dangerous climate change (Urgenda v. The Netherlands, 2015).
5.3 Blue water scarcity
blue water scarcity in the Guadalquivir is best understood as a structural feature that arises due to overdevelopment of water resources such as dams, pipelines and irrigation canals (Molle and Wester, 2009). In particular, Dumont et al. (2013) find irrigation for agricultural products, representing ~80% of blue water consumption, is by far the largest use of blue water in the basin.
Berbel et al. (2013) argue that the management responses to water scarcity in the Guadalquivir illustrate how adopting water-saving technologies can actually translate into greater consumption, despite expectations to the contrary (i.e. the Jevons paradox). They find that widespread adoption of water-saving irrigation technology from 1992 to 2008 was associated with a reduction in water use per hectare of ~40%, but total irrigated land area nearly doubled (~90%) over the same period. Apart from increasing total water consumption, investments in irrigation systems have also made water demand more inelastic as farmers have progressively switched from low-value field crops (cereals, sunflowers, cotton) to higher value crops (olives, citrus, greenhouse-grown vegetables) that require permanent irrigation (Ibid). More rigid water demand is, in our view, synonymous with a decline in the resilience of the water-stressed catchment basins to climate variability that may come with a greater cost than the benefits gained from planting higher value crops.
5.4 Transitioning to a steady-state economy
The planetary boundaries framework identifies and incorporates a set of biophysical thresholds that jointly determine the resilience of the Earth-system without making assumptions about the myriad of paths that the human enterprise can take to stay within them (Rockström et al., 2009). The only explicit assertion is that it would be unwise to keep pushing the Earth-system out of a Holocene-like state because this state has supported the rise and flourishing of global human civilization. By integrating the planetary boundaries framework into Daly's definition of a steady-state economy, we are proposing the additional assertion of limiting growth in the stocks of people, animals and built capital as a desirable means for wealthy nations like Canada and Spain to stay within planetary boundaries.
Our method goes a step further than the original planetary boundaries framework towards answering how societies can stay within the boundaries (i.e. they should strive for non-growing physical stocks and flows), but it still leaves many questions unanswered. Most obviously, it provides no guidance for how societies ought to stop growing stocks and flows. Moreover, neither stable stocks nor environmental footprints within planetary boundaries are sufficient by themselves to ensure long-term sustainability. Our results for Nova Scotia support O'Neill's (2015a) observation that most biophysically stable countries are not sustainable because their current consumption exceeds global sustainability thresholds. These results lend additional support to authors calling for “degrowth” in wealthy nations (e.g. D’Alisa et al. 2014).
Moreover, our historical carbon footprint results for both Canada and Spain (Figure 4)
exemplify how countries with consumption levels that are within planetary boundaries will not stay in that position for long when stocks are growing exponentially. Although our method does not provide a roadmap to achieving a steady-state economy (see Dietz and O’Neill, 2013 for some ideas), it makes an important contribution by setting absolute target levels for countries and regions to anchor their own paths towards long-term biophysical sustainability.
In terms of target-setting of consumption-based resource use for Canada, Spain, Andalusia and other growing economies that are already transgressing several boundaries, we would suggest there is an urgent need to take the first step towards stabilizing both stocks and flows. Once
5.5 Limitations
An important limitation of this analysis is related to the disaggregation of planetary boundaries for our four indicators of sustainable scale. There are many options for dividing up shares of planetary boundaries spanning a distributive spectrum from perfect equality to perfect inequality, but only a couple simple distributions are explored here. Ultimately, there is no technical answer to the question of how to (re)distribute shares of source and sink capacities among societies because the issue is so fundamentally political. Disaggregating planetary boundaries within and between nations is influenced by a host of political economy factors including, inter alia, power dynamics, ideological orientations and the legitimacy of decision-making individuals/institutions (Söderbaum, 1999; Fanning, in press). Further research analyzing the sustainability of consumption relative to a range of burden-sharing approaches (see Raupach et al., 2014 for an example using carbon quotas) is needed to help inform public discussions of what constitutes a fair share of planetary boundaries.
We view the consumption-based indicators developed here as a useful step in the evolution of a biophysical accounting framework designed to measure how close societies are to sustainable consumption within planetary boundaries. The EIO method can incorporate many heterogeneous indicators of environmental pressure into a single framework that attributes resources used and wastes emitted throughout the supply chain to final consumers. For this study, however, the scope of our analysis at both national and sub-national levels led to the application of a two-region EIO method with potential sources of bias due primarily to the aggregation of industries and the domestic
technology assumption. These methodological limitations are a result of our desire to capture and compare environmental pressures across two administrative levels (national and sub-national). Future research could address some of these shortcomings by exploring opportunities to estimate sub-national environmental pressures using one of the high-resolution global multi-region IO databases available at the national level.
6. CONCLUSIONS
In this study, advances in Earth-system science are integrated for the first time into Daly's definition of a steady-state economy by explicitly adopting the planetary boundaries framework to track indicators of sustainable scale. Of particular note, we have developed and applied novel methods for estimating region-specific boundaries for carbon dioxide emissions and blue water consumption. Further research is envisaged to apply these methods to a larger sample of countries.
By integrating insights from the planetary boundaries framework, steady-state economics and EIO analysis, we compiled a set of 10 indicators over the 1995-2009 period to measure the proximity of Canada, Spain, Nova Scotia and Andalusia to a steady-state economy. The results suggest that Canada, Spain and Andalusia all had unambiguous growth in biophysical stocks and material/energy footprints over the analysis period whereas Nova Scotia experienced biophysical stability in stocks and flows. None of the case study sites fulfilled the criterion of maintaining material/energy footprints within their respective shares of planetary boundaries.
At the national level, the scale indicators measuring shares of Earth-system absorptive capacity (carbon, biogeochemical flows) are transgressed in both Spain and Canada. Spain also transgresses the scale indicators of regenerative capacity (land and blue water), whereas Canada does not because its territorial shares of biocapacity and available blue water are much larger. At the sub-national level, we were unable to quantify all of the scale indicators due to a lack of comparable data. However, the scale indicators that we were able to measure suggest that both sub-national case study sites exceed at least one boundary.
This article provides an indication of the level and trajectory of region-specific resource use in
comparison to a set of ecological limits, but there is a need for further exploration of the many options for different societies to contribute to effective planetary stewardship. Moreover, there is an urgent need to better understand the impact on social well-being of reductions in biophysical resource use to sustainable levels. By informing and engaging in these discussions, researchers serve an important role as catalysts of change in the defining challenge of the 21st century: how to achieve prosperous, stable societies within planetary boundaries.
ACKNOWLEDGEMENTS
REFERENCES
Allen, MR et al. (2009), 'Warming caused by cumulative carbon emissions towards the trillionth tonne', Nature, 458, pp 1163-1166.
AMECO (2015), 'Capital Stock: Net capital stock at constant prices, total economy', Annual Macro-economic Database, Economic and Financial Affairs, European Commission,
http://ec.europa.eu/economy_finance/ameco/user/serie/SelectSerie.cfm (Accessed January 26, 2015)
BBVA and Ivie (2014), El stock y los servicios del capital en España y su distribución territorial y sectorial (1964-2012), Fundación BBVA and Instituto Valenciano de Investigaciones Econoómicas (Ivie), Valencia. Available at
http://www.fbbva.es/TLFU/microsites/stock09/fbbva_stock08_index.html
Berbel, J et al. (2013), 'The trajectory towards basin closure of a European river: Guadalquivir', International Journal of River Basin Management, 11(1), pp 111-119.
Boden, TA, Marland, G and Andres RJ (2013), Global, Regional, and National Fossil-Fuel CO2 Emissions, Carbon Dioxide Information Analysis Center (CDIAC), Oak Ridge National Laboratory, U.S. Department of Energy, Oak Ridge.
Brown, D and Taylor, P (2014), Ethics and Climate Change: A Study of National Commitments, IUCN, Gland, Switzerland
Cole, MJ, Bailey, RM, New, MG (2014), 'Tracking sustainable development with a national barometer for South Africa using a downscaled “safe and just space” framework', Proceedings of the National Academy of Sciences(PNAS), 111(42), e4399-e4408
D'Alisa, G, Demaria, F, and Kallis, G (Eds.) (2014), Degrowth: A Vocabulary for a New Era, Routledge, New York.
Daly, H (1977), Steady-state economics: the economics of biophysical equilibrium and moral growth, W.H. Freeman, San Francisco.
Daly, H (2005), 'Economics in a full world', Scientific American, September, pp 100-107.
Daly, H (2008), 'A steady-state economy', Opinion piece for Redefining Prosperity, Sustainable Development Commission, UK http://www.sd-commission.org.uk/publications.php?id=775 Daly, H and Farley, J (2011), Ecological economics: principles and applications, 2nd Edition, Island
Press, Washington DC.
Dearing, JA et al. (2014), 'Safe and just operating spaces for regional social-ecological systems', Global Environmental Change, 28, pp 227-238.
Dietz, R, O'Neill, DW (2013), Enough Is Enough: Building a Sustainable Economy in a World of Finite Resources, Berrett-Koehler, San Francisco.
Druckman, A et al. (2008), 'Measuring progress towards carbon reduction in the UK', Ecological Economics, 66, pp 594-604.
Dumont, A et al. (2013), 'The water footprint of a river basin with a special focus on groundwater: The case of Guadalquivir (Spain)', Water Resources and Industry, 1-2, pp 60-76
Fanning, A (in press), 'Contrasting values in the sustainability debate: limitations of economic valuations and their role in decision-making', International Journal of Sustainable Development FAOSTAT (2014a), 'Production: Live Animals: Stocks', Statistics Division of the Food and Agriculture
Organization, http://faostat3.fao.org/download/Q/QA/E (Accessed March 15, 2015)
FAOSTAT (2014b), 'Inputs: Fertilizers', Statistics Division of the Food and Agriculture Organization, http://faostat3.fao.org/download/R/RF/E (Accessed January 23, 2015)
FAOSTAT (2015), 'Inputs: Land: Arable Land', Statistics Division of the Food and Agriculture Organization, http://faostat3.fao.org/download/Q/QA/E (Accessed February 27, 2016) Frame, DJ, Macey, AH, Allen, MR (2014), 'Cumulative emissions and climate policy', Nature
Geoscience, 7(10), pp 692-693.
Genty, A et al. (2012), 'Final database of environmental satellite accounts: technical report on their compilation', World Input-Output Database,
http://www.wiod.org/publications/source_docs/Environmental_Sources.pdf
GFN (2014), National Footprint Accounts 2014, Global Footprint Network, San Francisco, URL: www.footprintnetwork.org
Government of Canada (2015), Canada's Intended Nationally Determined Contribution (INDC), Submitted to the United Nations Framework on Climate Change, 15-May-2015,
http://www4.unfccc.int/submissions/INDC/ (Accessed October 18, 2015)
Grasso, M and Roberts, T (2014), 'A compromise to end the climate impasse', Nature Climate Change, 4, pp 543-549
Hansen, JE et al. (2013), 'Assessing “dangerous climate change”: Required reduction of carbon emissions to protect young people, future generations and nature', PLoS ONE, 8(12), e81648 Hardin, G (1968), 'The tragedy of the commons', Science, 162(3859), pp 1243-1248
Hoekstra, AY et al. (2012), 'Global monthly water scarcity: blue water footprints versus blue water availability', PloS ONE, 7(2), e32688.
Hoekstra, AY and Wiedmann, TO (2014), 'Humanity's unsustainable footprint', Science, 344(1114), pp 114-117.
Jackson, T et al. (2007), 'Attributing UK carbon emissions to functional consumer needs: methodology and pilot results' Resolve Working Paper Series, 01-07
Kharecha, PA and Hansen, JE (2008), 'Implications of “peak oil” for atmospheric CO2 and climate',
Global Biogeochemical Cycles, 22(3), GB3012
Le Quéré, C. et al. (2015), 'Global Carbon Budget 2014', Earth System Science Data, 7(1), pp 47-85 Malthus, T (1798), An Essay on the Principle of Population, St. Paul's Churchyard, London
Matthews, E et al. (2000), The weight of nations: material outflows from industrial economies, World Resources Institute, Washington DC
Mill, JS (1848), 'Of the Stationary State', Chapter VI, Book IV in Principles of Political Economy with some of their Applications to Social Philosophy, Green and Co., London
Miller, RE and Blair, PD (2009), Input Output Analysis: Foundations and Extensions, Cambridge University Press, Cambridge
Molle, F and Wester, P (2009), 'River basin trajectories: An inquiry into changing waterscapes' in Molle and Wester (Eds.) River Basin Trajectories: Societies, Environments and Development, pp 1-19, Cab International, London
Nykvist, B et al. (2013), National Environmental Performance on Planetary Boundaries, Swedish Environmental Protection Agency, Bromma
O'Neill, DW (2012), 'Measuring progress in the degrowth transition to a steady state economy', Ecological Economics, 84, pp 221-231.
O'Neill, DW (2015a), 'The proximity of nations to a socially sustainable steady-state economy', Journal of Cleaner Production, 108, pp 1213-1231
O'Neill, DW (2015b), 'What should be held steady in a steady-state economy? Interpreting Daly's definition at the national level', Journal of Industrial Ecology, 19(4), pp 552-563.
Ostrom, E (2010), 'Beyond markets and states: Polycentric governance of complex economic systems', American Economic Review, 100(3), pp 641-672
Pastor, AV et al. (2014), 'Accounting for environmental flow requirements in global water assessments', Hydrology and Earth System Sciences, 18, pp 5041-5059
Peters, G et al. (2011), 'Growth in emissions transfers via international trade from 1990 to 2008', Proceedings of the National Academy of Science, 108(21), pp 8903-8908.
Raupach, MR et al. (2014), 'Sharing a quota on cumulative carbon emissions', Nature Climate Change, 4(10), pp 873-879.
Rockström, J et al. (2009), 'Planetary boundaries: exploring the safe operating space for humanity', Nature, 461, pp 472-475.
Institute (SERI) and Vienna University of Economics and Business (WU), Vienna, Available at www.materialflows.net
Söderbaum, P (1999), 'Values, ideology and politics in ecological economics', Ecological Economics, 28, pp 161-170
Statistics Canada (2015a), 'Table 031-0007 – Flows and stocks of fixed non-residential capital, total all industries, by asset, Canada, provinces and territories, annual (dollars)', Cansim database:
http://www5.statcan.gc.ca/cansim/ (Accessed March 15, 2015).
Statistics Canada (2015b), 'Table 031-0008 – Flows and stocks of fixed residential capital, Canada, provinces and territories, annual (dollars)', Cansim database: http://www5.statcan.gc.ca/cansim/ (Accessed March 15, 2015).
Statistics Canada (2015c), 'Table 001-0069 Fertilizer shipments to Canadian agriculture markets, by nutrient content and fertilizer year, cumulative data, annual (metric tonnes x 1,000)', Cansim database: http://www5.statcan.gc.ca/cansim/ (Accessed May 27, 2015).
Statistics Canada (2015d), 'Table 004-0203 Census of Agriculture, land use, every 5 years, Cansim database: http://www5.statcan.gc.ca/cansim/ (Accessed March 01, 2016).
Steen-Olsen, K et al. (2012), 'Carbon, land and water footprint accounts for the European Union: Consumption, production and displacements through international trade', Environmental Science and Technology, 46, pp 10883-10891.
Steffen, W et al. (2007), 'The Anthropocene: Are humans now overwhelming the great forces of nature?', Ambio, 36(8), pp 614-621.
Steffen, W et al. (2015), 'Planetary boundaries: Guiding human development on a changing planet', Science, 347(6223), pp 1259855-1259855.
Tans, P (2015), Mauna Loa CO2 annual mean data, NOAA/ESRL, Available at http://www.esrl.noaa.gov/gmd/ccgg/trends/
Timmer, M et al. (2015, in press), 'An illustrated user guide to the World Input-Output Database: the case of global automotive production', Review of International Economics, online 10 April 2015. Tukker, A and Dietzenbacher, E (2013), 'Global multi-regional input-output frameworks: an introduction
and outlook', Economic Systems Research, 25(1), pp 1-19.
United Nations (2013), World population prospects: The 2012 revision, Department of Economic and Social Affairs, Population Division, New York.
Urgenda v. The Netherlands (2015), The Hague District Court, Chamber for Commercial Affairs (24 June, 2015). Available at: http://www.urgenda.nl/documents/VerdictDistrictCourt-UrgendavStaat-24.06.2015.pdf (Accessed October 18, 2015).
van der Woet, E et al. (2009), Environmental Impact of the Use of Natural Resources and Products, Report commissioned by Eurostat, CML Report No. 184, Available at
https://openaccess.leidenuniv.nl/handle/1887/14603
Weinzettel, J et al. (2013), 'Affluence drives the global displacement of land use', Global Environmental Change, 23, pp 433-438.
Wiedmann, T et al. (2006), 'Allocating ecological footprints to final consumption categories with input-output analysis, Ecological Economics, 56, pp 28-48.
Wiedmann, T et al. (2007),'Examining the global environmental impact of regional consumption activities – Part 2: Review of input-output models for the assessment of environmental impacts embodied in trade', Ecological Economics, 61, pp 15-26.
Wiedmann, T et al. (2013), 'The material footprint of nations', Proceedings of the National Academy of Sciences of the USA, September issue.
FIGURES
Intermediate Means
People (stock)
- Human population growth rate
Domesticated Animals (stock)
- Livestock population growth rate
Built Capital (stock)
- Net capital stock growth rate
Ultimate Means
Resource Use (flow)
- Material Footprint growth rate
- Blue Water Footprint growth rate
Energy Use (flow)
- Energy Footprint growth rate
Scale (capacity of biosphere to provide material/energy sources and sinks)
- Ratio of Carbon Footprint to Carbon Budget (sink)
- Ratio of Nutrient Use (Nitrogen and Phosphorus) to Biogeochemical Boundaries (sink)
- Ratio of Blue Water Consumption to Monthly Basin-Level Availability (source)
- Ratio of Land Footprint to Biocapacity (source)
Figure 1. The set of biophysical indicators used to track trends in economy-wide stocks, flows and scale. The
Figure 2.(a) Computed vs observed evolution of atmospheric CO2 concentration from 1959 to 2014.
(b) CO2 concentrations if fossil fuel emissions are reduced annually by 6% beginning in 2016, assuming ~90 Gt
Figure 4. Net cumulative CO2 emissions compared to cumulative carbon budget from 1850 to 2100. The