Features
.
White Rose Research Online URL for this paper:
http://eprints.whiterose.ac.uk/105841/
Version: Accepted Version
Proceedings Paper:
Cui, Lixin, Bai, Lu, Wang, Yue orcid.org/0000-0002-2482-005X et al. (3 more authors)
(2016) P2P Lending Analysis Using the Most Relevant Graph-Based Features. In:
Structural, Syntactic, and Statistical Pattern Recognition - Joint IAPR International
Workshop, S+SSPR 2016, Mérida, Mexico, November 29 - December 2, 2016,
Proceedings. Lecture Notes in Computer Science . Springer International Publishing , pp.
3-14.
https://doi.org/10.1007/978-3-319-49055-7_1
[email protected] https://eprints.whiterose.ac.uk/ Reuse
Items deposited in White Rose Research Online are protected by copyright, with all rights reserved unless indicated otherwise. They may be downloaded and/or printed for private study, or other acts as permitted by national copyright laws. The publisher or other rights holders may allow further reproduction and re-use of the full text version. This is indicated by the licence information on the White Rose Research Online record for the item.
Takedown
If you consider content in White Rose Research Online to be in breach of UK law, please notify us by
Graph-based Features
Lixin Cui1
, Lu Bai1⋆
, Yue Wang1
, Xiao Bai2
, Zhihong Zhang3
, Edwin R. Hancock4
1
School of Information, Central University of Finance and Economics, Beijing, China
2
School of Computer Science and Engineering, Beihang University, Beijing, China
3
Software School, Xiamen University, Xiamen, Fujian, China
4
Department of Computer Science, University of York, York, UK
Abstract. Peer-to-Peer (P2P) lending is an online platform to facilitate borrow-ing and investment transactions. A central problem for these P2P platforms is how to identify the most influential factors that are closely related to the credit risks. This problem is inherently complex due to the various forms of risks and the numerous influencing factors involved. Moreover, raw data of P2P lending are often high-dimension, highly correlated and unstable, making the problem more untractable by traditional statistical and machine learning approaches. To address these problems, we develop a novel filter-based feature selection method for P2P lending analysis. Unlike most traditional feature selection methods that use vectorial features, the proposed method is based on graph-based features and thus incorporates the relationships between pairwise feature samples into the fea-ture selection process. Since the graph-based feafea-tures are by nafea-ture completed weighted graphs, we use the steady state random walk to encapsulate the main characteristics of the graph-based features. Specifically, we compute a probabil-ity distribution of the walk visiting the vertices. Furthermore, we measure the discriminant power of each graph-based feature with respect to the target feature, through the Jensen-Shannon divergence measure between the probability distri-butions from the random walks. We select an optimal subset of features based on the most relevant graph-based features, through the Jensen-Shannon diver-gence measure. Unlike most existing state-of-the-art feature selection methods, the proposed method can accommodate both continuous and discrete target fea-tures. Experiments demonstrate the effectiveness and usefulness of the proposed feature selection algorithm on the problem of P2P lending platforms in China.
1
Introduction
Online Peer-to-Peer (P2P) lending has recently emerged as an useful financing alterna-tive where individuals can borrow and lend money directly through an online trading platform without the help of institutional intermediaries such as banks [24]. Despite its explosive development, recent years have witnessed several acute problems such as high default rate of borrowers and bankruptcy of a large number of P2P lending plat-forms, etc [15]. To prevent personal investors from economic losses and ensure smooth and effective operations of the P2P lending industry, it is of great necessity to develop
efficient credit risk assessment methods. Indeed, state-of-the-art P2P lending platforms such as Prosper and Lending Club, have utilized credit rating models for evaluating risk for each loan [6].
Credit risk evaluation decisions are inherently complex due to the various forms of risks and the numerous influencing factors involved [4]. Along this line, tremendous efforts have been devoted to developing quantitative credit rating methods due to their effectiveness. These methods can be broadly divided into two groups: traditional sta-tistical methods [5]and machine learning approaches [20]. Using stasta-tistical methods is difficult because of the complexities of dependencies between various factors that influ-ence the final credit risk evaluations. On the other hand, machine learning approaches, such as tree-based classifiers, support vector machines (SVM), and neural networks (N-N), etc., do not require the factors to be independent and identically distributed (i.i.d.), and are capable of tackling computationally intensive credit risk evaluation problems. However, along with emergence of the Internet and E-Commerce, data sets of P2P lend-ing are gettlend-ing larger and larger. In addition, these raw data are often high-dimensional, highly-correlated, and unstable. These characteristics of the P2P lending data present new challenges for traditional machine learning algorithms, which may consume large amount of computational time and can not process information effectively.
To mitigate this problem, one potent way is to use feature selection in the data preprocessing process before implementing the learning algorithms [7]. By choosing a small subset of the most informative features that ideally is necessary and sufficient to describe the target concept [10], feature selection is capable of solving data mining and pattern recognition problems with data sets involving large number of features. Some have attempted to explore the advantages of feature selection for credit risk evaluation for P2P lending. For instance, Malekipirbazari and Aksakalli [15] proposed a random forest based classification method for predicting borrower status. To reduce data di-mensionality, they proposed a feature selection method based on the information gain of each individual feature. In Jin and Zhu [21], a random forest method is used to e-valuate the significance of each feature, and a feature subset is selected based on this measure. By comparing the performance of decision tree, SVM, and NN on a dataset from Lending Club, the authors demonstrated the effectiveness of using feature selec-tion method for credit risk analysis for P2P lending. Despite its usefulness in solving credit risk evaluation problems in P2P lending, most existing feature selection methods accommodate each feature as a vector, and thus ignore the relationship between pair-wise samples in each feature. This drawback lead to significant information loss. Thus, developing effective feature selection method still remains a challenge.
Jensen-Shannon divergence measure between the probability distributions from the ran-dom walks. We select an optimal subset of features based on the most relevant graph-based features, through the Jensen-Shannon divergence measure. Unlike most existing state-of-the-art feature selection methods, the proposed method can accommodate both continuous and discrete target features. Experiments demonstrate the effectiveness and usefulness of the proposed feature selection algorithm on the problem of P2P lending platforms in China.
This paper is organized as follows. Section 2 briefly reviews the related works of feature selection methods. Section 3 presents preliminary concepts that will be used in this work. Then Section 4 define the proposed feature selection method. Section 5 presents the experimental evaluation of the proposed approach on a dataset collected from a large P2P lending portal. Section 6 concludes this work.
2
Literature Review
Feature selection has been a fundamental research topic in data mining and machine learning [8]. By choosing from the input data a subset of features that maximizes a generalized performance criterion, feature selection reduces the high dimensionality of the original data, improves learning performance, and provides faster and more cost-effective predictors [7].
Feature selection methods can be broadly divided into two categories, depending on their interaction with the classifier [18]. Filter-based methods [23] are independent from the classifier and focuses on the intrinsic properties of the original data. It usually provides a feature weighting or ranking based on some evaluation criteria and outputs a subset of selected features. By contrast, wrapper approaches [13] perform a search for an optimal subset of features using the outcome of a classifier as guidance. Often, the results obtained by wrapper methods are better than those obtained by filter methods, but the computational cost is also much higher.
Generally, evaluation criteria are of great significance for feature selection and a great variety of effective evaluation criteria have been proposed to locate informative features. These methods include distance [12], correlation [9], information entropy [14], rough set theory [3], etc. Among them, the correlation criterion and its extensions are probably one of the most widely used criteria to characterize the relevance between features, due to its good performance and ease of implementation. For instance, Hall [9] employed some correlation measures to evaluate the optimal feature subsets based on the assumption that a good subset contains features which are highly correlated to the class, yet uncorrelated to each other. In [19], a supervised feature selection method which builds a dissimilarity space by hierarchical clustering with conditional mutual information is developed.
Broadly speaking, there are two types of methods to measure the correlation be-tween the same type of features. One is traditional linear correlation and the other kind is based upon information theory. For the first type, the most well-known similarity measure between two featuresxandyis the linear correlation measuresim(x, y)and
Herevar(·)represents the variance of a feature andcov(x, y)denotes the covariance between featurexandy. Other measures in this category are basically variations of this measure, including the maximal information compression index and least square re-gression error. Although this type of similarity measure can reduce redundancy among relevant features, it has several shortcomings. First, the linear correlation assumption between features are often not reasonable because many real world data such as P2P lending and finance, have very complex nonlinear relationships. Second, the linear cor-relation measure is not applicable in the cases when discrete data are involved.
To address these shortcomings, various information theory based correlation mea-sures such as information gain [22] and symmetrical uncertainty [17] have been pro-posed. The amount by which the entropy ofxdecreases reflects additional information aboutXprovided byY, and is called information gain, which is expressed as
IG(x, y) =H(x)−H(x|y) =H(y)−H(y|x).
HereH(·)denotes the entropy of a featureX andH(x|y)refers to the entropy ofX after observing values of another discrete feature Y. Despite its efficiency, informa-tion gain is biased towards features with more values. On the other hand, symmetrical uncertainty normalizes its value to the range of[0,1]. It can be defined as
SU(x, y) = 2[IG(x, y)/H(x) +H(y)].
IfSU(x, y) = 1, it indicates that featuresxandyare completely related. Otherwise, if SU takes the value of zero, it suggests thatxandyare totally independent.
Although many robust correlation-based evaluation criteria have been developed in literature, there is no existing method that can incorporate relationships between pairwise samples of each feature dimension into the feature selection process. We also notice that a number of existing feature selection criteria implicitly select features that preserve sample relationship, which can be inferred from either a predefined distance metric or label information [25]. This indicates that it would be beneficial to incorporate sample relationship into the feature selection algorithm.
3
Preliminary Concepts
3.1 Probability Distributions from The Steady State Random Walk
AssumeG(V, E)is a graph with vertex setV, edge setE, and a weight functionω : V ×V → R+
. Ifω(u, v)> 0(ω(u, v) = ω(v, u)), we say that(u, v)is an edge of G, i.e., the verticesu∈V andv∈V are adjacent. The vertex degree matrix ofGis a diagonal matrixDwhose elements are given by
D(v, v) =d(v) =∑
u∈V
ω(v, u). (1)
Based on [2], the probability of the steady state random walk visiting each vertexvis
p(v) =d(v)/∑
u∈V
Furthermore, from the probability distributionP = {p(1), . . . , p(v), . . . , p(|V|)}, we can straightforwardly compute the Shannon entropy ofGas
HS(G) =−
∑
v∈V
p(v) logp(v). (3)
3.2 Jensen-Shannon Divergence
In information theory, the JSD is a dissimilarity measure between probability distribu-tions over potentially structured data, e.g., trees, graphs, etc. It is related to the Shannon entropy of the two distributions [2]. Consider two (discrete) probability distributions P = (p1, . . . , pm, . . . , pM)andQ = (q1, . . . , qm, . . . , qM), then the classical
Jensen-Shannon divergence betweenP andQis defined as
DJ S(P,Q) =HS
(P+Q 2
) −1
2HS(P)− 1 2HS(Q)
=−
M
∑
m=1
pm+qm
2 log
pm+qm
2 +
1 2
M
∑
m=1
pmlogpm+
1 2
M
∑
m=1
qmlogqm, (4)
whereHS(.)is the Shannon entropy of a probability distribution. Note that, the JSD
measure is used as a means of measuring the information theoretic dissimilarity of graphs. However, in this work, we are more interested in the similarity measure between features. Thus, we define the JSD based similarity measure by transforming the JSD into its negative form and obtaining the corresponding exponential value, i.e.,
S(P,Q) = exp{−DJ S(P,Q)}. (5)
4
The Feature Selection Method on Graph-based Features
4.1 Construction of Graph-based Features
In this subsection, we transform each vectorial feature into a new graph-based fea-ture, that is a complete weighted graph. The main advantage of using the new feature representation is that the graph-based feature can incorporate the relationship between samples of each original vectorial feature, and thus leading to less information loss. Given a dataset havingN features denoted asX ={f1, . . . ,fi, . . . ,fN} ∈ RM×N,fi
represents thei-th vectorial feature that hasM samples. We transform each vectorial featurefi into a graph-based featureGi(Vi, Ei), where each vertexva ∈ Vi indicates thea-th samplefaoffi, each pair of verticesvaandvbis connected by a weighted edge
(va, vb)∈Ei, and the weightw(va, vb)is the Euclidean distance as
w(va, vb) =
√
(fa−fb)(fa−fb)T. (6)
Similarly, if the sample of the target featureY ={y1, . . . , ya, . . . , yb, . . . , yM}T
the sampleyaof the target featureY may take discrete valuesc= 1,2, . . . , C. For this
instance, we first compute the graph-based target featureGˆi( ˆVi,Eˆi)for each featurefi, where the weightw(ˆvia,vˆib)of each edge(ˆvia,vˆib)∈Eˆiis
w(ˆva,vˆb) =
√
(µia−µib)(µia−µib)T, (7)
whereµia is the mean value of all samples infi that are corresponded by the same
discrete valuecof the target feature samples andc=ya. Moreover, based on [11], we
also compute the Fisher scoreF(fi)for each featurefias
F(fi) = ∑C
c=1nc(µc−µ)2
∑C
c=1ncσc2
, (8)
whereµc andσc2are the mean and variance of the samples corresponded by the same
discrete valuec,µis the mean of featurefi, andncis the number of the samples corre-sponded byc-th in featurefi. From Eq.(8), we observe that the Fisher scoreS(fi)reveal the quality of the graph-based target featureGˆiforfi. In other words, a higher Fisher score means a better target feature graph. As a result, the graph-based target feature
ˆ
G( ˆV ,Eˆ)can be identified by
ˆ
G( ˆV ,Eˆ) =Gˆ( ˆV∗
i ,Eˆ
∗
i), (9)
where
i∗
= arg max
i F(
fi). (10)
4.2 Feature Selection based on Relevant Graph-based Features
We aim to select an optimal subset of features. Specifically, by measuring the Jensen-Shannon divergence between graph-based features, we compute the discriminant pow-er of each vectorial feature with respect to the target feature. For a set ofN features f1, . . . ,fi, . . . ,fj, . . . ,fN and the associated continuous or discrete target feature Y,
the relevance degree or discriminant power of the featurefiwith respect toYis
Rfi,Y=S(Gi,
ˆ
G), (11)
whereGiandGˆare the graph-based features offiandY,Sis the JSD based similarity measure defined in Eq(5). Based on the relevance degree of each featurefiwith respect to the target featureYcomputed by Eq.(11) (for the continuous target feature) or Eq.(9) (for the discrete target feature), we can rank the original vectorial features in descending order and then select a subset of the most relevant features.
5
Experiments
credit risk analysis of the P2P platforms because the P2P lending industry has develope-d rapidevelope-dly since the year of 2007, andevelope-d many have sufferedevelope-d from severe problems such as default of borrowers and bankruptcy. More specifically, we use a data of 200 P2P plat-forms collected from a famous P2P lending portal in China (http://www.wdzj.com/). For each platform, we use 19 features including: 1) transaction volume, 2)total turnover, 3) total number of borrowers, 4) total number of investors, 5) online time, which refers to the foundation year of the platform, 6) operation time, i.e., number of months since the foundation of the platform, 7) registered capital, 8) weighted turnover, 9) average term of loan, 10) average full mark time, i.e., tender period of a loan raised to the required full capital, 11) average amount borrowed, i.e., average loan amount of each success-ful borrower, 12) average amount invested, which is the average investment amount of each successful investor, 13) loan dispersion, i.e., the ratio of the repayment amount to the total capital, 14) investment dispersion, the ratio of the invested amount to the total capital, 15) average times of borrowing, 16)average times of investment, 17) loan balance, 18) popularity, and 19) interest rate.
5.1 The Most Influential Features for Credit Risks (Continuous Target Features)
We first use the proposed feature selection algorithm to identify the most influential features which are most relevant to the interest rate of P2P platforms. In finance, the interest rates of P2P lending can also be interpreted as the rate of return on a loan (for investors), and the higher the rate of return, the greater the likelihood of default. Identifying the most relevant features to the interest rate can help investors effectively manage the credit risks involved in P2P lending [24]. Therefore, in our experiment, we set the interest rate as ourcontinuous target feature. Our purpose is to identify the features that are most influential for the credit risks of the P2P platforms. To realize this goal, we use the proposed feature selection algorithm to rank the remaining 18 features according to their similarities to the target label in descending order. The results are shown in Table 1.
Table 1.Influential factors for bankruptcy problems for P2P lending platforms in China
Ranking Feature Score Name of Feature Ranking Feature Score Name of Feature
1# 0.975 Registered capital 10# 0.935 Popularity 2# 0.967 Operation time 11# 0.927 Total number of borrowers 3# 0.966 Average amount invested 12# 0.926 Weighted turnover 4# 0.965 Loan dispersion 13# 0.919 Loan balance 5# 0.965 Average times of investment 14# 0.916 Total turnover 6# 0.963 Online time 15# 0.908 Average times of borrowing 7# 0.950 Average term of loan 16# 0.903 Average full mark time 8# 0.949 Total number of investors 17# 0.903 Average amount borrowed 9# 0.939 Investment dispersion 18# 0.902 Transaction volume
Results and discussions:It is shown that registered capital, operation time, average
dispersed loan rate often indicates a higher degree of security for the platform, which implies a relatively lower interest rate. The average amount invested and average times of investment indicate investors’ preferences for the less risky platforms. On the con-trary, features such as average times of borrowing and average amount borrowed are of less relevance because these features reflect the financing needs of the borrowers and are less relevant to the credit risks of the platforms.
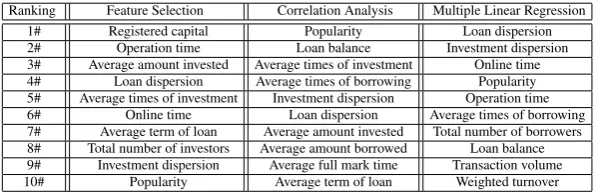
Comparisons:In this section, we compare the proposed feature selection (FS) method
[image:9.595.158.457.394.492.2]with two widely used methods including correlation analysis (CA) and multiple lin-ear regression (MLR). Table 2 presents a comparison of the results obtained via these methods. Each method identifies 10 features which have higher correlation to the in-terest rate. It can be noticed that the most influential factors identified by the proposed method tend to be more in consistent with the factors selected by MLR, whereas CA ranks different features higher. For example, among the top five most influential fac-tors, both FS and MLR select operation time and loan dispersion. This is reasonable because a more dispersed loan rate often indicates a higher degree of security for the platform, which implies a relatively lower interest rate. Also, a longer operation time of the platform often indicates that the platform accumulates abundant risk managemen-t knowledge and skills, which are helpful managemen-to mainmanagemen-tain a lower credimanagemen-t risk level. These results are in consistent with the finance theory and demonstrate the effectiveness and usefulness of the proposed method for the identification of the most influential factors for credit risk analysis of P2P lending platforms.
Table 2.Comparison of three methods
Ranking Feature Selection Correlation Analysis Multiple Linear Regression 1# Registered capital Popularity Loan dispersion 2# Operation time Loan balance Investment dispersion 3# Average amount invested Average times of investment Online time 4# Loan dispersion Average times of borrowing Popularity 5# Average times of investment Investment dispersion Operation time 6# Online time Loan dispersion Average times of borrowing 7# Average term of loan Average amount invested Total number of borrowers 8# Total number of investors Average amount borrowed Loan balance 9# Investment dispersion Average full mark time Transaction volume 10# Popularity Average term of loan Weighted turnover
5.2 Classification for The Credit Rating (Discrete Target Features)
We further evaluate the performance of the proposed method when the target features are discrete. We set the credit rating (taking discrete values) as the target feature, and our purpose is to identify the most influential features for the credit rating of the P2P lending platforms in China. These rating values are collected from the ”Report on the Development of the P2P lending industry in China, 2014-2015”, issued by the Finan-cial Research Institute of the Chinese Academy of SoFinan-cial Sciences. Due to the strict evaluation criteria involved, only 104 P2P platforms are included in this report, among which only 42 platforms belong to the 200 P2P platforms used in the above data set. Therefore, we take these 42 platforms as samples for evaluation.
0 2 4 6 8 10 12 14 16 18 20 0.12
0.14 0.16 0.18 0.2 0.22 0.24 0.26 0.28 0.3 0.32
Classification Accuracy (%)
Number of Selected Features
[image:10.595.191.427.110.221.2]GF FS MI All Features
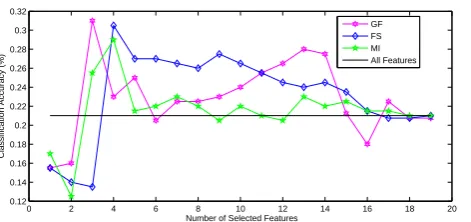
Fig. 1.Accuracy vs. Number of Selected Features for Different Feature Selection Methods.
samples as training data, and use the other half for testing. By repeating this selection process 10 times, we obtain 10 random partitions of the original data. For each of the 10 partitions of the original data, we perform a 10-fold cross-validation using a C-Support Vector Machine (C-SVM) to evaluate the classification accuracy associated with the se-lected features located via different feature selection methods. These methods include: 1) the proposed feature selection method (GS), 2) the Fisher Score method (FS) [11], and 3) the Mutual Information based method (MI) [16]. We perform cross-validation on the testing samples taken from the feature selection process. Specifically, the en-tire sample is randomly partitioned into 10 subsets and then we choose one subset for testing and use the remaining 9 subsets for training, and this procedure is repeated 10 times. The final accuracy is computed by averaging the accuracies from each of the random subsets, over all the 10 partitions. The final accuracy is computed by averaging the accuracies from each of the random subsets, over all the 10 partitions. The classifi-cation accuracy of each feature selection method based on different number of the most influential features is shown in Fig.1.
Fig.1 indicates that the proposed method (GS) achieves the best classification accu-racy (31.50%) while requiring the lowest number of features, i.e., 3 features. In contrast, the FS and MI methods request 3 and 4 features respectively for their best classification accuracies30.50%and29.00%, respectively. The reasons for this effectiveness is that only the proposed method incorporates the sample relationship into the feature selection process, and thus encapsulates more information. Although the classification accuracy is31.50%, it is very promising because dividing 42 samples into four different classes is a very challenging classification task. Thus, the classification accuracy demonstrates the effectiveness of the proposed method.
6
Conclusion
The proposed feature selection method ignores the redundancy between pairwise features. As a result, the optimal subset of selected features may include redundant fea-tures. Furthermore, the proposed method cannot adaptively select the most informative feature subset. To address these problems, future work will be aimed at proposing a new framework that can adaptively select the most informative and less redundant graph-based feature subset. Furthermore, it is also interesting to propose new approaches of establishing graph-based features from original vectorial features. Finally, note that, the similarity measure between a graph-based feature and the target graph-based feature defined by Eq.(11) is the Jensen-Shannon diffusion graph kernel [1, 2] over probability distributions. In fact, one can also adopt other alternative graph kernels. In other words, the proposed framework provides a way of developing feature selection methods asso-ciated with graph kernels. It is interesting to explore the performance of the proposed method associated with different graph kernels in future works.
Acknowledgments
This work is supported by the National Natural Science Foundation of China (Grant no. 61602535, 61503422 and 61402389), and the Open Projects Program of National Laboratory of Pattern Recognition. Lu Bai is supported by the program for innovation research in Central University of Finance and Economics. Edwin R. Hancock is sup-ported by a Royal Society Wolfson Research Merit Award.
References
1. Lu Bai, Horst Bunke, and Edwin R. Hancock. An attributed graph kernel from the
jensen-shannon divergence. InProceedings of ICPR pages = 88–93, year = 2014, crossref =
D-BLP:conf/icpr/2014,.
2. Lu Bai, Luca Rossi, Horst Bunke, and Edwin R. Hancock. Attributed graph kernels using
the jensen-tsallis q-differences. InProceedings of ECML-PKDD I, pages 99–114, 2014.
3. Yuming Chen, Duoqian Miao, and Ruizhi Wang. A rough set approach to feature selection
based on ant colony optimization.Pattern Recognition Letters, 31(3):226–233, 2010.
4. Jonathan N. Crook, David Edelman, and Lyn C. Thomas. Recent developments in consumer
credit risk assessment.European Journal of Operational Research, 183(3):1447–1465, 2007.
5. D.J.Hand and W.E.Henley. Statistical classification methods in consumer credit scoring: A
review. Journal of the Royal Statistical Society, Series A, 160(3):523–541, 1997.
6. Yanhong Guo, Wenjun Zhou, Chunyu Luo, Chuanren Liu, and Hui Xiong. Instance-based
credit risk assessment for investment decisions in P2P lending.European Journal of
Opera-tional Research, 249(2):417–426, 2016.
7. Isabelle Guyon and Andr´e Elisseeff. An introduction to variable and feature selection.
Jour-nal of Machine Learning Research, 3:1157–1182, 2003.
8. Petr H´ajek and Krzysztof Michalak. Feature selection in corporate credit rating prediction. Knowl.-Based Syst., 51:72–84, 2013.
9. Mark A. Hall. Correlation-based feature selection for discrete and numeric class machine
learning. InProceedings of the ICML, pages 359–366, 2000.
10. Jiuqi Han, Zhengya Sun, and Hongwei Hao. Selecting feature subset with sparsity and low
11. Xiaofei He, Deng Cai, and Partha Niyogi. Laplacian score for feature selection. InAdvances in Neural Information Processing Systems 18 [Neural Information Processing Systems, NIPS 2005, December 5-8, 2005, Vancouver, British Columbia, Canada], pages 507–514, 2005. 12. Yue Huang, Paul J. McCullagh, and Norman D. Black. An optimization of relieff for
classi-fication in large datasets. Data Knowl. Eng., 68(11):1348–1356, 2009.
13. Ron Kohavi and George H. John. Wrappers for feature subset selection. Artif. Intell.,
97(1-2):273–324, 1997.
14. Mark Last, Abraham Kandel, and Oded Maimon. Information-theoretic algorithm for feature
selection.Pattern Recognition Letters, 22(6/7):799–811, 2001.
15. Milad Malekipirbazari and Vural Aksakalli. Risk assessment in social lending via random
forests.Expert Syst. Appl., 42(10):4621–4631, 2015.
16. Jouni Pohjalainen, Okko R¨as¨anen, and Serdar Kadioglu. Feature selection methods and their combinations in high-dimensional classification of speaker likability, intelligibility and
personality traits. Computer Speech & Language, 29(1):145–171, 2015.
17. William H. Press, Saul A. Teukolsky, William T. Vetterling, and Brian P. Flannery.Numerical
Recipes in C, 2nd Edition. Cambridge University Press, 1992.
18. Yvan Saeys, I˜naki Inza, and Pedro Larra˜naga. A review of feature selection techniques in
bioinformatics.Bioinformatics, 23(19):2507–2517, 2007.
19. Jos´e Mart´ınez Sotoca and Filiberto Pla. Supervised feature selection by clustering using
con-ditional mutual information-based distances.Pattern Recognition, 43(6):2068–2081, 2010.
20. I-Cheng Yeh and Che-hui Lien. The comparisons of data mining techniques for the predictive
accuracy of probability of default of credit card clients.Expert Syst. Appl., 36(2):2473–2480,
2009.
21. Y.Jin and Y.D.Zhu. A data-driven approach to predict default risk of loan for online
peer-to-peer (p2p) lending. InProceedings of Fifth International Conference on Communication
Systems and Network Technologies, pages 609–613, 2015.
22. Lei Yu and Huan Liu. Efficient feature selection via analysis of relevance and redundancy. Journal of Machine Learning Research, 5:1205–1224, 2004.
23. Daoqiang Zhang, Songcan Chen, and Zhi-Hua Zhou. Constraint score: A new filter method
for feature selection with pairwise constraints.Pattern Recognition, 41(5):1440–1451, 2008.
24. Hongke Zhao, Le Wu, Qi Liu, Yong Ge, and Enhong Chen. Investment recommendation in
P2P lending: A portfolio perspective with risk management. InProceedings of ICDM, pages
1109–1114, 2014.