This is a repository copy of Micro-to nano-scale characterisation of polyamide structures of the SW30HR RO membrane using advanced electron microscopy and stain tracers.
White Rose Research Online URL for this paper: http://eprints.whiterose.ac.uk/129266/
Version: Accepted Version Article:
Kłosowski, MM, McGilvery, CM, Li, Y et al. (5 more authors) (2016) Micro-to nano-scale characterisation of polyamide structures of the SW30HR RO membrane using advanced electron microscopy and stain tracers. Journal of Membrane Science, 520. pp. 465-476. ISSN 0376-7388
https://doi.org/10.1016/j.memsci.2016.07.063
(c) 2016, Elsevier B.V. This manuscript version is made available under the CC BY-NC-ND 4.0 license https://creativecommons.org/licenses/by-nc-nd/4.0/
[email protected] https://eprints.whiterose.ac.uk/
Reuse
This article is distributed under the terms of the Creative Commons Attribution-NonCommercial-NoDerivs (CC BY-NC-ND) licence. This licence only allows you to download this work and share it with others as long as you credit the authors, but you can’t change the article in any way or use it commercially. More
information and the full terms of the licence here: https://creativecommons.org/licenses/
Takedown
If you consider content in White Rose Research Online to be in breach of UK law, please notify us by
1
Micro- to nano-scale characterisation of polyamide
1
structures of the SW30HR RO membrane using
2
advanced electron microscopy and stain tracers
3 4
Michał M. Kłosowski1, Catriona M. McGilvery1, Yuqiong Li2,
5
Patricia Abellan3, Quentin Ramasse3, João T. Cabral2, Andrew G.
6
Livingston2, and Alexandra E. Porter1*
7 8
1 Department of Materials and Engineering, Imperial College London,
9
London
10
2 Department of Chemical Engineering, Imperial College London,
11
London
12
3 SuperSTEM Laboratory, Daresbury
13 14
*Corresponding author: Alexandra E. Porter, Department of Materials
15
and Engineering, Imperial College London, Royal School of Mines,
16
South Kensington Campus, London, SW7 2AZ, UK; phone:
17
(+44)207594 9691; e-mail: [email protected]
2
Abstract
1
The development of new reverse osmosis (RO) membranes with
2
enhanced performance would benefit from a detailed knowledge of
3
the membrane structures which participate in the filtration process.
4
Here, we examined the hierarchical structures of the polyamide (PA)
5
active layer of the SW30HR RO membrane. Scanning electron
6
microscopy combined with focused ion beam milling (FIB-SEM) was
7
used to obtain the 3-D reconstructions of membrane morphology with
8
5 nm cross-sectional resolution (comparable with the resolution of
9
low magnification TEM imaging in 2D) and 30 nm slice thickness.
10
The complex folding of the PA layer was examined in 3 dimensions,
11
enabling the quantification of key structural properties of the PA
12
layer, including the local thickness, volume, surface area and their
13
derivatives. The PA layer was found to exhibit a much higher and
14
convoluted surface area than that estimated via atomic force
15
microscopy (AFM). Cross-sectional scanning transmission electron
16
microscopy (STEM) was used to observe the distribution of a tracer
17
stain under various conditions. The behaviour of stain in dry and wet
18
PA indicated that the permeation pathways have a dynamic nature and
19
are activated by water. High resolution STEM imaging of the stained
20
PA nano-films revealed the presence of <1nm pore-like structures
21
with a size compatible with free volume estimations by positron
22
annihilation lifetime spectroscopy (PALS). This study presents a
23
comprehensive map of the active PA layer across different length
24
scales (from micro- to sub-nanometer) and mechanistic insight into
25
their role in the permeation process.
26 27
Keywords:
28
RO membrane, characterisation, FIB-SEM, STEM, permeation
3
1. Introduction
1 2
Reverse osmosis (RO) membrane filtration is frequently utilised in
3
water purification and recycling for domestic, industrial and
4
agricultural purposes [1,2]. Membranes designed for molecular
5
separations in water usually comprise a “tight” separating layer of
6
polyamide (PA) on a more open support layer of polysulfone (PSf).
7
The PA and PSf layers are mounted on a woven fabric backing of
8
polyethylene (PE) or polypropylene (PP) [3,4]. The topmost PA layer
9
is thought to play the active role in the filtration process as a
10
molecular sieve and an ion barrier [5]. Improved knowledge of the
11
structure and chemistry of the PA layer is required to design
12
membranes, which achieve higher performance in water desalination
13
and purification [6]. Characterisation of the PA layer is particularly
14
challenging due to its complex and interconnected ridge-valley
15
structure, thinness of the active film, the sub-nanometre size of
16
structures within the film, and beam sensitivity intrinsic to polymer
17
materials in electron and ion beam microscopes.
18
The organisation of the PA layer at the meso-scale is often assessed
19
by cross-sectional transmission electron microscopy (TEM) [7,8],
20
isometric or top-down scanning electron microscopy (SEM) imaging
21
[3,9–11] supported by topological information acquired via atomic
22
force microscopy (AFM) [5,9,11,12]. The overall thickness of the PA
23
layer ranges from 20 to 400 nm [12]. PA morphology is typically
24
estimated by the maximum ridge-to-valley distance, average
25
roughness and apparent surface area [5,13]. It is commonly accepted
26
that water permeability increases with the apparent surface area of the
27
PA layer [1].
28
The inner structures of the PA layer are usually characterised using
29
electron microscopy (EM) imaging of membrane cross-sections [5].
30
The PA layer might be divided in two regions: a relatively flat and
31
semi-porous base at the PA-PSf interface and a more open structure of
4
protuberances spreading from the base, giving rise to the well-known
1
ridge-valley structure [14]. Recently, it has been suggested that the
2
PA layer is formed of a continuous sub-10 nm, highly crumpled PA
3
nano-film [15]. The crumpling of the thin nano-film results in the
4
formation of multiple voids within the PA layer, especially in the
5
basal region. Some studies suggest that these voids contribute to an
6
increase in surface area (as the voids are open to the surface at one
7
end [6,16]), which might be connected with increased flux [17–19];
8
other studies suggested that the voids are discrete [19,20].
9
The molecular-scale mechanisms of particle/ion filtration are not fully
10
understood and are typically rationalised in terms of classic pore-flow
11
or solution-diffusion models [21,22]. Separation studies postulated
12
that permeation is modulated by both continuous pores and the
13
density of cross-linked polyamide [23,24]. Molecular dynamics (MD)
14
simulations suggested that the filtration occurs through a network of
15
sub-nanometre pores, which may play an active or passive role in the
16
process [25,26].
17
“Porosity” at such small length scales likely corresponds to a
18
modulation of density and free volume inherent to polymeric
19
networks, rather than to actual pores in the macroscopic sense. In
20
addition, segmental and cooperative polymer dynamics, under
21
solvation and pressure conditions, might be expected to modulate
22
solute transport [27]. Evidence of sub-nanometre pores within the PA
23
layer has been obtained by positron annihilation lifetime spectroscopy
24
(PALS) [5,22,28] and solution permeation rate calculations [29]. Until
25
now, the only spatially resolved imaging methods used to study pores
26
smaller than 10 nm were based on the tracking of nanoparticles [30].
27
Few attempts have been made to validate the permeation models
28
(pore flow vs. solution diffusion) described above. Nanoparticles have
29
been used as contrast agents in attempts to map classic pores and/or
30
permeation pathways within the PA and PSf layers. To enhance the
5
visibility of these structures in transmission electron microscopy
1
(TEM), membranes were infiltrated with nanoparticles such as Au or
2
OsO2 [14,30]. These studies used particles of known size to visualise
3
the crumpled topography of the PA layer [14] and to measure the
4
sizes of pores in the PA layer [30]. As the nanoparticles are often
5
inhomogenously distributed within the membranes, it is difficult to
6
observe the direct transport pathways or draw conclusions about the
7
behaviour of membranes during the filtration process. Furthermore,
8
nanoparticles of set size may not accurately reflect the size of voids
9
within the membrane, due to complex transport mechanisms, the
10
variation in the sizes of the pores or the dynamic nature of these
11
pores.
12
In addition to nanoparticles, heavy metal stains such as osmium
13
tetroxide, ruthenium tetroxide, uranyl acetate or lead citrate may be
14
used to reveal the structural features of the PA layer. By contrast to
15
nanoparticles, metal stains diffuse more homogeneously through the
16
material due to their small size (initially ionic); selectively lodge in
17
charged regions; additionally fix the material and could be delivered
18
in both liquid and vapour phases. To date, staining has mainly been
19
used to enhance contrast of membranes in TEM and map the
20
distribution of functional groups in the PA layer [7,12,14]. As most of
21
the TEM studies were conducted at relatively low magnifications, it is
22
difficult to characterise any structural features smaller than 30 nm.
23
The question of how the micro- to nano-metre scale features and their
24
morphology modulate the permeation process remain unanswered [6].
25
Spatially resolved imaging techniques, such as SEM, TEM or AFM,
26
do not provide a complete picture of the 3-dimensional (3-D)
27
architecture of the PA layer and the impact of the structures within the
28
PA on the filtration process at the micro- to nano-scale. At the
sub-29
nanometre scale, little is known about the 3-D distribution of the
30
pores, their chemistry and role in solute (water/ion) transport. PALS
31
studies provide only statistical information about the bulk of the
6
membrane and computational models generally lack validation with
1
spatially resolved experiments.
2
High resolution electron microscopy (EM) studies of RO membranes
3
are so far limited. EM has mainly been used for relatively low
4
magnification, bright-field TEM imaging showing cross-sections of
5
commercial membranes [5,14] or SEM imaging of the PA surface
6
[10,11]. However, EM methods are exceptionally well-suited to
7
provide spatially resolved maps of the hierarchical structures of the
8
polyamide layer. Advanced nanoanalytical techniques, available on
9
modern scanning TEMs (STEMs), have a spatial resolution sufficient
10
to observe structural features smaller than 1 nm.
11
The combination of tomographic EM methods allows 3-D
12
visualisation of hierarchical membrane features from the micro- to
13
nano-metre length scales. Yan et al. [16] highlighted the significance
14
of large voids (10-50 nm in diameter) within the PA layer and the
15
possible pathway in the BW30 membrane. Pacheco et al. [19] have
16
recently examined void spaces (15 to 30 nm in diameter) within the
17
PA layer of ESPA3 and SWC3 in 3-D and proposed a link between an
18
increased volume of these voids with increased permeance of the
19
membrane. A 2-D study by Lin et al. [20] estimated that these voids
20
may constitute up to 30% of the PA layer volume. The focus of our
21
work is therefore to comprehensively examine and precisely quantify
22
the structures within the PA layer envelope at the micro-scale, and
23
examine structures within the PA nano-film at the nano- to
sub-nano-24
scale with unprecedented spatial resolution.
25
We combine a range of EM techniques with heavy metal staining
26
methods to visualise the hierarchical structure of the PA layer of the
27
commercially available SW30HR (Dow Filmtec) membrane, selected
28
for its common industrial use in high rejection water desalination
29
[31].
7
Focused ion beam scanning electron microscopy (FIB-SEM) was
1
used to reconstruct the features of polyamide in 3-D with high spatial
2
resolution. Staining was used not only for contrast enhancement, but
3
also for elucidation of the PA structure, specifically for mapping the
4
nano-pores within the PA nano-film using high annular dark field
5
scanning transmission electron microscopy (HAADF-STEM; atomic
6
number, Z2 contrast imaging). Moreover, by varying the staining
7
methods, potential permeation mechanisms in the polyamide film
8
could be proposed.
9
2. Materials and methods
10
2.1. Sample preparation for electron microscopy
11
SW30HR (Dow Chemical Company, USA) flat sheet membranes
12
were stained with RuO4. In general, staining improves the overall
13
contrast for electron microscopy (EM) imaging, stabilises the polymer
14
under the electron beam (by crosslinking oxidised moieties, such as
15
amide and carbonyl groups) and highlights the distribution of
16
functional groups. The varying behaviour of stain tracers in different
17
staining conditions may also reveal the permeation pathways.
18 19
1x1 cm2 membrane coupons cut from a larger sheet were stained
20
using standard (as received) stabilized 0.5 wt.% aqueous solutions of
21
RuO4 (Acros Organics, Geel, Belgium). Four different staining
22
methods were used:
23
I. A membrane coupon was fully immersed in liquid stain for 5
24
min and immersed in 10ml of water for 30 min;
25
II.The top surface of membrane coupon was exposed to the stain
26
vapours for 1 min;
27
III. A drop of liquid stain was placed on the top surface of
28
membrane coupon for 1 min;
8
IV. A drop of pure water was placed on the top of the
1
membrane coupon for 10 min, and then the top surface of the
2
coupon was exposed to the stain vapours for 1 min.
3
Method I was used to enhance contrast for FIB-SEM imaging (SI
4
Figure 1) to ensure that the polymer was stained throughout. Methods
5
II, III and IV were used to examine permeation pathways within the
6
PA layer by STEM. To ensure the reproducibility of the results, 3
7
samples for each of the staining conditions were prepared. The
8
combination of dry (method II) and wet techniques was used to probe
9
the transport mechanisms of ions and to highlight the role of water in
10
the permeation process. Staining was performed under ambient
11
conditions. Longer staining times (5 and 10 min) were also tested for
12
methods II-IV.
13
To prepare samples for EM, the stained samples were washed 3 times
14
with water for 5 min each to remove excess stain. Next, to dehydrate
15
the samples, they were immersed in 50%, 70%, 90% and 100%
16
aqueous solutions of ethanol (30 min each). Samples were embedded
17
in LR White Hard resin (London Resin Company, Reading, UK),
18
which was found to give the best contrast from the PA polymer.
19
Samples were immersed successively in 1:1 and 3:1 resin:ethanol
20
solutions for 12h. For the next 4 days, samples were immersed in pure
21
resin to ensure full infiltration. The resin was changed every 24h. On
22
the last day samples in resin were degased under vacuum to ensure
23
sample-resin binding and resin hardening. The final resin batch was
24
mixed with a dedicated LR White accelerator (benzoyl peroxide) to
25
enhance the crosslinking of the resin at room temperature. Pristine
26
(non-stained) samples were embedded using the same protocol.
27
2.2. Focused ion beam SEM (FIB-SEM)
28
For FIB-SEM milling, a flat surface of the resin embedded sample
29
stained, using method I, was exposed using a PowerTome
30
ultramicrotome (Boeckeler Instruments, Tucson, USA) with a
9
diamond knife (DiATOME, Hatfield, USA). Next, a 1 mm thick slice
1
was cut and mounted on an aluminium stub using silver paint. Prior to
2
SEM imaging, the sample was coated with a 20 nm layer of
3
chromium to reduce charging.
4
FIB-SEM series were taken on an Auriga microscope (Carl Zeiss
5
Microscopy, Jena, Germany) fitted with a gallium ion source. The
6
FIB milling conditions were set to 30 kV and with a beam current of 1
7
nA, which results in a probe size of ~10nm.
8
Samples were milled from the side (SI Figure 2). To minimise FIB
9
damage (e.g., ion implantation and curtaining) during alignments, the
10
top, 1µm-thick part of sample was used as a sacrificial layer. Only the
11
region below the sacrificial layer was imaged by SEM (SI Figure 2).
12
SEM imaging was performed at 1.49 kV with an energy selective
13
backscattered electron detector. In these conditions, the size of SEM
14
probe is ~2nm. Pixel averaging collection was used to reduce noise.
15
In total, 357 images of membrane cross-sections were acquired, with
16
a step size of 30 nm between successive images. As SEM images
17
were taken at an angle (SI Figure 2), the images had to be adjusted to
18
account for this resulting in non-uniform pixels (the pixel size in y
19
direction was multiplied by1.24).
20
Avizo software (FEI, Hillsboro, USA) was used for pre-processing of
21
FIB-SEM data and reconstruction of virtual volumes. FIB-SEM
22
slices were denoised using a Gaussian filter and realigned using an
23
automatic least-squares function. Further information on thresholding
24
and reconstruction can be found in SI (SI Figure 3). The reconstructed
25
voxel size was 3.7x4.6x30 nm3.
26
2.3. Estimation of structural properties
27
To minimise errors in the calculation of membrane parameters arising
28
from non-uniform voxels [32], volumes reconstructed from FIB-SEM
29
data were resliced in ImageJ [33] to obtain uniform voxels of 5x5x5
10
nm3. To accurately assess the outer volume of the PA layer envelope
1
and the impact of the discrete objects within the envelope on the
2
structural parameters, the volume was purified (discrete voids and
3
particles were removed from the volume – SI Figure 4) in BoneJ [34].
4
The PA layer is very heterogeneous; to address the natural variability
5
of the membrane, 2.5x2.5 m2 regions were examined.
6
BoneJ was used to determine the total surface area (SA), volume (V)
7
and local thickness [35] distribution of the PA layer envelope. The
8
local thickness at any given point (voxel) of a 3-D structure is defined
9
as the diameter of the largest sphere that fits inside the 3-D object and
10
contains the point [35]. In other words, the individual local thickness
11
measurement represents the local diameter of the structure. A graphic
12
explanation of the local thickness measurement is given in SI Figure
13
5. The rudimentary reactivity was estimated as surface-to-volume
14
(SA/V) ratio. Front and rear surface areas were calculated from the
15
total surface area of front and rear volumes by subtracting the side
16
and division areas (SI Figure 4). Relative area ratios were calculated
17
by dividing the actual surface area by the area of the underlying
18
rectangle.
19
2.4. Atomic force microscopy (AFM)
20
For comparison with the surface structure generated from FIB-SEM,
21
AFM imaging was used. The front surface of the PA layer was
22
imaged on the original SW30HR membrane taped to an AFM sample
23
holder with the PA facing upwards. To image the rear surface of the
24
PA layer, free-standing PA layers were prepared and placed on a glass
25
cover slip. The freestanding membranes were obtained as follows.
26
The polyethylene (PE) backing was carefully peeled off of the
27
SW30HR membrane with a scalpel blade. The remaining two-layered
28
membrane was pressed onto a clean glass cover slip such that the PA
29
side sticks to the glass substrate. A drop of deionized water was added
30
to hydrate and soften the membrane. A few drops of
11
dimethylformamide (DMF) were carefully placed onto the PSf facing
1
upwards. As the PSf dissolved in the solvent, the glass slide was tilted
2
to allow the solvent with the dissolved PSf to be drained. The process
3
was repeated several times until the PSf was completely removed.
4
The isolated PA thin layer appeared optically transparent.
5
Samples were imaged in an Innova AFM (Bruker, USA) in tapping
6
mode fitted with a phosphorus (n) doped silicon cantilever (k = 20-80
7
N/m, tip nominal diameter <10 nm). AFM images were acquired at
8
512 samples/line and a scanning rate of 0.2 Hz, under ambient
9
conditions.
10
2.5. Scanning transmission electron microscopy (STEM)
11
For TEM imaging, thin (~70 nm) sections of samples were cut with
12
the ultramicrotome (Boeckeler Instruments, Tucson, USA) and
13
transferred onto 300-mesh copper grids with a lacey carbon film
14
support (TAAB Laboratories Equipment, Aldermaston, UK).
15
STEM imaging was performed on a Cs (image-)corrected, FEI Titan
16
80-300 microscope operated at 80 and 300kV. A 60 mm camera
17
length was used giving an annular dark field (ADF)-STEM collection
18
semi-angle of 26-145 mrad and high angle (HA)ADF-STEM
19
collection semi-angle of 129-575 mrad. Before imaging, samples
20
were beam showered (exposed to an uncondensed broad electron
21
beam) in the TEM mode to stabilise the sections by equalizing the
22
charge distribution across the section and reduce hydrocarbon
23
contamination [36]. The experimental dose was closely monitored and
24
did not exceed 1250 e/nm2.
25
High resolution STEM imaging was performed on SuperSTEM2 -
26
Nion UltraSTEM 100 microscope at 100kV. The HAADF collection
27
semi-angle range is 85-190 mrad and the probe size is 0.1 nm. Prior to
28
imaging, samples were baked for 12h in a vacuum oven (10-6 Torr)
29
with a rising temperature gradient (from room temperature to 130°C)
30
to reduce hydrocarbon contamination.
12
2.6. Quantification of the <1 nm structures
1
High resolution images were denoised using a Gaussian filter,
2
contrast-enhanced and thresholded using magic wand selection. We
3
aimed to highlight only structures that showed local maxima. In some
4
instances we used a water-shedding algorithm to separate larger
5
clusters of stain precipitates. The surface areas of the reconstructed
6
precipitates were calculated using ImageJ (SI Figure 6). The
7
diameters of the pores were estimated as the diameter of circles of the
8
same area. All spots of diameter smaller than 0.2 nm were filtered out
9
(the approximate size of Ru atoms ≈ 0.15 nm).
10
3. Results
11
3.1. 3-D structure of the polyamide layer
12
To reconstruct and quantify features of the PA layer morphology,
13
cross-beam FIB-SEM tomography was used. We are able to visualise
14
features larger than 15 nm in the PA layer in 3-D. The 3-D
15
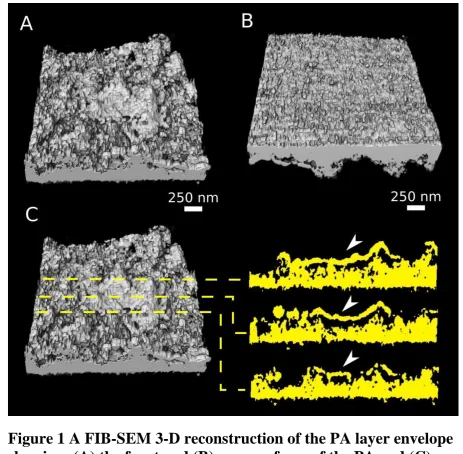
reconstruction in Figure 1 and SI Movie 1 shows the front (Figure
16
1A) and rear (Figure 1B) surface, and cross-sections (Figure 1 C, D)
17
of the PA envelope. The envelope represents a volume containing the
18
entire PA layer with the discrete, inner voids excluded. Orthoslices
19
taken through the 3-D reconstructions show that protuberances, which
20
are often referred to as ridges [5], are in fact leaf-like (bridge-like)
21
sheets overhanging large regions of the PA layer (Figure 1 C, D -
22
arrowheads). These regions are not fully enclosed and large empty
23
spaces directly underneath the ridges are open to the front surface.
24
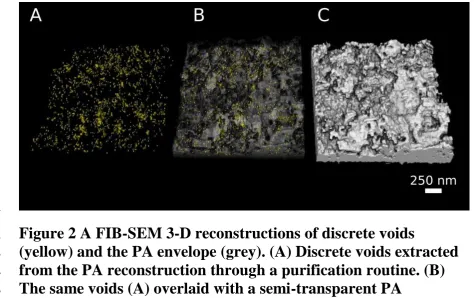
There were also smaller, discrete voids observed within the PA
25
envelope (Figure 2 and SI Movie 2). These discrete voids have an
26
average local thickness of 21±7 nm (367 voids for the minimal
27
threshold) and 17±5 nm (61 voids for the maximal threshold).
28
Local thickness mapping [34] was also performed on the bulk features
29
of the PA layer (Figure 3A, B and C). The local thickness describes
30
dimensions of all PA layer features: from a single sheet (~10 nm) to
13
multiple convoluted and compacted sheets of PA nano-film (~260
1
nm). The latter structures appear as non-porous (Figure 3 B, E – white
2
arrowheads), but may possess void spaces, which are below the
3
resolution of the FIB-SEM technique or remain unresolved due to
4
poor contrast.
5
The ridge-like features (Figure 1A and C) on the front side of the
6
membrane were found to be <70 nm thick, whereas the features on the
7
rear side of the PA layer were much thicker (up to 260 nm), as AFM
8
cannot measure overhangs, steep walls and other convoluted
9
structures of the PA topography. For comparison, AFM maps were
10
converted into 3-D models and local thickness maps were calculated
11
(Figure 3D, E and F). The measured root-mean square roughness was
12
75 nm and the peak-to-peak height was 496 nm for the front surface,
13
and 15nm and 110nm, respectively, for the back surface. In the AFM
14
reconstruction, almost all of the membrane volume appeared thick
15
(bright), because this method only maps the apparent topography. In
16
Table 1, the structural properties of the PA layer in the SW30HR
17
membrane are given.
[image:14.595.64.524.523.757.2]18
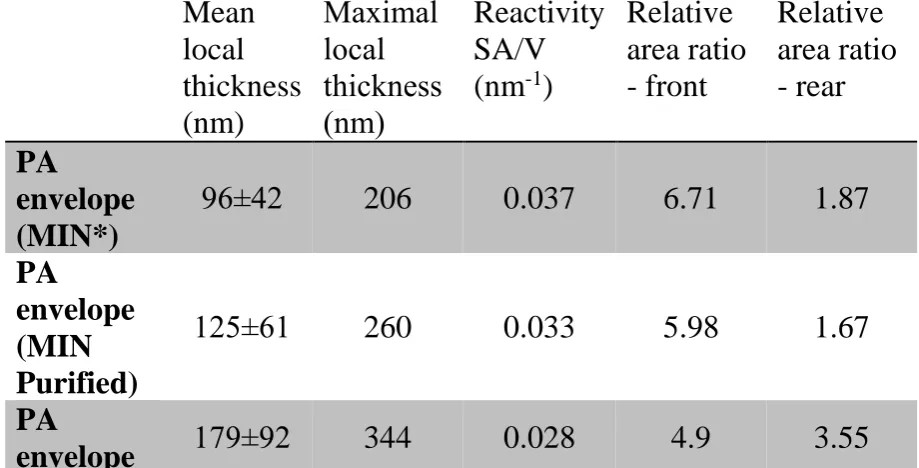
Table 1 Structural properties of the PA layer of a SW30HR
19
membrane (for 2.5x2.5 m2 regions).
20
Mean local thickness (nm)
Maximal local thickness (nm)
Reactivity SA/V (nm-1)
Relative area ratio - front
Relative area ratio - rear
PA
envelope (MIN*)
96±42 206 0.037 6.71 1.87
PA
envelope (MIN Purified)
125±61 260 0.033 5.98 1.67
PA
14
(MAX) PA
envelope (MAX Purified)
183±90 344 0.025 4.66 2.64
AFM 284±71
443 0.012 1.71 1.3**
AFM
Purified 285±70 443 0.012 1.64 1.3**
* MIN – minimal threshold, MAX – maximal threshold, Purified –
1
discrete voids removed
2
** AFM front and rear surface images were collected from different
3
regions.
15 1
Figure 1 A FIB-SEM 3-D reconstruction of the PA layer envelope
2
showing: (A) the front and (B) rear surfaces of the PA and (C)
3
cross-sections through the ridges showing that they are hollow
4
(white arrowheads). All voids seen in (C) are open to the surface.
5
16 1
Figure 2 A FIB-SEM 3-D reconstructions of discrete voids
2
(yellow) and the PA envelope (grey). (A) Discrete voids extracted
3
from the PA reconstruction through a purification routine. (B)
4
The same voids (A) overlaid with a semi-transparent PA
5
envelope. (C) A fully opaque reconstruction of the PA envelope in
6
the given region.
17 1
Figure 3 A local thickness map of the PA envelope: (A) an
2
isometric, (B) side and (C) a rear view from a FIB-SEM
3
reconstruction and (D) an isometric, (E) side and (F) a rear view
4
from an AFM reconstruction. Thin regions are dark (red to
5
violet), while thick regions are bright (white to yellow; the
6
thickest structures for each reconstruction are indicated by white
7
arrows). Each view shows a 2.5x2.5 m2 region.
8
3.2. Inner structure of PA layer
9
Staining experiments were used to reveal the inner structures of the
10
PA layer, seeking to resolve possible permeation pathways, and thus,
11
transport mechanisms through the PA nano-film.
18
In Figure 4, the effects of vapour staining on a dry membrane (method
1
II) are shown. As the vapour stain reached the top surface of the
2
membrane, stain propagation was evidently hindered at the PA-air
3
boundary. The stain did not penetrate readily into the PA nano-film
4
and instead precipitated forming a bright crust along the top interface
5
(Figure 4 A, B). Bright spots within the PA nano-film were also
6
observed (Figure 4C), suggesting that some stain precipitated within
7
the pores of the PA. Many of the voids observed at the rear side of the
8
PA layer (i.e., inside the basal region next to the polysulfone support)
9
were not accessed by the stain. Stain precipitates were observed in
10
only a few of these voids (Figure 4A, arrowheads), which are most
11
likely open to the top surface. Occasionally, stain precipitates
12
aggregated at the entrance to a seemingly open void (Figure 4D and
13
SI Movie 3). In general, the propagation of stain through a dry PA
14
layer was significantly impeded.
15
The liquid staining technique (method III) sought to visualise the
16
transport of water in the PA layer. As the stain is in an aqueous
17
solution, the distribution of tracer should, in principle, reflect the
18
fraction accessible to water molecules within the PA layer. In Figure
19
5, the effects of liquid staining on the front side of the membrane are
20
shown, in clear contrast to the dry images above. When the liquid
21
stain was applied on the top surface, the stain propagated through the
22
PA layer and into the PSf support. Voids on the rear side of the PA
23
layer (towards the PA/PSf interface) and very complex structures
24
within the PA were penetrated by the stain (Figure 5 A, C). Staining
25
highlighted the presence of effective “channels” within the PA layer
26
(Figure 5 B, D), which were either filled with a dense precipitate
27
(black arrowheads) or were empty (white arrowheads). Such
28
”channels” were also observed in non-stained samples (Figure 6), but
29
staining significantly enhanced their visibility. These structures have
30
significantly weaker contrast in the pristine (non-stained) PA, which
19
suggests that these are hollow regions formed by tight folding of the
1
PA film.
2
The staining patterns clearly differed between the dry and wet
3
experiments presented above. Therefore, membrane solvation and
4
swelling in water and must play a significant role in activating the
5
permeation pathways within the PA. To test this hypothesis, the
6
vapour staining technique on a wet membrane (method IV) was used
7
to further investigate the role of water and access of transport
8
pathways in the membrane. In Figure 7, the effects of vapour staining
9
on a wetted membrane were shown. In comparison to the dry
10
membrane (Figure 4) the stain started to reach enclosed regions of the
11
PA layer (Figure 7A), but did not penetrate the PA as thoroughly as
12
under wet conditions (Figure 5). Smaller precipitates within the PA
13
nano-film were often observed and occasionally, a stain propagation
14
front could be seen (Figure 7B).
15
For longer staining times (5 and 10 min), precipitates outside the PA
16
layer dominated the contrast (SI Figure 7).
17
18
20 1
Figure 4 HAADF-STEM images of a dry SW30HR membrane,
2
which was vapour stained on the front side with RuO4 for 1 min.
3
(A) Stain precipitates formed on the surface of the PA layer and
4
within few voids (black arrowheads) within the layer. The dotted
5
line represents the PA/PSf interface. (B) Higher magnification
6
image of the region seen in (A) showing stain on the outside of the
7
nano-film. (C) Higher magnification image of the region seen in
8
(A) showing stain precipitates within the PA nano-film. (D) Stain
9
precipitates aggreagating (black arrowheads) in the entrance to a
10
seemingly open void.
21 1
Figure 5 HAADF-STEM images of a SW30HR membrane stained
2
from the front side with RuO4 in aqueous solution for 1 min. (A)
3
Stain precipitates were present in the whole volume of the PA
4
layer. (B) Higher magnification image of the region seen in (A)
5
showing dense precipitates (black arrowheads) formed within
6
“channels” of the basal PA layer. (C) Selective staining showing
7
empty (white arrowheads) and occupied (black arrowheads)
8
“channels” within the PA. (D) Higher magnification image of
9
empty (white arrowheads) and filled (black arrowheads)
10
channels seen in (C). The dotted lines in (A), (B) and (C)
11
represent the PA/PSf interface.
22 1
Figure 6 HAADF-STEM images of a non-stained SW30HR
2
membrane. (A) An acquisition showing empty channels within the
3
PA layer. (B) A respective image with higlighted “channnels” - ,
4
possibly representing collapsed voids. The dotted lines in (A) and
5
(B) represent the PA/PSf interface.
6
[image:23.595.51.529.408.696.2]7
Figure 7 HAADF-STEM images of a wetted SW30HR membrane,
8
which was vapour stained on the front side with RuO4 for 1 min.
9
(A) Stain precipitates formed on the surface and within
10
convoluted regions (white arrowhead) of the PA layer. (B) Higher
11
magnification image of the region seen in (A) showing stain within
23
the nano-film and a stain propagation front (dashed line). The
1
dotted lines in (A) and (B) represent the PA/PSf interface.
2
3
3.3. Porosity of the polyamide nano-film
4
Until now the presence and dimensions of sub-nanometre pores
5
within the PA nano-film have been estimated via indirect techniques,
6
such as PALS [5]. The observation of <1 nm pores has been
7
significantly hindered by intrinsic low contrast of polymer material
8
and shortcomings of imaging techniques. With the combination of
9
high spatially resolved EM imaging and staining methods described
10
above, <1 nm pores can be visualised. The stain highlights circular
11
regions within the PA nano-film (Figure 8). This contrast arises from
12
stain precipitates lodged within the nano-film.
13
For high resolution STEM imaging, regions where precipitates had
14
formed within the PA nano-film (stained with method II and III) were
15
selected. Only sections with the stain evenly distributed across the
16
cross-section were examined to ensure that the observed precipitates
17
were inside the PA nano-film and not on its surface. The micrographs
18
show the presence of precipitates within the PA nano-film (Figure 8).
19
Both images show a fragment of a PA nodule at high magnification
20
(SI Figure 8). The average diameter of precipitates formed within the
21
nano-film is <1 nm (0.7±0.4 nm for vapour stained; 0.6±0.4 nm for
22
liquid stained; n=250).
24 1
Figure 8 HAADF-STEM images of stain precipitates in the PA
2
nano-films of the SW30HR membrane exposed to (A) the vapour
3
and (B) liquid stain for 1 min (method II and III). Both images
4
show cross-sections through the protuberances at high
5
magnification (SI Figure 8).
6
4. Discussion
7
Staining combined with high resolution EM has provided several
8
important advances in our understanding of the structure-related
9
mechanisms by which the filtration occurs. Since direct, nano-scale
10
observations of RO membranes in operating conditions are so far
11
virtually impossible, we attempted to capture the changes in
12
membrane behaviour using a tracer stain. The permeation through the
13
PA layer depends on many factors, such as the accessible surface area
14
of the PA layer and the nature of transport pathways within the PA
15
layer and the 10 nm PA nano-film.
16
Using high resolution FIB-SEM 3-D reconstructions, we showed that
17
the highly complex structures of the PA layer have a much larger
18
active surface area than when examined via AFM. The behaviour of
19
tracers within the dry and wet PA highlights the role of water
20
solvation and swelling in activating the transport pathways. Finally, at
21
the sub-nano-scale, we visualised <1 nm pore-like structures within
25
the PA nano-film using heavy metal staining. These observations lead
1
to important conclusions about the membrane behaviour during the
2
permeation and the role of water during this process.
3
4.1. 3-D reconstructions of the polyamide layer
4
FIB-SEM was used to obtain 3-D reconstructions of membrane
5
morphology with resolution comparable with the resolution of low
6
magnification TEM imaging [14]. Discrete voids within the PA layer
7
observed with FIB-SEM correspond in size (average 20 nm) to those
8
observed in a previous electron microscopy studies [19,20]. We build
9
on the aforementioned studies by focusing on reconstruction of the
10
surrounding PA envelope and studying the distribution and
11
interconnectivity of voids within the PA envelope. Additionally, the
12
heavy metal staining methods used allowed for more robust and
13
automated thresholding, which enabled a straightforward
14
quantification of the structural parameters of the PA layer and void
15
spaces.
16
17
Large empty spaces under the ridges of the PA layer, which might be
18
easily accessible to fluids (Figure 1D), as well as smaller, discrete
19
voids within the PA envelope (Figure 2) were observed. While
cross-20
sectional studies tend to assume all voids observed in the image are
21
discrete [20], it is important to highlight that some of the voids within
22
the PA layer, which appear discrete in the 2-D cross-sectional images,
23
are open to either of the surfaces (but not both – Figure 1D, SI Movie
24
1, Figure SI 4). The presence of large empty spaces under the ridges
25
increases the active surface of the membrane, which in turn may
26
affect the water flux. The range of morphologies of the protuberances
27
and their impact on separation performance have been reported on in
28
previous studies [9,37–40], but until now have not been accurately
29
quantified. We calculated structural parameters of the PA layer such
26
as local thickness or relative area ratio and compared the results with
1
AFM data.
2
It has been shown that while AFM is commonly used in the
3
characterisation of RO membranes [37,41], it significantly
4
underappreciates the complexity of the PA layer. Using a SW30HR
5
membrane, we showed that the actual front surface area might be
2.5-6
4 times larger than when estimated with dry AFM. Similarly, the
7
SA/V ratio might be 2-3 times greater. On the other hand, the
8
morphology of the rear side agreed with previous studies [42] and the
9
surface area of the rear sides of the PA layer was comparable between
10
FIB-SEM and AFM measurements.
11
Structures observed with SEM could be linked with lower hierarchy
12
structures observed with TEM to enable a multi-scale mapping and to
13
establish a hierarchical model of RO membranes. Cross-sections of
14
FIB-SEM reconstructions can be correlated to TEM micrographs
15
(compare Figure 1C with Figure 4A and Figure 5A). It is important to
16
note that FIB-SEM has limited capability to resolve the internal
17
structures in the PA layer (i.e., stacked membrane folds or smaller
18
voids), due to small contrast variations between the internal regions.
19
Therefore, we propose FIB-SEM should be utilised as a tool to
20
estimate the structural properties of the PA layer envelope (the
21
volume within the external surface of the PA layer).
22
4.2. Nano-scale effects of staining
23
RuO4 stains polymers that contain aromatic rings, amine/amide
24
groups or unsaturated carbohydrates [43]. While the bulk effects of
25
RuO4 staining are well known and described [43], experiments using
26
RuO4 to study permeation pathways into RO membranes, have not
27
previously been conducted. By analogy to polyethylene [44,45], we
28
suggest that RuO4 would oxidise the carbonyl and amide groups of
29
polyamide. While this process alters the chemical composition of the
30
stained film, it fixes and stabilises the structure by forming additional
27
crosslinks between oxidised functional groups. RuO4 will move
1
through the polymer network until it oxidises one of the chemical
2
groups, limiting the pathway for diffusion of other molecules. At this
3
stage, precipitates (larger clusters of ruthenium oxides) will form
4
within the PA film. Therefore, the stain propagation is expected to be
5
a function of diffusion and reactivity within the PA film. Upon
6
membrane hydration, the staining of the film became more extensive
7
(Figure 4D, Figure 7B, Figure 5B). In the aqueous environment, the
8
PA film swells and enables further stain propagation within the
9
membrane, facilitated by RuO4-water interactions.
10 11
Nanocrystals of RuO2 were also found to precipitate on external
12
surfaces of the polymer [46]. This phenomenon occurs for all
13
staining conditions (wet and dry) and is expected upon reduction of
14
unstabilised RuO4. This process occurs alongside the film staining
15
and increases with exposure time (SI Figure 7). A short exposure of 1
16
min was selected to provide suitable contrast to image the
17
nanostructure of the PA film.
18 19
At higher magnification, TEM images of the PA layer cross-sections
20
revealed the presence of “channels” within the PA structure. These
21
structures were identified as hollow regions, possibly formed by tight
22
folding of the PA film. The presence of “channels” was further
23
confirmed by wet staining experiments. Staining patterns (Figure 5)
24
suggest that many of the finger-like structures observed in the TEM
25
images should be considered as “deflated balloons” rather than solid
26
nodules. Staining of each individual “channel” may vary depending
27
on its openness. Empty “channels” would be visible if the surrounding
28
membranes hindered all diffusing RuO4. Filled “channels” would
29
form if some of the RuO4 passed through the PA film without
30
oxidation of any functional group in the PA network and precipitated
31
in the “channel” space. Importantly, “channels” were observed not
32
only in the protuberances on the front side of the PA layer, but also in
28
the loops of the basal regions (Figure 5D). Regions, in which
1
“channels” are visible, might have been formed from a highly
2
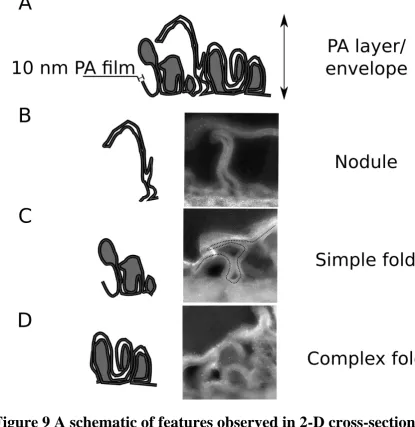
crumpled single nano-film as suggested by Karan et al. [15]. In Figure
3
9, a schematic of features observed in the PA layer is shown.
4 5
A number of studies shows cave-like protuberances, which agrees
6
with the crumpled nano-film model [6,16,19]. However, not all of the
7
structures observed in the PA layer could be simply explained by film
8
crumpling. Some of the studies report the presence of discrete voids
9
[19,20]; in particular, Pacheco et al. [19] visualised these voids from
10
reconstructed electron tomograms and attributed formation of
11
discrete voids to the presence of aqueous droplets during interfacial
12
polymerisation processes. Studies, in which this explanation of void
13
formation was proposed previously [47,48], describe voids of
14
micrometre (or greater) in size - orders of magnitude higher than our
15
case.
16
The smallest voids reconstructed in our study were around 15 nm in
17
diameter. Pacheco et al. also omitted reconstructing smaller voids due
18
to difficulties with interpreting the contrast in the images and the
19
resolution limit of electron tomography [49,50]. Smaller voids were
20
definitely present, but it is not clear whether they were discrete or
21
interconnected. We have made the same observation of both discrete
22
and interconnected voids in our study. Future work using direct
23
electron detectors and phase plates in electron microscopes will
24
enable sufficient image resolution to establish whether some of these
25
voids are in fact interconnected and to generate more complete model
26
of the PA membrane.
27
29 1
Figure 9 A schematic of features observed in 2-D cross-sections of
2
the PA layer. (A) A general schematic of the ridge-valley
3
structure. Individual features: (B) a nodule, (C) simple fold and
4
(D) a complex fold. STEM images show fragments of the PA layer
5
from top to PSf interface (white dashed line). The black, solid line
6
represents the 10 nm crumpled, but continuous (dotted line)
7
nano-film. Regions in grey can be interpreted as discrete holes.
8
White regions within the PA layer are interpreted as “channels”.
9
4.3. Sub-nanometer porosity
10
It has been suggested that nano-filtration through the membrane
11
occurs within the PA nano-film itself as a result of sub-nanometre
12
pores in the nano-film [4]. We attempted to visualise <1 nm diameter
13
permeation pores within the PA nano-film by imaging the precipitates
30
using high resolution HAADF-STEM. The diameter of observed stain
1
precipitates within the PA nano-film matches the pore sizes estimated
2
with PALS [22,25,28] and calculated from molecular dynamics [26].
3
4.4. Connections between structure and performance
4
With the new data presented here we formulate a more accurate
5
hypothesis about the behaviour of the PA structures in the aqueous
6
environment. It was previously suggested that an increase in swelling
7
correlates with increased permeability in membranes [37]. The
8
reported swelling of the RO membranes (given as the difference
9
between the thickness of wet and dry membranes observed in AFM)
10
is usually in the range of 10-20 nm, possibly due to the rigidity of the
11
cross-linked, aromatic PA [20,37,41]. If we take into account the
12
morphology revealed by FIB-SEM, a few different mechanisms
13
should be considered. These mechanisms may involve external-
14
(stretching) and/or internally-driven (ballooning) expansion of the PA
15
structures. Tentative mechanisms of swelling are sketched in Figure
16
10.
17
In the present study, we were able to visualise the penetration of water
18
in the PA by using a stain tracer and elucidated the impact of water on
19
tracer transport within the PA. We concluded that not all of the PA
20
surfaces are immediately accessible and confirmed that water plays an
21
important role in activating the free volume of the PA layer and
nano-22
film. In the case of stain permeation, two effects can be observed: the
23
opening of <1 nm pores within the PA nano-film and the opening of
24
the larger voids, which may be considered discrete in the dry state,
25
within the PA layer. Both phenomena might, in turn, facilitate ion
26
permeation through the PA layer.
31 1
Figure 10 Possible responses of the PA structures to the presence
2
of water. (A) The initial dry state. (B) Stretching – water acts
3
externally, elongating some structures, but preserving the original
4
shape the PA layer. (C) Ballooning – water acts internal filling
5
and expanding the free volume of the PA layer. (D) Combined –
6
water acts externally and internally.
7
5. Conclusions
8
In summary, the structural features of PA layer morphology in a
9
representative RO membrane at the micro- and nano-scale have been
10
visualised in 2-D and 3-D. The structural parameters of leaf-like
11
sheets at the micro-scale were quantified. Their relation to the
12
performance of membrane is discussed. Well-defined “channels”
13
within the nodules, which have not previously been reported on, were
14
imaged at the nano-scale. At the sub-nanometre scale, <1 nm pores
15
were imaged. We believe our nano-scale results support the
16
hypothesis that there is a nano-porous network underlying the
17
filtration mechanics of the polyamide layer, which may be visualised
18
using heavy metal staining. The staining in dry and wet conditions
32
also indicates the mechanism, by which water facilitates stain
1
permeation through the PA layer. Tomographic studies of stained
2
membranes provide new insight into the relationship between the
3
structure and the membrane performance and open new possibilities
4
for studying water flow and fouling in the vicinity of the PA layer in
5
silico.
6
Acknowledgments
7
This research was funded by the BP International Centre for
8
Advanced Materials (BP-ICAM). High resolution STEM imaging was
9
conducted at the SuperSTEM Laboratory, the U.K National Facility
10
for Aberration-Corrected STEM, supported by the Engineering and
11
Physical Sciences Research Council (EPSRC). We thank Prof.
12
Enrique Gomez for his helpful discussions.
13
References
14
[1] K.P. Lee, T.C. Arnot, D. Mattia, A review of reverse osmosis membrane materials for 15
desalination Development to date and future potential, J. Membr. Sci. 370 (2011) 1 22. 16
doi:10.1016/j.memsci.2010.12.036. 17
[2] M. Elimelech, W.A. Phillip, The Future of Seawater Desalination: Energy, Technology, and the 18
Environment, Science. 333 (2011) 712 717. doi:10.1126/science.1200488. 19
[3] R.J. Petersen, Composite reverse osmosis and nanofiltration membranes, J. Membr. Sci. 83 20
(1993) 81 150. 21
[4] T. Uemura, K. Kotera, M. Henmi, H. Tomioka, Membrane technology in seawater desalination: 22
History, recent developments and future prospects, Desalination Water Treat. 33 (2011) 283 23
288. doi:10.5004/dwt.2011.2646. 24
[5] D.G. Cahill, V. Freger, S.-Y. Kwak, Microscopy and microanalysis of reverse-osmosis and 25
nanofiltration membranes, MRS Bull. 33 (2008) 27 32. 26
[6] M. Kurihara, M. Hanakawa, Mega-ton Water System: Japanese national research and 27
development project on seawater desalination and wastewater reclamation, Desalination. 308 28
(2013) 131 137. doi:10.1016/j.desal.2012.07.038. 29
[7] C.Y. Tang, Y.-N. Kwon, J.O. Leckie, Probing the nano-and micro-scales of reverse osmosis 30
membranes a comprehensive characterization of physiochemical properties of uncoated and 31
coated membranes by XPS, TEM, ATR-FTIR, and streaming potential measurements, J. Membr. 32
Sci. 287 (2007) 146 156. 33
[8] Y.-N. Wang, J. Wei, Q. She, F. Pacheco, C.Y. Tang, Microscopic Characterization of FO/PRO 34
Membranes A Comparative Study of CLSM, TEM and SEM, Environ. Sci. Technol. (2012) 35
120827103647009. doi:10.1021/es301885m. 36
[9] S.-Y. Kwak, S.G. Jung, Y.S. Yoon, D.W. Ihm, Details of surface features in aromatic polyamide 37
reverse osmosis membranes characterized by scanning electron and atomic force microscopy, 38
33
[10] B. Mi, O. Coronell, B. Marinas, F. Watanabe, D. Cahill, I. Petrov, Physico-chemical 1
characterization of NF/RO membrane active layers by Rutherford backscattering spectrometry 2
, J. Membr. Sci. 282 (2006) 71 81. doi:10.1016/j.memsci.2006.05.015. 3
[11] Q. Li, X. Pan, C. Hou, Y. Jin, H. Dai, H. Wang, X. Zhao, X. Liu, Exploring the dependence of bulk 4
properties on surface chemistries and microstructures of commercially composite RO 5
membranes by novel characterization approaches, Desalination. 292 (2012) 9 18. 6
doi:10.1016/j.desal.2012.02.005. 7
[12] V. Freger, A. Bottino, G. Capannelli, M. Perry, V. Gitis, S. Belfer, Characterization of novel acid-8
stable NF membranes before and after exposure to acid using ATR-FTIR, TEM and AFM, J. 9
Membr. Sci. 256 (2005) 134 142. 10
[13] G.R. Guillen, Y. Pan, M. Li, E.M.V. Hoek, Preparation and Characterization of Membranes 11
Formed by Nonsolvent Induced Phase Separation: A Review, Ind. Eng. Chem. Res. 50 (2011) 12
3798 3817. doi:10.1021/ie101928r. 13
[14] F.A. Pacheco, I. Pinnau, M. Reinhard, J.O. Leckie, Characterization of isolated polyamide thin 14
films of RO and NF membranes using novel TEM techniques, J. Membr. Sci. 358 (2010) 51 59. 15
[15] S. Karan, Z. Jiang, A.G. Livingston, Sub 10 nm polyamide nanofilms with ultrafast solvent 16
transport for molecular separation, Science. 348 (2015) 1347 1351. 17
doi:10.1126/science.aaa1313. 18
[16] H. Yan, X. Miao, J. Xu, G. Pan, Y. Zhang, Y. Shi, M. Guo, Y. Liu, The porous structure of the fully-19
aromatic polyamide film in reverse osmosis membranes, J. Membr. Sci. 475 (2015) 504 510. 20
doi:10.1016/j.memsci.2014.10.052. 21
[17] C. Kong, A. koushima, T. Kamada, T. Shintani, M. Kanezashi, T. Yoshioka, T. Tsuru, Enhanced 22
performance of inorganic-polyamide nanocomposite membranes prepared by metal-alkoxide-23
assisted interfacial polymerization, J. Membr. Sci. 366 (2011) 382 388. 24
doi:10.1016/j.memsci.2010.10.026. 25
[18] T. Kamada, T. Ohara, T. Shintani, T. Tsuru, Optimizing the preparation of multi-layered 26
polyamide membrane via the addition of a co-solvent, J. Membr. Sci. 453 (2014) 489 497. 27
doi:10.1016/j.memsci.2013.11.028. 28
[19] F. Pacheco, R. Sougrat, M. Reinhard, J.O. Leckie, I. Pinnau, 3D visualization of the internal 29
nanostructure of polyamide thin films in RO membranes, J. Membr. Sci. (2015). 30
doi:10.1016/j.memsci.2015.10.061. 31
[20] L. Lin, R. Lopez, G.Z. Ramon, O. Coronell, Investigating the void structure of the polyamide 32
active layers of thin-film composite membranes, J. Membr. Sci. 497 (2016) 365 376. 33
doi:10.1016/j.memsci.2015.09.020. 34
[21] J.G. Wijmans, R.W. Baker, The solution-diffusion model: a review, J. Membr. Sci. 107 (1995) 35
1 21. 36
[22] T. Fujioka, N. Oshima, R. Suzuki, W.E. Price, L.D. Nghiem, Probing the internal structure of 37
reverse osmosis membranes by positron annihilation spectroscopy: Gaining more insight into 38
the transport of water and small solutes, J. Membr. Sci. 486 (2015) 106 118. 39
doi:10.1016/j.memsci.2015.02.007. 40
[23] S. Li, Z. Wang, C. Zhang, M. Wang, F. Yuan, J. Wang, S. Wang, Interfacially polymerized thin film 41
composite membranes containing ethylene oxide groups for CO2 separation, J. Membr. Sci. 42
436 (2013) 121 131. doi:10.1016/j.memsci.2013.02.038. 43
[24] J. Albo, J. Wang, T. Tsuru, Gas transport properties of interfacially polymerized polyamide 44
composite membranes under different pre-treatments and temperatures, J. Membr. Sci. 449 45
(2014) 109 118. doi:10.1016/j.memsci.2013.08.026. 46
[25] A. Shimazu, H. Goto, T. Shintani, M. Hirose, R. Suzuki, Y. Kobayashi, Vacancy profile in reverse 47
osmosis membranes studied by positron annihilation lifetime measurements and molecular 48
dynamics simulations, J. Phys. Conf. Ser. 443 (2013) 012050. doi:10.1088/1742-49
34
[26] V. Kolev, V. Freger, Hydration, porosity and water dynamics in the polyamide layer of reverse 1
osmosis membranes: A molecular dynamics study, Polymer. 55 (2014) 1420 1426. 2
doi:10.1016/j.polymer.2013.12.045. 3
[27] M D S F E T T P D O C 4
[28] M. Henmi, Y. Fusaoka, H. Tomioka, M. Kurihara, High performance RO membranes for 5
desalination and wastewater reclamation and their operation results, Water Sci. Technol. 62 6
(2010) 2134. doi:10.2166/wst.2010.396. 7
[29] K K L K -Kunst, B. Kunst, Porosity of some commercial reverse osmosis and 8
nanofiltration polyamide thin-film composite membranes, J. Membr. Sci. 168 (2000) 101 108. 9
[30] J. Stawikowska, A.G. Livingston, Nanoprobe imaging molecular scale pores in polymeric 10
membranes, J. Membr. Sci. 413-414 (2012) 1 16. doi:10.1016/j.memsci.2012.02.033. 11
[31] R W B R O M T A J W C ; New 12
York, 2004: pp. 191 235. 13
[32] M. Doube, BoneJ, (n.d.). http://bonej.org/thickness. 14
[33] W.S. Rasband, ImageJ, (1997). http://imagej.nih.gov/ij/. 15
[34] M. Doube, M.M. Klosowski, I. Arganda-Carreras, F.P. Cordelières, R.P. Dougherty, J.S. Jackson, 16
B. Schmid, J.R. Hutchinson, S.J. Shefelbine, BoneJ: Free and extensible bone image analysis in 17
ImageJ, Bone. 47 (2010) 1076 1079. doi:doi:10.1016/j.bone.2010.08.023. 18
[35] T. Hildebrand, P. Ruegsegger, A new method for the model-independent assessment of 19
thickness in three-dimensional images, J. Microsc. 185 (1997) 67 75. 20
[36] C.M. McGilvery, A.E. Goode, M.S.P. Shaffer, D.W. McComb, Contamination of holey/lacey 21
carbon films in STEM, Micron. 43 (2012) 450 455. doi:10.1016/j.micron.2011.10.026. 22
[37] V. Freger, Swelling and Morphology of the Skin Layer of Polyamide Composite Membranes: An 23
Atomic Force Microscopy Study, Environ. Sci. Technol. 38 (2004) 3168 3175. 24
doi:10.1021/es034815u. 25
[38] A.K. Ghosh, B.-H. Jeong, X. Huang, E.M.V. Hoek, Impacts of reaction and curing conditions on 26
polyamide composite reverse osmosis membrane properties, J. Membr. Sci. 311 (2008) 34 45. 27
doi:10.1016/j.memsci.2007.11.038. 28
[39] M.L. Lind, A.K. Ghosh, A. Jawor, X. Huang, W. Hou, Y. Yang, E.M.V. Hoek, Influence of Zeolite 29
Crystal Size on Zeolite-Polyamide Thin Film Nanocomposite Membranes, Langmuir. 25 (2009) 30
10139 10145. doi:10.1021/la900938x. 31
[40] J. Yin, E.-S. Kim, J. Yang, B. Deng, Fabrication of a novel thin-film nanocomposite (TFN) 32
membrane containing MCM-41 silica nanoparticles (NPs) for water purification, J. Membr. Sci. 33
423-424 (2012) 238 246. doi:10.1016/j.memsci.2012.08.020. 34
[41] E D K K V F P 35
Correlation to swelling revisited, Water Res. 49 (2014) 444 452. 36
doi:10.1016/j.watres.2013.10.029. 37
[42] J. Lee, A. Hill, S. Kentish, Formation of a thick aromatic polyamide membrane by interfacial 38
polymerisation, Sep. Purif. Technol. 104 (2013) 276 283. doi:10.1016/j.seppur.2012.11.015. 39
[43] J.S. Trent, J.I. Scheinbeim, P.R. Couchman, Ruthenium tetraoxide staining of polymers for 40
electron microscopy, Macromolecules. 16 (1983) 589 598. 41
[44] H. Sano, T. Usami, H. Nakagawa, Lamellar morphologies of melt-crystallized polyethylene, 42
isotactic polypropylene and ethylene-propylene copolymers by the RuO4 staining technique, 43
Polymer. 27 (1986) 1497 1504. 44
[45] H.. Haubruge, A.. Jonas, R. Legras, Staining of poly(ethylene terephthalate) by ruthenium 45
tetroxide, Polymer. 44 (2003) 3229 3234. doi:10.1016/S0032-3861(03)00255-6. 46
[46] T.M. Chou, P. Prayoonthong, A. Aitouchen, M. Libera, Nanoscale artifacts in RuO 4-stained poly 47
(styrene), Polymer. 43 (2002) 2085 2088. 48
[47] L.J.J.M. Janssen, K. te Nijenhuls, Encapsulation by interfacial polycondensation. I. The capsule 49
35
[48] F. Yuan, Z. Wang, X. Yu, Z. Wei, S. Li, J. Wang, S. Wang, Visualization of the Formation of 1
Interfacially Polymerized Film by an Optical Contact Angle Measuring Device, J. Phys. Chem. C. 2
116 (2012) 11496 11506. doi:10.1021/jp210209v. 3
[49] P.A. Midgley, R.E. Dunin-Borkowski, Electron tomography and holography in materials science, 4
Nat. Mater. 8 (2009) 271 280. doi:10.1038/nmat2406. 5
[50] C.A. Diebolder, A.J. Koster, R.I. Koning, Pushing the resolution limits in cryo electron 6
tomography of biological structures: PUSHING THE RESOLUTION LIMITS IN CRYO ELECTRON 7
TOMOGRAPHY, J. Microsc. 248 (2012) 1 5. doi:10.1111/j.1365-2818.2012.03627.x. 8
9
10