adfa, p. 1, 2011.
© Springer-Verlag Berlin Heidelberg 2011
Evaluating the Social Acceptability of Voice Based
Smartwatch Search
Christos Efthymiou, Martin Halvey
Department of Computer and Information Sciences, University of Strathclyde, Glasgow, UK [email protected], [email protected]
Abstract. There has been a recent increase in the number of wearable (e.g. smartwatch, interactive glasses, etc.) devices available. Coupled with this there has been a surge in the number of searches that occur on mobile devices. Given these trends it is inevitable that search will become a part of wearable interac-tion. Given the form factor and display capabilities of wearables this will prob-ably require a different type of search interaction to what is currently used in mobile search. This paper presents the results of a user study focusing on users’ perceptions of the use of smartwatches for search. We pay particular attention to social acceptability of different search scenarios, focussing on input method, device form and information need. Our findings indicate that audience and loca-tion heavily influence whether people will perform a voice based search. The results will help search system developers to support search on smartwatches.
Keywords: Smartwatch, Acceptability, Voice, Search, Information Need
1
Introduction
user) and in particular on querying using a smartwatch where input is predominantly voice based. Specifically we focus on the following research questions:
RQ1: Does information need determine when and where an individual would use a smartwatch for search?
RQ2: Does the form factor of the device determine when and where an individual would use a smartwatch for search?
RQ3: Does the input method determine when and where an individual would use a smartwatch for search?
RQ4: Does the expression of information need determine when and where an indi-vidual would use a smartwatch for search?
To address these research questions a lab based user study following a methodolo-gy proposed by Rico et al. [2] was conducted; videos depicting various interaction scenarios (in our case users searching on mobile devices i.e. phone and smartwatch) were presented and participant responses were elicited. The aim was to gather user perceptions of the social acceptability of the specific scenarios presented.
2
Related Work
2.1 Mobile Search Behaviour
some researchers have begun to look at card based retrieval and in particular how they are influenced by social situations [1]. Most wearable search systems operate a com-bination of reactive and proactive card based retrieval systems. This does not elimi-nate the need for reactive search and some sort of input e.g. systems like Siri and Cortana encourage voice input and a dialogue with the system.
2.2 Social Acceptability
Rico and Brewster [2] investigated the social acceptability of a set of gestures for interacting with mobile devices with respect to location and the audience. Within the area of wearables, Schaar and Ziefle [11] evaluated the acceptance of smart shirts in men and women and found that men were more accepting of the technology than women. Shinohara and Wobbrock [12] looked at the perception of a variety of users of assistive technology. Whilst this technology was extremely useful, some of partici-pants felt stigmatised by their assistive technology. A study looking at the privacy behaviour of life loggers [13] found that for life loggers a combination of factors in-cluding time, location, and the objects and people appearing in a photo determines its 'sensitivity;' and that life loggers are concerned about the privacy of bystanders. Spe-cifically for smartwatches, Pearson et al. [14] investigated the interaction and the process of attracting attention when glancing at someone else’s watch. Bystanders not only could notice the information and content on someone else’s smartwatch screen, but they were likely to interact with the wearer and tell them about information pre-sented on their smartwatch screen. Moorthy and Vu [15] conducted an evaluation of the use of a Voice Activated Personal Assistant in the public space. Users were quite careful to reveal their private information in front of strangers and less careful with their non-private information. This behaviour difference was heightened in public locations and especially when obvious methods were used for information input.
3
User Evaluation
3.1 Information Need Survey
28 (33.7%) had a medium level of experience and 44 (53%) indicated that they have high experience. The mobile information needs provided were analysed. Similar to the information needs analysis by Church et al. [5] there were a large number of in-formational information needs (79.4%), some transactional (17.8%) and very little navigational (2.73%). Initially the categories from Church et al. [5] were used for categorisation, but they did not appear to capture the information needs sufficiently well, so instead bottom up categorisation of information needs was created. One key difference between our work and that of Church et al. [5] is Church et al. used log analysis and our participants may be reluctant to outline some of their information needs e.g. Adult. This resulted in 11 categories, which were slightly different from those of Church et al., e.g. News and Weather featured in our categories, but Adult did not. Also News and Weather whilst common were not amongst the most popular categories. The three most popular categories were Directions, Entertainment and General Search (used interchangeably with Search with a capital S in parts of the paper), we use these in our user study. For reasons of space and as it is not the focus of the paper we do not go into detail about the categorisation. Our aim was to have representative information needs which could be used in our user study.
[image:4.595.182.422.387.500.2]3.2 Procedure
Fig. 1. Screenshots from example videos.
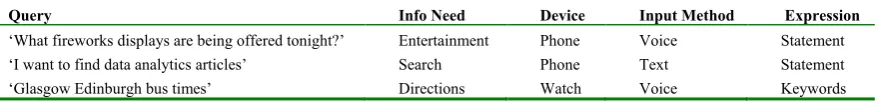
Table 1. Example queries and conditions, not all are shown for reasons of space.
Query Info Need Device Input Method Expression
‘What fireworks displays are being offered tonight?’ Entertainment Phone Voice Statement ‘I want to find data analytics articles’ Search Phone Text Statement
‘Glasgow Edinburgh bus times’ Directions Watch Voice Keywords
[image:4.595.85.524.532.583.2]pair) and an expression type (Statement, Keyword). Information needs were based on the real information needs gathered in the online survey (see Section 3.1). Device allowed us to compare smartwatch and phone; mobile phones are the most common way for people to currently search whilst mobile. Input method allows comparison between the more common text entry and voice input. Three pairs were used, text entry on a smartwatch was omitted. Text entry on such a small screen is impractical and remains an area of open research [17]. Finally expression of the query could be a statement or in the form of keywords. For many voice based systems querying with statements is common e.g. to view your steps on an Android device the statement is “okay Google, show me my steps”. Whereas for text based search keywords are more prevalent. Keywords were the keywords provided by respondents and the statements were the single sentence that we requested. Before beginning participants were told the aim of the study was to assess the social acceptability of different mobile searches.
each instance of each variable (e.g. compare all audiences for directions information needs) following Rico and Brewster [2].
3.3 Participants
There were 20 participants in our user study with age range from 23 to 32 and av-erage age 25.15. Participants were mostly recruited from the University of Strath-clyde. All of the participants lived in the UK and spoke English, but were from a range of countries. 5 (25%) of the participants were female and 15 (75%) were male.
4
Results
[image:6.595.132.464.343.399.2]4.1 Information Need
Table 2. Average acceptance rates for different Information Needs by location.
Home Driv. Pub Pave. Pass. Work
Enter. 88% 31% 32% 53% 40% 22%
Search 95% 18% 16% 36% 38% 41%
Direc. 94% 38% 28% 63% 58% 33%
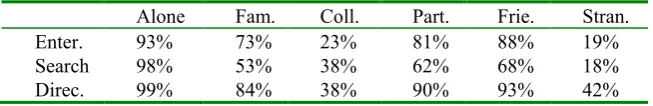
Table 3. Average acceptance rates for different Information Needs by audience.
Alone Fam. Coll. Part. Frie. Stran.
Enter. 93% 73% 23% 81% 88% 19%
Search 98% 53% 38% 62% 68% 18%
Direc. 99% 84% 38% 90% 93% 42%
A Friedman Test revealed significance for information needs have significant effect on location (X2(2)=27.966, p<0.001) (see Table 2). Pairwise comparisons with a
Wil-coxon Sign Rank test (Bonferroni adjusted alpha p = 0.0167) revealed significant differences between Directions and Entertainment (z=-3.495, p<0.001) as well as Directions and Search (z=-5.215, p<0.001). With respect to audience (see Table 3) there was also a significant difference for information need (X2(2) =78.072, p<0.001).
[image:6.595.135.462.427.480.2]Searching and Entertainment there were differences in audience for Partner (p=0.001) and Friends (p=0.001). Finally for Entertainment and Directions there was a differ-ence for Strangers (p=0.001). Overall Directions was the most acceptable, followed by Entertainment and General Search being the least acceptable for all audiences.
Looking at each information need individually. For Entertainment, Home was the most acceptable search location (see Table 2) and is significantly more acceptable than any other location (p<0.001 for all comparisons). Pavement is a more acceptable location than Driving (p=0.001), Pub (p=0.001) or the Workplace (p<0.001). Work-place is also less acceptable than being a Passenger. With respect to Audience, search-ing for Entertainment related information is least acceptable in front of Strangers, which is significantly different to Alone (p<0.001), Family (p<0.001), Partner (p<0.001) or Friends (p<0.001). Searching Alone is also significantly different to in front of Colleagues (p<0.001) or Family (p<0.001), Alone is seen as the most ac-ceptable audience (see Table 3). Colleagues as an audience is also significantly less acceptable than in front of Family (p<0.001), Partners (p<0.001) or Friends (p<0.001). Family and Friends also has a significant difference (p<0.001).
In terms of the Searching category there were significant differences between the acceptability of almost all locations. There was no significant difference for Work-place with Pavement (p=0.446) and Passenger (p=0.579). For Passenger there was no significant difference with Pavement (p=0.670). All of these locations were mid-range in terms of acceptability compared to other locations (see Table 2). Pub and Driving were not significantly different (p=0.732), both were seen as the least acceptable (see Table 2). Similarly for audience with respect to search most audiences had signifi-cantly different acceptance rates. Family had similar acceptance to Colleagues (p=0.024) and Partner (p=0.068). With Partner also having a similar acceptance rate to Friends (p=0.131).
With respect to Directions, the majority of locations had significantly different ac-ceptance rates. Workplace had a similar acac-ceptance level to Driving (p=0.327) and Pub (p=0.355). Pub and Driving also had similar acceptance rates (p=0.085). All had low acceptance rates in comparison to other locations. Passenger and Pavement also had non-significant differences in terms of acceptance rate (p=0.257). In terms of audience, there were less significant differences for Directions, with relatively high acceptance rates. That being said the most acceptable audiences Alone was more ac-ceptable than Family (p<0.001), Colleagues (p<0.001), Partner (p=0.002) and Strangers (p<0.001). Strangers the least acceptable audience was also significantly less acceptable than Family (p<0.001), Partner (p<0.001) and Friends (p<0.001). Col-leagues which was the second least acceptable audience and was significantly less acceptable than Partner (p<0.001), Friends (p<0.001) and Family (p<0.001).
4.2 Device
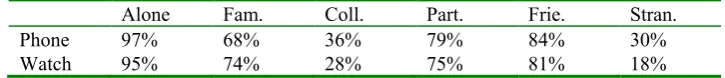
Sign Rank test (Bonferroni adjusted alpha p = 0.004) and the only significant differ-ence was for the Driving location (z=4.808, p<0.001), with using a Watch whilst Driving being more acceptable than a Phone. Although not significant the use of Watch rather than Phone for searching was more acceptable in front of Family (z=2.252, p=0.024).We also performed pairwise comparisons individually for both the Phone and Watch variables between every location and audience (Bonferroni adjusted alpha p=0.003). For reasons of space we do not present all of the results but rather summarise them here. Looking at Phone first, there were significant differences between all locations with the exception of Driving-Pub (p=0.088), Pavement-Passenger (p=1.0) and Workplace-Pub (p=0.083). In terms of audience, again for Phone almost all audiences are significantly different, the exceptions being Friends-Partner (p=0.02) and Colleagues-Strangers (p=0.107). Next looking at pairwise com-parisons within the Watch variable we see that for location that Driving is as accepta-ble as on Pavement (p=0.317) or as a Passenger (p=0.121) and that Workplace is as acceptable as Pub (p=0.303) or Passenger (p=0.063). Searching in front of Friends (p=0.059) and Partners (p=0.819) is as acceptable as Family, with Friends and Part-ners also being similarly acceptable (p=0.162). With searching in front of Strangers and Colleagues also being similarly acceptable (p=0.04)
Table 4. Average acceptance rates for Phone versus Watch by location.
Home Driv. Pub Pave. Pass. Work
Phone 96% 21% 28% 51% 51% 36%
Watch 85% 44% 18% 50% 34% 23%
Table 5. Average acceptance rates for Phone versus Watch by audience.
Alone Fam. Coll. Part. Frie. Stran.
Phone 97% 68% 36% 79% 84% 30%
Watch 95% 74% 28% 75% 81% 18%
4.3 Input Method
[image:8.595.115.478.462.501.2]well as no difference between Strangers and Colleagues (p=0.752). Looking at Voice input, between locations there are no significant differences for Driving with Pave-ment (p=0.03) and Passenger (0.514), and also between Pub and Workplace (p=0.659). As for audience, Partner has no significant difference with Family (p=0.024) and Friends (p=0.101), and there is no significant differences between Strangers and Colleagues (p=0.003).
Table 6. Average acceptance rates for Voice versus Text input by location.
Home Driv. Pub Pave. Pass. Work
Text 98% 12% 34% 58% 67% 51%
[image:9.595.118.475.317.356.2]Voice 90% 38% 20% 47% 35% 22%
Table 7. Average acceptance rates for Coice versus Text input by audience.
Alone Fam. Coll. Part. Frie. Stran.
Text 98% 68% 48% 77% 84% 47%
Voice 96% 71% 26% 78% 83% 16%
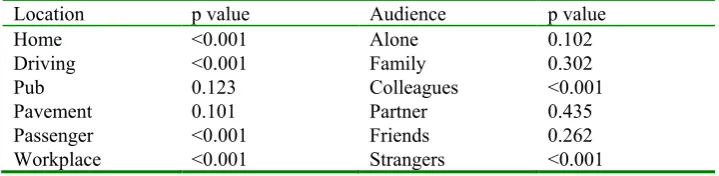
Table 8. Pairwise comparison between Text and Voice for every location and audience. Significance value set using a Bonferroni correction at p = 0.004.
Location p value Audience p value
Home <0.001 Alone 0.102
Driving <0.001 Family 0.302
Pub 0.123 Colleagues <0.001
Pavement 0.101 Partner 0.435
Passenger <0.001 Friends 0.262
Workplace <0.001 Strangers <0.001
4.4 Expression
[image:9.595.118.478.398.486.2](p=0.642). In terms of audience, for Keywords, there is no significant difference for Partner with Family (p=0.071) and Friends (p=0.201); as well as no significant differ-ence between Strangers and Colleagues (p=0.170).
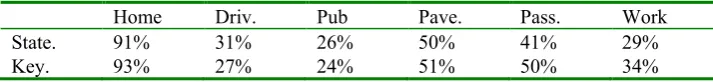
Table 9. Average acceptance rates for Statements versus Keywords by location.
Home Driv. Pub Pave. Pass. Work
State. 91% 31% 26% 50% 41% 29%
Key. 93% 27% 24% 51% 50% 34%
Table 10. Average acceptance rates for Statements versus Keywords by audience.
Alone Fam. Coll. Part. Frie. Stran.
State. 96% 64% 34% 73% 81% 25%
Key. 97% 76% 33% 82% 86% 28%
5
DISCUSSION
Information Need (RQ1): Analysis of the information needs provided in our online survey revealed that as Church found [5] there are a large number of informa-tional mobile queries. The three most common categories from our analysis of mobile information needs were used for comparison in our in lab user study; those being Entertainment, Directions and General Search. There was a significant difference in terms of acceptability between all of the information needs. Directions, Entertainment and General Search were all viewed as being most to least acceptable in order. These information needs can be viewed as having a temporal aspect (Directions having an immediate temporal aspect). Also Directions and then Entertainment could be viewed as being easily displayed on the small screen of a smartwatch. In terms of audience questionnaire responses indicated that people are comfortable searching Alone. When they search in front of others they would rather do so in front of familiar audiences like Friends or Family, with searching for any information need in front of Strangers seen as being unacceptable. Some of the reasons for this are highlighted in the post evaluation interview, with issues of appearing strange and also privacy being high-lighted as major concerns. With respect to location of performing a search again there are major differences, locations where a person might be alone or not actively en-gaged in other activities (i.e. Passenger and Pavement) are most acceptable for all information needs. The Workplace location has a different distribution to other loca-tions, in that it is the only location where General Search is seen as being most ac-ceptable in comparison to other locations.
[image:10.595.119.478.281.320.2]rela-tively new technology this difference in acceptability may even out as smartwatches become more mainstream.
Input Method (RQ3): In our study location did not have a significant effect on acceptability. However pairwise comparisons revealed a difference between Home, Driving, Passenger and Workplace; with Text being more acceptable in all those loca-tions except Driving. There was significant effect of audience in terms of acceptabil-ity. For Colleagues and Strangers Text was significantly more acceptable than Voice. One interesting thing to note was that for Partner, Family and Friend audience’s Voice was slightly more acceptable than Text. The audiences that are familiar to the participants seem to be more acceptable for Voice, whereas those with unfamiliar people Voice becomes a more unacceptable input method.
Expression (RQ4): In general Keywords are more acceptable than Statements. However as with Input Method, location did not have a significant effect on the ac-ceptability of using Statements or Keywords. In contrast Audience did have a signifi-cant effect. The only signifisignifi-cant pairwise difference was for the Partner audience, with Keywords being more acceptable than Statements. Overall expression appears to have less of an impact than any of the other variables that we investigated.
6
Conclusion
Wearable technology and also voice based search are relatively new technologies for many people. These technologies open up new possibilities for search interaction whilst mobile. In comparison with more traditional desktop based search this also creates a range of new possibilities, but also factors that must be taken into account, for designing search interactions. In this paper we have focussed on social acceptabil-ity issues surrounding using voice based reactive search with smartwatches and also mobile phones. We conducted a lab study where we presented participants with vari-ous search scenarios and solicited responses to the acceptability of those scenarios. Overall these findings explain some of the reluctance for search to move beyond text input on mobile phones. This also validates some of the move towards card based proactive search, where the device displays “results” without a query. Our findings also demonstrate that there are some cases/locations/audiences where different ways of searching might be preferable. It is not yet possible to completely remove proactive search with user input, thus it is important to understand all of the factors that influ-ence search interaction. This work is a first step in that direction and the results here provide some guidance on the types of information needs and scenarios that require proactive search and those that might be better served by reactive. A combination of both may ultimately provide the best user experience.
7
References
2. Rico, J., Brewster, S.: Usable gestures for mobile interfaces: evaluating social acceptability. 28th ACM Conference Conference on Human Factors in Computing Systems, pp. 887-896. (2010)
3. Jones, M., Buchanan, G., Thimbleby, H.: Improving web search on small screen devices. Interacting with Computers 15,479-495 (2003)
4. Church, K., Smyth, B., Bradley, K., Cotter, P.: A large scale study of European mobile search behaviour. 10th international conference on Human computer interaction with mobile devices and services, pp. 13-22. (2008)
5. Broder, A.: A taxonomy of web search. ACM Sigir forum, pp. 3-10. ACM, (2002) 6. Church, K., Cousin, A., Oliver, N.: I wanted to settle a bet!: understanding why and how
people use mobile search in social settings. 14th international conference on Human-computer interaction with mobile devices and services, pp. 393-402. (2012)
7. Church, K., Neumann, J., Cherubini, M., Oliver, N.: SocialSearchBrowser: a novel mobile search and information discovery tool. In: Proceedings of the 15th international conference on Intelligent user interfaces, pp. 101-110. (2012)
8. Ren, Y., Tomko, M., Ong, K., Sanderson, M.: How people use the web in large indoor spaces. 23rd ACM International Conference on Conference on Information and Knowledge Management, pp. 1879-1882. (2014)
9. Church, K., Cramer, H.: Understanding Requirements of Place in Local Search. 33rd Annual ACM Conference Extended Abstracts on Human Factors in Computing Systems, pp. 1857-1862. (2015)
10. Montañez, G.D., White, R.W., Huang, X.: Cross-device search. 23rd ACM Conference on Conference on Information and Knowledge Management, pp. 1669-1678. (2015)
11. Schaar, A.K., Ziefle, M.: Smart clothing: Perceived benefits vs. perceived fears. 5th IEEE Pervasive Computing Technologies for Healthcare, pp. 601-608. (2011)
12. Shinohara, K., Wobbrock, J.O.: In the shadow of misperception: assistive technology use and social interactions. 29th ACM Conference Conference on Human Factors in Computing Systems, pp. 705-714. (2011)
13. Hoyle, R., Templeman, R., Armes, S., Anthony, D., Crandall, D., Kapadia, A.: Privacy behaviors of lifeloggers using wearable cameras. ACM International Joint Conference on Pervasive and Ubiquitous Computing, pp. 571-582. (2014)
14. Pearson, J., Robinson, S., Jones, M.: It's About Time: Smartwatches as Public Displays. 33rd ACM Conference Conference on Human Factors in Computing Systems, pp. 1257-1266. (2015)
15. Easwara Moorthy, A., Vu, K.-P.L.: Privacy Concerns for Use of Voice Activated Personal Assistant in the Public Space. International Journal of Human-Computer Interaction 31, 307-335 (2015)
16. Wakeling, S., Halvey, M., Villa, R., Hasler, L.: A Comparison of Primary and Secondary Relevance Judgements for Real-Life Topics. ACM SIGIR Conference on Human Information Interaction and Retrieval, pp. 173-182. (2016)
17. Leiva, L.A., Sahami, A., Catalá, A., Henze, N., Schmidt, A.: Text Entry on Tiny QWERTY Soft Keyboards. 33rd Annual ACM Conference on Human Factors in Computing Systems, pp. 669-678. (2015)