1
Benchmarking the environmental performance
of supply chains through eco-intensity
Andrea Tuni ([email protected])
Department of Design Manufacture and Engineering Management, University of Strathclyde, 75 Montrose Street, G1 1XJ, Glasgow, United Kingdom
Athanasios Rentizelas
Department of Design Manufacture and Engineering Management, University of Strathclyde, 75 Montrose Street, G1 1XJ, Glasgow, United Kingdom
Abstract
The majority of the environmental impacts in a typical supply chain arises beyond the focal firm, thus the need to quantify the environmental performance of extended supply chain. This work aims to introduce a quantitative approach to assess the eco-intensity of products considering the extended supply chain by adopting a decentralized recursive mechanism. The model is validated through a numerical example of a fictitious supply chain adopting secondary data. Products are benchmarked on the basis of their CO2
emissions and water consumption eco-intensity, allowing more informed and sustainable purchasing decisions by customers.
Keywords: Eco-intensity, Recursive indicators, Extended supply chains
Introduction
A number of stakeholders are pushing companies to include environmental concerns within their supply chain in response to emerging issues such as climate change, global warming and scarce natural resources (Björklund et al., 2012). These stakeholders include governmental bodies applying stricter regulatory requirements, green customers as well as non-governmental organizations and local communities calling for transparency of companies’ practices and adequate reporting about environmental and social impact caused by production activities (Björklund et al., 2012; Gerbens-Leenes et al., 2003). These pressures, that initially targeted single organisations, later expanded to supply chains accordingly with the shift in the competitive environment from a company-versus-company format to a supply chain-versus-supply chain. This led to increased outsourcing and offshoring practices of production processes to countries with low production cost and less strict environmental regulations and standards (Cabral et al., 2012; Harris et al., 2011; Reefke and Trocchi, 2013). Additionally, there is evidence that the majority of environmental impacts in the supply chain does not arise in the focal firms boundaries but is caused by other companies in the supply chain that can account for up to 90% of the overall environmental impact of the supply chain (Beavis, 2015; Veleva et al., 2003; WBCSD and WRI, 2009).
2
existing supply chain environmental performance measurement methods are primarily focused on the focal firms having an excessively narrowed scope (Ahi and Searcy, 2015; Beske-Janssen et al., 2015). This work thus aims to introduce an innovative quantitative approach to measure the environmental performances of an extended supply chain, as part of eco-intensity indicators that include traditional economic performance as well, which allows benchmarking the environmental performance of products and supply chains.
Literature review
Benchmarking environmental performance of supply chains
Benchmarking is “a process of defining operational measures of performance and appraising firms or supply chains with respect to selected measures” (Yakovleva et al., 2012). This process can be performed either against the nearest competitor or industry averages (Genovese et al., 2013). Without a real opportunity to compare performance, including environmental performance, there is the risk that the evaluation of the performance is self-referential.
Benchmarking has been widely used in business for continuous improvement, total quality management and competitive advantage (Yakovleva et al., 2012). Benchmarking has been extensively adopted at the single organisation level for economic performance, whereas the lack of a global standard for benchmarking environmental performance has been observed (Genovese et al., 2013). Organisations still often stand at the beginning of the path towards sustainability and thus focus on what environmental performance aspects need to be measured, rather than comparing their performance against competitors or industry standards. Benchmarking performance shows a more mature approach towards sustainability and typically follows in time (Shaw et al., 2010).
Moreover, benchmarking at the supply chain level still lags behind benchmarking at the single company level, due to increased complexity, and there is still a “need of international benchmarking of supply chain performance” (Gopal and Thakkar, 2012). The SCOR model has been introduced to overcome this limitation obtaining wide acceptance by industry. Version 11.0 of the model included for the first time a pilot section about environmental performance measurement, called the Green SCOR (APICS, 2014). This part however still needs to be validated from the SCOR panel before being formally included in the model. As a result, there is currently no existing method tailored for benchmarking the environmental performance of supply chain, as other popular tools, such as the Global Reporting Initiative (GRI), the leading reporting scheme for environmental performance, are tailored for the single organisation level and show limited applicability to the supply chain context (Ahi and Searcy, 2014). Additionally the scope of the method is mostly on disclosure of data, with a dominant descriptive part, rather than on the evaluation of the sustainable performance itself (Angelakoglou and Gaidajis, 2015; O’Rourke, 2014).
3 Eco-intensity and eco-efficiency of supply chains
Eco-efficiency and eco-intensity combine the environmental and economic dimensions of sustainability in a unique index. Eco-efficiency is described as “the efficiency with which ecological resources are used to meet human needs” by the Organisation for Economic Co-Operation and Development (OECD) and is a ratio of the economic value created and the sum of environmental pressures generated by an economic activity (WBCSD, 2000). Eco-intensity reverses the ratio, being the environmental impact divided by the economic benefit generated by an economic activity (Schmidt and Schwegler, 2008). Both concepts of eco-efficiency and eco-intensity are applicable to different systems, however eco-intensity was identified as more suitable to the supply chain context from a mathematical perspective thanks to the positioning of environmental values at the numerator, which simplifies calculations when multiple organisations are involved (Schmidt and Schwegler, 2008).
Despite this evidence, only few examples of eco-intensity models exist in the supply chain literature, with a limited scope in terms of environmental performances addressed. Joa et al. (2014) propose a recursive indicator to measure the water eco-intensity of the supply chain adopting a similar approach to an earlier work by Schmidt and Schwegler (2008), whose contribution remains on a theoretical level, not identifying the environmental measurements that need to be considered in the calculation of eco-intensity.
On the other hand, eco-efficiency models applied in the supply chain context are more frequent in the literature, being implemented for different managerial decisions falling within the boundaries of green supply chain management (GSCM). A number of authors adopted eco-efficiency scores to select and evaluate suppliers, thus naturally limiting their focus to 1st tier suppliers only. Examples include the work by Tseng et al. (2013) and Mahdiloo et al. (2015). Former authors use a set of eco-efficiency criteria translating linguistic variables into quantitative number thanks to fuzzy sets: suppliers are subsequently ranked according to TODIM method. The latter work is based instead on a data envelopment analysis (DEA) methodology, which is combined with multi-objective linear programming to recognise eco-efficient DMUs that do not perform efficiently from an economic or environmental perspective. The supplier selection and evaluation problem is expanded to other supply chain members belonging to different supply chain tiers by Wu and Barnes (2016), that use an eco-efficiency score to evaluate different supply chain configurations and solve the green lot-sizing problem. Colicchia et al. (2015) address a similar problem focusing on the downstream part of the network, which is optimised according to an eco-efficient objective function consisting of cost and CO2 emissions.
Other authors remove the constraints of focusing on a limited part of the supply chain by adopting a lifecycle perspective, such as Charmondusit et al. (2014), Michelsen et al. (2006), Michelsen and Fet (2010) and Saling et al. (2002). Michelsen, along with other scholars, calculate eco-efficiency as a ratio of life cycle costing and life cycle assessment (LCA) indicators. The inclusion of different environmental indicators is performed by Saling et al. (2002) through aggregation and normalisation of different indicators in order to assess possible alternatives for dyeing supply chain of jeans. The methodological steps are performed taking into account both the wider impact to the environment in a macro perspective along with the internal viewpoint of experts and decision makers. Finally, Charmondusit et al. (2014) are the only scholars including the social dimension of sustainability within their socio-eco-efficiency index for the toy industry.
4
different scenarios within the same supply chain, as Colicchia et al. (2015), Mahdiloo et al. (2015), Michelsen et al. (2006), Michelsen and Fet (2010), Saling et al. (2002) and Wu and Barnes (2016) demonstrate. Despite an attempt by Michelsen et al. (2006) to facilitate external comparison by adopting external normalisation and weighting factors, all models above mentioned are self-referential and no model proposed by the literature effectively compares and benchmark supply chains of different products.
This work thus aims to introduce a quantitative approach to assess the eco-intensity of products considering the extended supply chain by adopting a decentralised recursive mechanism, which allows benchmarking products based on their CO2 emissions and
water consumption eco-intensity. This approach:
1. Expands the coverage of the supply chain environmental performance measurement systems available in the literature in terms of supply chain extent paving the way for an effective supply chain-wide environmental assessment, 2. Benchmarks different product-supply chains according to their eco-intensities,
removing constraints introduced by functional units thanks to a clear system boundary definition and a cradle-to-gate approach, which avoids assumptions about the usage phase of products.
Methodology Model
The eco-intensity model introduced in this section is developed for forward supply chains and uses a cradle-to-gate approach. The usage and end-of-life management phases of products are thus omitted. The model provides two major outputs: single company eco-intensities specific to each environmental indicator and supply chain eco-eco-intensities specific to the single environmental indicator.
Four methodological steps are performed in cascade:
1. Definition of the system boundaries: the “transformation model” by Slack et al., (2009) is adopted as the basis to define the boundaries of the supply chain. According to the model, resources can be classified as transformed resources which will be treated, transformed or converted in some way during the production process, such as the raw materials, and the “transforming resources” which will facilitate the whole process, such as the facilities, the equipment and the machineries necessary to transform the products. The boundaries of the supply chain in this work are strictly defined according to the transformed resources, thus coinciding with the material flow from the raw material stage down to the gate between the last tier on the chain and the final user. The environmental impact of transforming resources is included with respect to their usage in the production processes taking place along the supply chain as part of the direct impact of each company building the supply chain. No impact of the supply chain of transforming resources is considered.
5 tonnes CO2e/year).
3. Inclusion of economic dimension: a unique economic indicator is included in the model which is the yearly turnover of the company. The selection of turnover as the only economic indicator is determined by the specificity of the supply chain environment, where companies may not be willing to share confidential information such as costs, profit and net present value with other supply chain players (Brandenburg, 2015; Caro et al., 2013). On the contrary, turnover is typically publicly available and is thus applicable even to non-cooperative supply chains (Schmidt and Schwegler, 2008). At the end of this step the single company eco-intensity referring to each specific environmental indicator is calculated, which can be adopted in the green supplier selection and evaluation process. In collaborative supply chains, this data is also applicable in the identification of hotspots along the supply chain in order to prioritise operational improvement.
4. Recursive mechanism: the mathemathical formulation, detailed in equation 1, allows to pass the environmental backpack along the supply chain moving accordingly with the material flow from upstream to downstream. Each tier of the supply chain passes the calculated eco-intensity to its customer till the last player in the chain is reached.
𝐸𝐼𝑖𝑘 = 𝑇1
𝑖𝑘 (𝐸𝑖+ ∑𝑗 ∊ 𝑆𝑢𝑝𝑝𝑙𝑖𝑒𝑟 (𝑖)𝐸𝐼𝑗 ∑𝑘 ∊ 𝑆𝑢𝑝𝑝𝑙𝑖𝑒𝑠 (𝑗→𝑖) 𝑄𝑖𝑗𝑘𝑃𝑗𝑘) (1)
Where 𝐸𝐼𝑖𝑘 is the eco-intensity of the company i for the supply chain of k product, 𝑇𝑖𝑘 is the amount of turnover of company i generated by product k, whereas 𝐸𝑖 is
the direct environmental impact of organisation i at the company level. The direct environmental impact in equation 1 can refer to any single environmental indicator out of the seven identified at step 2. Finally 𝐸𝐼𝑗 is the eco-intensity of the j-th supplier and 𝑄𝑖𝑗𝑘 is the quantity of product k being acquired by company i from supplier j at the price 𝑃𝑗𝑘. The two last terms of the equation are ideal in practical
applications where the customers have this information ready available, thus requiring the supplier to provide only the value of its own eco-intensity 𝐸𝐼𝑗.
However, these terms can be substituted in a theoretical application by 𝑇𝑖𝑗𝑘, which is the amount of turnover of supplier j generated by transactions to customer i for the product k, as outlined in equation 2.
𝐸𝐼𝑖𝑘 = 𝑇1
𝑖𝑘 (𝐸𝑖+ ∑𝑗 ∊ 𝑆𝑢𝑝𝑝𝑙𝑖𝑒𝑟 (𝑖)𝐸𝐼𝑗 ∑𝑘 ∊ 𝑆𝑢𝑝𝑝𝑙𝑖𝑒𝑠 (𝑗→𝑖) 𝑇𝑖𝑗𝑘) (2)
Once the process is completed and the eco-intensity of the entire supply chain is calculated including the direct impact of the most downstream player in the chain, the second output of the model is calculated, which is the eco-intensity of the supply chain referring to each specific environmental indicator. In this example, water consumption eco-intensity of the supply chain and CO2 emissions eco-intensity of the supply chain are
calculated.
6 Data
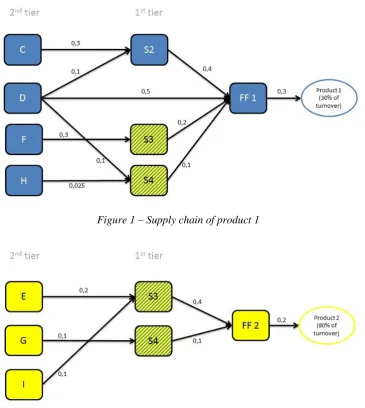
The model was applied to a fictitious supply network, which includes two different supply chains, in order to validate the model with secondary data and provide a numerical example to showcase the applicability of the model. Supply chain 1, whose final product 1 is delivered by focal firm 1 (FF1), is portrayed separately in figure 1, whereas supply chain 2, whose final product 2 is offered by focal firm 2 (FF2), is depicted in figure 2. Each company is represented as a box in the figures, whose colours mirror the focal firm served by each organisation. Blue colour is used for companies being part of the supply chain of FF1, yellow for companies being part of the supply chain of FF2. A yellow-blue striped pattern is adopted for S3 and S4, the only companies that are part of both supply chains.
[image:6.595.119.485.253.662.2]Figure 1 – Supply chain of product 1
Figure 2 – Supply chain of product 2
7
Secondary data were adopted to validate the model in this work. Turnover ($M/year) and CO2 emissions (metric tonnes CO2e/year) values were obtained from publicly
available databases of existing companies, whereas the water consumption values (m3/year) were gathered from a dedicated work available in the literature. All data are on a yearly basis at the company level. Data do not mirror real supply chains as CO2
emissions and water consumptions values for each company do not correspond to the same real company. Moreover, supply chain links as well as their entity are also entirely fictitious as companies may belong to different sectors and business relations between companies may not exist.
Results
The eco-intensity of all companies part of the supply network are illustrated in Table 1. These values represent the eco-intensity performances of each organisation at the single company level, without the inclusion of any environmental backpack of the upstream supply chain and are calculated simply by dividing the yearly CO2 emissions (or water
consumption) of the company by its yearly turnover. Results show a high variety in values, spanning from a minimum of 0.00047 metric tonnes CO2e per $M for company E
up to a maximum of 0.17822 for S2. G is the best performing organisation in terms of water consumption eco-intensity with 0.00003 m3 per $M, whereas F is at the opposite
[image:7.595.88.510.390.579.2]end of the spectrum with a value of 0.02637.
Table 1: Eco-intensities at the company level
Tier Company EI 1 – CO2 emissions
eco-intensity
EI 2 – Water consumption eco-intensity
2nd tier
C 0.05445 0.01573
D 0.03597 0.01057
E 0.00047 0.00813
F 0.05761 0.02637
G 0.00068 0.00003
H 0.01016 0.00007
I 0.00626 0.00024
1st tier
S2 0.17822 0.00394
S3 0.00880 0.00484
S4 0.00123 0.01579
Focal firms FF1 0.00177 0.00120
FF2 0.01153 0.00625
The results at the supply chain level show contrasting results between the two supply chains, as shown in Table 2. Considering CO2 emissions eco-intensity, product 1 is 70%
more polluting than product 2 as its EI 1 eco-intensity equals to 0.00448 compared to 0.00263 of product 2. A significant contribution to the poor performance of product 1 in terms of CO2 emissions eco-intensity is due to S2, which is the single most eco-intense
company in terms of emissions to air. The participation of S2 only to supply chain 1 explains the significant difference observed between the two supply chains. On the other hand, product 2 consumes 52% more water per monetary unit when the extended supply chain is taken into account. The water consumption eco-intensity of product 2 amounts to 0.00190 compared to the lower output of product 1, which equals to 0.00125. A comparison between the values of eco-intensity 1 and eco-intensity 2 is not meaningful as different units of measurement are used to calculate CO2 emissions and water
8
Table 2: Supply chain eco-intensities
Supply chain EI 1 – CO2 emissions
eco-intensity
EI 2 – Water consumption eco-intensity
Focal firm 1 – Product 1 0.00448 0.00125
Focal firm 2 – Product 2 0.00263 0.00190
These results might be interpreted under different perspectives. Decision makers or relevant stakeholders may pay attention to one specific eco-intensity indicator only to improve their environmental performance: this might reflect specific features of the industry or environmental targets. Chemicals sector experts might be interested in improving the performance of the water consumption eco-intensity primarily stating the consideration of the chemical industry as a water-intensive sector, whereas the focus might be on emissions in other industries. Customers may want to compare the eco-intensity of different products as a variable to influence their purchasing decisions. Finally, a labelling scheme may be implemented on the basis of the results to report externally the environmental performance of products.
Conclusion Contribution
The proposed model aims to introduce a quantitative approach to assess the eco-intensity of extended supply chains with a cradle-to-gate approach. It adopts a decentralised recursive mechanism, making the model applicable to non-cooperative supply chains. This approach facilitates the implementation of the model in contexts where organisations have a limited visibility of their supply chain. Global supply chains are becoming longer and as a result the traceability of the upstream network is decreasing. Passing the eco-intensity value from a tier of the supply chain to the next one requires access only to direct business partners simplifying the assessment of the supply chain. The limited information exchange required by the model does not need a developed relationship structure between supply chain members and is thus applicable also to non-collaborative supply chains.
The model allows comparing effectively the eco-intensity of products taking into account the extended supply chain and thus expanding the number of tiers typically assessed in the GSCM literature and obtaining a complete cradle-to-gate evaluation of the eco-intensity of products.
9 Limitations and future research direction
The model demonstrated a promising applicability being validated with secondary data, however it has still to be validated with primary data in an operating supply chain context. The applicability of the recursive mechanism between supply chain partners driven by different business targets and different inclination towards sustainability has still to be proved: as Schmidt and Schwegler (2008) pointed out, there is the need of a powerful player in the supply chain to kick-off the mechanism on a voluntary basis. The validation of the model with primary data would fit to this purpose. Additionally, environmental data might not be available or communicated for all supply chain members leading to an incomplete evaluation of the eco-intensity of the extended supply chain. A technique to overcome the issue of missing or incomplete data has still to be identified.
From a methodological perspective, the numerical example presented was quite simple consisting of two linear supply chains, with only two intersections of the supply chains in S3 and S4 that are the organisations contributing to both final products. A more complex example of a fictitious supply network is currently under development.
The selection of indicators was aimed to be generic on purpose in order to fit a wide range of applications in different sectors. The indicators thus may not represent the specific needs of each supply chain in terms of supply chain strategy and environmental priorities. Moreover, the performance of each product is evaluated on the basis of each specific environmental indicator: a clear indication on which product’s supply chain performs better is not given when the results of different eco-intensity indicators provide conflicting indications. An aggregation of different indicators in a single eco-intensity index would overcome this limitation and allow decision makers to have effective support to understand the trade-offs arising between different eco-intensity indicators and achieve a holistic evaluation of the eco-intensity performance both at the single company level and at the supply chain level.
References
Ahi, P., Searcy, C., 2015. An Analysis of Metrics Used to Measure Performance in Green and Sustainable Supply Chains. Journal of Cleaner Production 86, 360–377. doi:10.1016/j.jclepro.2014.08.005 Ahi, P., Searcy, C., 2014. Assessing sustainability in the supply chain: A triple bottom line approach.
Applied Mathematical Modelling 39, 2882–2896. doi:10.1016/j.apm.2014.10.055
Angelakoglou, K., Gaidajis, G., 2015. A review of methods contributing to the assessment of the environmental sustainability of industrial systems. Journal of Cleaner Production.
doi:10.1016/j.jclepro.2015.06.094
APICS, 2014. SCOR. doi:10.1007/s13398-014-0173-7.2
Beavis, L., 2015. M&S takes an interest in its suppliers’ green credentials [WWW Document]. The Guardian. URL https://www.theguardian.com/sustainable-business/2015/apr/30/ms-takes-an-interest-in-its-suppliers-green-credentials (accessed 12.22.16).
Beske-Janssen, P., Johnson, M.P., Schaltegger, S., 2015. 20 Years of Performance Measurement in Sustainable Supply Chain Management – What Has Been Achieved? Supply Chain Management: An International Journal 20, 664–680. doi:10.1108/SCM-06-2015-0216
Björklund, M., Martinsen, U., Abrahamsson, M., 2012. Performance measurements in the greening of supply chains. Supply Chain Management: An International Journal 17, 29–39.
doi:10.1108/13598541211212186
Brandenburg, M., 2015. Low carbon supply chain configuration for a new product – a goal programming approach. International Journal of Production Research 1–23. doi:10.1080/00207543.2015.1005761 Cabral, I., Grilo, A., Cruz-Machado, V., 2012. A decision-making model for Lean, Agile, Resilient and
Green supply chain management. International Journal of Production Research 50, 4830–4845. doi:10.1080/00207543.2012.657970
Caro, F., Corbett, C.J., Tan, T., Zuidwijk, R., 2013. Double Counting in Supply Chain Carbon Footprinting. Manufacturing & Service Operations Management 15, 545–558.
10
Charmondusit, K., Phatarachaisakul, S., Prasertpong, P., 2014. The quantitative eco-efficiency measurement for small and medium enterprise: A case study of wooden toy industry. Clean Technologies and Environmental Policy 16, 935–945. doi:10.1007/s10098-013-0693-4 Colicchia, C., Creazza, A., Dallari, F., Melacini, M., 2015. Eco-efficient supply chain networks:
development of a design framework and application to a real case study. Production Planning & Control 7287, 1–12. doi:10.1080/09537287.2015.1090030
Genovese, A., Lenny Koh, S.C., Kumar, N., Tripathi, P.K., 2013. Exploring the challenges in implementing supplier environmental performance measurement models: a case study. Production Planning & Control 7287, 1–14. doi:10.1080/09537287.2013.808839
Gopal, P., Thakkar, J., 2012. A review on supply chain performance measures and metrics: 2000‐ 2011. International Journal of Productivity and Performance Management 61, 518–547.
Harris, I., Naim, M., Palmer, A., Potter, A., Mumford, C., 2011. Assessing the impact of cost
optimization based on infrastructure modelling on CO2 emissions. International Journal of Production Economics 131, 313–321. doi:10.1016/j.ijpe.2010.03.005
Joa, B., Hottenroth, H., Jungmichel, N., Schmidt, M., 2014. Introduction of a feasible performance indicator for corporate water accounting – a case study on the cotton textile chain. Journal of Cleaner Production 82, 143–153. doi:10.1016/j.jclepro.2014.06.075
Mahdiloo, M., Saen, R.F., Lee, K.H., 2015. Technical, environmental and eco-efficiency measurement for supplier selection: An extension and application of data envelopment analysis. International Journal of Production Economics 168, 279–289. doi:10.1016/j.ijpe.2015.07.010
Michelsen, O., Fet, A.M., 2010. Using eco-efficiency in sustainable supply chain management; A case study of furniture production. Clean Technologies and Environmental Policy 12, 561–570. doi:10.1007/s10098-009-0266-8
Michelsen, O., Fet, A.M., Dahlsrud, A., 2006. Eco-efficiency in extended supply chains: A case study of furniture production. Journal of Environmental Management 79, 290–297.
doi:10.1016/j.jenvman.2005.07.007
O’Rourke, D., 2014. The science of sustainable supply chains. Science 344, 1124–1128.
Reefke, H., Trocchi, M., 2013. Balanced scorecard for sustainable supply chains: design and development guidelines. International Journal of Productivity and Performance Management.
Saling, P., Kicherer, A., Dittrich-Krämer, B., Wittlinger, R., Zombik, W., Schmidt, I., Schrott, W., Schmidt, S., 2002. Eco-efficiency analysis by BASF: the method. The International Journal of Life Cycle Assessment 7, 203–218. doi:10.1007/BF02978875
Schmidt, M., Schwegler, R., 2008. A recursive ecological indicator system for the supply chain of a company. Journal of Cleaner Production 16, 1658–1664. doi:10.1016/j.jclepro.2008.04.006
Shaw, S., Grant, D.B., Mangan, J., 2010. Developing environmental supply chain performance measures. Benchmarking: An International Journal 17, 320–339.
Slack, N., Chambers, S., Johnston, R., Betts, A., 2009. Operations and Process Management. Paerson Education, Harlow.
Tseng, M.-L., Tan, K.-H., Lim, M., Lin, R.-J., Geng, Y., 2013. Benchmarking eco-efficiency in green supply chain practices in uncertainty. Production Planning & Control 7287, 1–12.
doi:10.1080/09537287.2013.808837
Veleva, V., Hart, M., Greiner, T., Crumbley, C., 2003. Indicators for measuring environmental
sustainability: A case study of the pharmaceutical industry. Benchmarking: An International Journal 10, 107–119.
WBCSD, 2000. Eco-efficiency. Creating more Value with less Impact, World Business Council for Sustainable Development.
World Business Council for Sustainable Development (WBCSD) and World Resources Institute (WRI), 2009. The Greenhouse Gas Protocol Initiative: Scope 3 Accounting and Reporting Standard. Geneva, Switzerland.
Wu, C., Barnes, D., 2016. An integrated model for green partner selection and supply chain construction. Journal of Cleaner Production 112, 2114–2132. doi:10.1016/j.jclepro.2015.02.023
Yakovleva, N., Sarkis, J., Sloan, T., 2012. Sustainable benchmarking of supply chains: the case of the food industry. International Journal of Production Research 50, 1297–1317.