1 INTRODUCTION
Among female college students, everyone attaches great importance to weight. Particularly, the weight control behavior of female college students plays a very important role in the daily diet and sports life. The existing studies have found that the weight gain is not only related to eating behavior and exercise habit, but also related to certain personality trait, such as personality trait of impulsivity. Impulsivity generally refers to a kind of tendency for someone who is lack of plan and acts quickly and rarely considers the con-sequences of such behavior before action [1]. At the present stage, there are two orientations for the re-search of the impulsivity: excitation orientation and inhibition orientation [2]. In the excitation orientation, the most important factors are the reward sensitivity and tolerance to the reward delay. In the inhibition orientation, the absence of control ability is the main component of impulsivity. The personality trait of impulsivity is related to the obesity, induced diet, emotional diet, moderate diet and other behaviors. Impulsivity can explain the eating behavior of people with different weight [3].
The relationship between the impulsivity, eating behavior and BMI attracts many scholars to research. The establishment of the model can directly and
effec-tively explain the relationship between variables, so it is necessary to establish the model between factors. Davis et al. [4] discussed the intermediary role of the emotional diet in the reward sensitivity and BMI. The result shows that the intermediary role of the emotion-al diet is not prominent; there is regulation of other more factors between the reward sensitivity and BMI, such as other dietary behavior. Then Davis et al. [5] mainly discussed the relationship between the reward sensitivity, eating behavior, food preference and BMI. The result shows that the reward sensitivity, eating behavior and food preference can truly predict BMI. The path coefficient of food preference for the predic-tion of BMI is significantly less than that of other paths. Therefore, the author proposes that the popu-larization of the prediction of BMI by the food pref-erence needs to be further researched. The research of food preference finds that the obese individuals have positive attitude towards healthy and unhealthy food [6]
. The obese individuals may not just like eating high-sugar and high-fat food, but like eating some-thing can be eaten. Therefore, the role of food prefer-ence in the prediction of BMI is not clear. Therefore, the prediction path of the food preference toward BMI is removed in this research.
The activity level is always an important factor to affect BMI. The correlation between the sitting time
Prediction of BMI by impulsivity, eating behavior and activity level
Xiaxia Jiang & Yanping Hong
College of Education, Hubei University of Science and Technology, Xianning, Hubei, China
ABSTRACT: Objective: Discuss the relationship between the impulsivity, eating behavior and activity level and the body mass index (BMI). Method: Test 147 female college students with the impulsivity questionnaire (BIS-11 and BIS/BAS), Dutch Eating Behavior Questionnaire (DBEQ), Sitting Time Scale (STS) and Exercising Time Scale (ETS). Results: (1) The correlation analysis indicates that BMI and impulsivity (r = 0.43 and 0.52) have a significant positive correlation with the sitting time (r = 0.61) and a significant negative correlation with the activity level (r= −0.49). (2) The path analysis indicates that the reward sensitivity directly affects BMI and indirectly affects BMI through the activity level as well; the eating behavior has an insignificantly direct impact on BMI, because its impact is generated by the intermediary role of induced diet. Conclusion: (1) The impulsivity, eating behavior and activity level are closely related to BMI; (2) the activity level, sitting time and induced diet play an intermediary role between the impulsivity and BMI.
Keywords: impulsivity; path analysis; eating behavior; BMI DOI: 10.1051/
C
Owned by the authors, published by EDP Sciences, 201
/2 01 shsconf
0 00 (201 ) SHS Web of Conferences
0 0
, 2
2 6
6
6
4 4 2
and inactive physical exercise is significant [7]. Meanwhile, Wardle et al. [8] propose that the reward sensitivity individuals are sensitive to food infor-mation, but have low sensitivity to physical exercise. Therefore, this research integrates with the activity level and examines the relationship among the impul-sivity, activity level and BMI. The research of the prediction of BMI by other side of the compulsivity– behavioral control ability and eating behavior is still very rare. Enticott et al. [9] examined the relationship between self-reported BIS-11 and behavioral control ability of behavior measurement. The result shows that the correlation between BIS-11 and response con-flict amount of space Stroop is significant, indicating that BIS-11 may be consistent with the measurement of behavioral control ability.
In order to examine the relationship between the impulsivity, eating behavior and activity level and BMI, this research selects BIS/BAS and BIS-11 ques-tionnaire to measure the reward sensitivity of impul-sivity and behavioral control ability, expects to under-stand the relationship between variables through cor-relation and path analysis and establishes a prediction model of BMI by the impulsivity, eating behavior and activity level.
2 RESEARCH OBJECT AND METHOD 2.1 Research object
Among 147 female college students, the average age M = 21.43 ± 1.62. According to the overweight and obese BMI norm of Chinese adults [10], the critical values of the overweight and obese BMI index are respectively 24 and 28. Among them, when BMI≥24 22, the number of overweight people is 22; when 20≤BMI <24, the number is 98. The average body mass index (BMI) M = 22.83 ± 2.22.
2.2 Experimental tools and materials 2.2.1 Body Mass Index (BMI)
Body Mass Index (BMI) respectively measures height and weight by the use of height and weighing machine, keeping two decimal places. BMI is calculated ac-cording to the formula of weight (kg) / height 2(m2). 2.2.2 Sitting Time Scale (STS)
Sitting Time Scale (STS) is developed by Janssen I et al., which is a scale used to measure the sitting time in life [11]. This scale includes six items and five-point score. “1” represents “less than or equal to 0.5 hours” while “5” represents “more than five hours”. The higher the score is, the longer the sitting time is. This scale has a good reliability and validity. In this re-search, the coefficient of internal consistency a = 0.75.
2.2.3 Exercising Time Scale (ETS)
Exercising Time Scale (ETS) is developed by Janssen I, et al, which is a scale used to measure the exercising time in life [11]. This scale includes three items and five-point score. “1” represents “less than or equal to 0.5 hours” while “5” represents “more than five hours”. The higher the score is, the longer the exe r-cising time is. This scale has a good reliability and validity. In this research, the coefficient of internal consistency a = 0.78.
2.2.4 BIS/BAS Scale
BIS/BAS questionnaire is developed by Carver and White [12], which is a questionnaire used to measure impulsivity. First, 20 entries in the English version of the scale are translated into Chinese by psychological professionals; then translate back into English by bi-lingual psychological professionals (whose mother tongue is Chinese); finally, the Chinese version of BIS/BAS is determined by discussion and added with instructions. This questionnaire includes 20 items, four subscales and four-point score. And BIS ques-tionnaire is used to measure potentially dangerous sensitivity and emotional reaction. Three subscales of BAS are driving force, stimulus seeking and reward reactivity. Among them, the driving force refers to the persistent investment in desired things; the stimulus seeking refers to the investment in potential reward events; the reward reactivity refers to the expectation of the positive emotional investment in reward behav-ior. As the total score of BAS scale is becoming high-er, it indicates that one is more impulsive and more sensitive to reward. As the total score of BIS scale is becoming higher, it indicates that the emotional reac-tion is stronger. And the scale has a good reliability and validity. In this research, the coefficient of inter-nal consistency of each scale is respectively 0.73, 0.80, 0.76 and 0.79.
2.2.5 BIS-11 Scale
BIS-11 Scale is developed by Patton, Stanford and Barratt and amended by Li Xianyun et al., it is a scale used to measure impulsivity [13]. It includes 30 entries, which is divided into six factors: attention factor, ex-ercising factor, self-control factor, cognitive complex-ity factor, stabilcomplex-ity factor and cognitive instabilcomplex-ity factor. According to the frequency of each entry, the record is graded from 1 to 4 (“hardly/never” = 1; “o c-casionally” = 2; “often” = 3; “almost always or always” = 4), in which the 11 entries (4, 5, 13, 14, 15, 16, 17, 19, 20, 21, 26) are reverse scoring. The higher the total score of questionnaire is, the higher the level of individual impulsivity is. And the scale has a good reliability and validity. In this research, the coefficient of internal consistency a=0.81.
de-veloped by Van Strien et al. [14] which is a question-naire used to measure eating behavior. First, 33 entries in the English version of the scale are translated into Chinese by psychological professionals and then translated back into English by bilingual psychologi-cal professionals (whose mother tongue is Chinese), and then the Chinese version of DEBQ is determined by discussion and added with instructions. This ques-tionnaire includes 33 items, which is divided into three subscales—emotional diet, restrictive diet and induced diet. According to the frequency of each entry, the record is graded from 1 to‒5 (“never” = 1; “occasio n-ally” = 2; “sometimes” = 3; “often” = 4; “always” = 5). As the total score of each subscale is becoming higher, it indicates that the eating behavior is more frequent. The scale has a good reliability and validity. In this research, the coefficients of internal consistency of three subscales are respectively 0.73, 0.77 and 0.79. 2.3 Statistical methods
The statistical analysis is given to all the data through SPSS18.0 statistical software. The main statistical methods are the correlation analysis and path analysis.
3 RESULTS
3.1 Correlation between the impulsivity, eating be-havior, activity level and BMI
The correlation analysis indicates that BMI has a sig-nificant positive correlation with the impulsivity (BIS-2 and TBAS) and sitting time and a significant
negative correlation with the activity level. The corre-lation between various factors is shown in Table 1. 3.2 Path analysis of the impact of impulsivity, eating
behavior and activity levels on BMI
In order to carry out in-depth research of the path of the impulsivity through indirect impact of the eating behavior and activity level on BMI, we conduct 6 regression analyses to discuss the impact of various factors on BMI.
Regression analysis 1: With the predictive variables of both sides about the impulsivity, the regression analysis is given to BMI. The prediction of BMI by TBAS and BIS-2 is significant (F = 3.47, P <0.001).
[image:3.595.97.510.126.315.2]Regression analysis 2: With the predictive variable of the impulsivity, the regression analysis is given to eating behavior. The prediction of eating behavior by BIS-2 is also significant (F = 3.53, P <0.001).
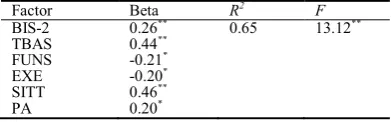
Table 2. Regression of BMI by impulsivity, eating behavior and activity level
Factor Beta R2
F BIS-2 0.26** 0.65 13.12** TBAS 0.44**
FUNS -0.21* EXE -0.20* SITT 0.46**
PA 0.20*
[image:3.595.305.501.608.669.2]Regression analysis 3: With the predictive variable of the impulsivity, the regression analysis is given to activity level. The prediction of activity level by TBAS is also significant (F=2.25, P<0.05).
Table 1. Correlation between the impulsivity, eating behavior, activity level and BMI
BMI
BIS-2 0.4ˆˆ
TBAS 0.52ˆˆ
0.21ˆ
FUNS 0.08 0.14 0.54ˆˆ
DRVE 0.72 0.17 0.51ˆˆ 0.45ˆˆ
RERE 0.07 0.04 0.47ˆˆ 0.37ˆˆ 0.53ˆˆ
BIS 0.02 0.10 0.34ˆˆ
0.29ˆˆ
0.28ˆˆ
0.56ˆˆ
PA -0.49ˆˆ
0.14 0.34ˆˆ
0.22ˆˆ
-0.18 0.16 0.18
SITT 0.61ˆˆ
0.17 -.31ˆˆ
- 0.14 0.09 0.05 0.07 -0.80ˆˆ
EXET 0.02 -0.01 0.14 0.18 -.18 -0.19 -0.20ˆ 0.57ˆˆ 0.04
EXT 0.07 0.31ˆˆ
0.10 -.0.23ˆ
0.02 -026ˆ
-0.26ˆˆ
0.01 0.02 0.05
EMT 0.16 0.23ˆˆ 0.03 0.16 -.09 -0.20 -0.24ˆˆ 0.01 0.13 0.18 0.41ˆˆ
RET 0.10 -0.02 0.11 0.01 -.01 0.05 0.04 0.05 0.07 0.18 0.18 0.23ˆ
EAT 0.07 0.30ˆˆ
0.12 0.21ˆ
-.08 -0.28ˆ
-0.31ˆˆ
0.02 0.07 0.07 0.60ˆˆ
0.82ˆˆ
-0.27ˆˆ
BMI BIS-2 TBAS FUNS DRVE RERE BIS PA SITT EXET EXT EMT RET EAT
Note: BMI is body mass index; BIS-2 is behavioral control ability; FUNS is stimulus seeking; DRVE is driving force; RERE is re-ward reactivity; BIS is potential risk sensitivity; PA is activity level, which is exercising time minus sitting time; SITT is sitting time; EXET is exercising time; EXT is induced diet; EMT is emotional diet; RET is restrictive diet; EAT is overall eating behavior, a sum of three kinds of eating behavior.
ˆ
represents that p<0.05;ˆˆ
Regression analysis 4: With the predictive variables of the impulsivity, eating behavior and activity level, the regression analysis is given to BMI. The regres-sion equation is significant, as shown in Table 2.
[image:4.595.318.488.206.287.2]Because the role of prediction of BMI by the activ-ity level and sitting time is significant, the intermedi-ary role of siting time is analyzed. Regression analysis 5: With the predictive variable of the impulsivity, the regression analysis is given to the sitting time. And the regression equation is significant, as shown in Table 3: Table 3. Regression of sitting time by impulsivity
Factor Beta R2
F TBAS 0.33* 0.13 2.15*
[image:4.595.92.291.238.261.2]Because the role of prediction toward BMI by the eating behavior is not significant while the role of prediction toward BMI by the induced diet is signifi-cant, we analyze the intermediary role of induced diet. Regression analysis 6: With the predictive variable of the impulsivity, the regression analysis is given to the induced diet. And the regression equation is signifi-cant, as shown in Table 4:
Table 4. Regression of induced diet by impulsivity
Factor Beta R2
F BIS-2 0.24* 0.19 3.54**
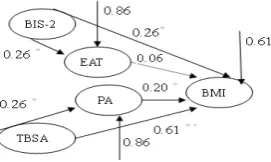
In the above multiple regression analysis, the pre-diction of BMI by impulsivity is significant in regres-sion 1, and both Beta values are significant (0.61 and 0.26). In regression 4, the prediction of BMI by eating behavior is not significant. In regression 2 and regres-sion 3, the prediction of eating behavior and activity level by impulsivity is significant, and Beta value is also significant (0.26 and 0.26). It indicates that the impulsivity can directly affect eating behavior, activity level and BMI, but the eating behavior could not di-rectly affect BMI. The analysis path is shown in Fig-ure 1 (data marked in the FigFig-ure are corresponding path coefficients and residual coefficients), and four BMI prediction paths are significant.
Figure 1. Path analysis of prediction of BMI by impulsivity, eating behavior and activity level
In regression 4, Beta values of the induced diet and sitting time are significant (0.20 and 0.46). In regres-sion 5 and 6, Beta values of the induced diet and
[image:4.595.92.289.378.403.2]sit-ting time are also significant (0.24 and 0.33). It indi-cates that the impulsivity can directly affect BMI and also indirectly affect BMI through the induced eating behavior and sitting time. The analysis path is shown in Figure 2 (data marked in the Figure are corre-sponding path coefficients and residual coefficients). As shown in Figure 2, six paths that have impacts on BMI are significant.
Figure 2. Path analysis of prediction of BMI by impulsivity, external diet and sitting time
4 DISCUSSION
4.1 Relationship between the impulsivity, eating be-havior and activity level and BMI
This research examines the relationship between two aspects of impulsivity: the reward sensitivity and the relationship among the behavioral control ability, eating behavior, activity level and BMI. The result shows that the impulsivity has a significant correlation with BMI, eating behavior and activity level, indicat-ing that the impulsivity has a basis to explain the diet and activity level of individuals with different weights. It is consistent with the research result of Lu Yao, et al [2]. It implies that the personality trait of impulsivity is a risk factor of unhealthy eating behavior and obesity. Compared with individuals with low impulsivity, the individuals with high impulsivity are difficult to resist the temptation of food and prone to take more food.
The score of TBAS has a significant negative cor-relation with the activity level, indicating that the in-dividuals of reward sensitivity reduce the sensitivity to physical exercise. It is consistent with the result of Wardle [8]. Therefore, in order to reduce the probabil-ity of obesprobabil-ity in women, there is a need to increase their sensitivity toward the benefits of physical exer-cise and stimulate their interest in physical exerexer-cise. It is consistent with a lot of obesity intervention measures. Neumaek-Sztainer et al. [15] and Wang Y et al. [16] increase physical exercise and teach the benefits of physical exercise to improve students’ activity level, so as to achieve the goal of weight loss.
4.2 Intermediary role of activity level, sitting time and induced diet
[image:4.595.126.262.573.654.2]and BMI is significant. The reward sensitivity can directly affect BMI indirectly affect BMI through the activity level as well. After adding the activity level, the correlation between the reward sensitivity and BMI is still significant, but the ability to prediction of BMI by the reward sensitivity is increased by 10℅. The activity level only plays a part of intermediary role. The more sensitive to the reward is, the lower the activity level is, the less the exercising time is and the greater the BMI is. It indicates that low level of phys-ical exercise is an important factor of overweight.
In regression 4, the contribution of sitting time in the activity level is greater than the role of exercising time. The result is consistent with the research result of CDC. At the present stage, the exercising time of students is reduced significantly. It is estimated that 20% of students fail to participate in any extracurricular physical exercise, especially girls. The role of exer-cising time in BMI is relatively weakened. The sitting time has a significant positive correlation with BMI. It indicates that the more the sitting time is, the greater BMI is. And it suggests that reduction of the sitting time will be an effective measure to reduce the proba-bility of obesity.
The intermediary role of eating behavior is not sig-nificant, which is inconsistent with the result of Davis [6]
. Perhaps the tested overweight and obese people in this research only account for 15% and the score of unhealthy eating behavior is not yet super low enough. Therefore, the path between eating behavior and BMI is not significant. Further analysis of eating behavior finds that the intermediary role of induced diet in the behavioral control ability and BMI is significant. It indicates that the behavioral control ability can direct-ly affect BMI and also indirectdirect-ly affect BMI through the induced diet. The weaker the behavioral control ability is, the more induced eating behavior is and the greater the BMI is. What’s more, it is in line with the real life. Due to more availability of high-fat and high-sugar food, food pictures and taste information are filled in our living environment [15]. If the behav-ioral control ability is weaker, it is more prone to be affected by external food information. Even if there is no drive of physical need--“hunger”, it can also lead to more eating behaviors. And this model effectively explains the mechanism of impact of induced diet on body weight.
This research tells us that the body weight can be managed by the cognition‒behavior intervention mo d-el for the intervention of impulsivity [17]. The weight loss and obesity prevention can be achieved by changing irrational concept of impulsivity individuals and unhealthy eating behavior. For the intermediary role of induced diet, activity level and sitting time, it suggests that the intervention of the body weight of girls can be started from the eating behavior and activ-ity level. The purpose of weight loss can be achieved by improving the health of eating behavior, stimulat-ing the interest in physical exercise and increasstimulat-ing the
physical exercise time. Meanwhile, reduction of the sitting time is also an important measure of body weight control. In the future research, other factors such as the attitude towards the food and physical exercise and the factors about companion and parents [18]
can be increased to examine the relationship be-tween many factors and BMI, so as to provide a theo-retical basis for the intervention of body weight.
ACKNOWLEDGEMENT
This paper is financially supported by the Key Provin-cial (Cultivation) Discipline Pedagogy Funding Pro-ject of Hubei University of Science and Technology (No. hkj011).
REFERENCES
[1] Yeomans MR, Leitch M & Mobini S. 2008. Impulsivity is associated with the disinhibition but not restraint fac-tor from the Three Facfac-tor Eating Questionnaire. Appe-tite, 50: 469-476.
[2] Lu Yao, He Jinbo & Zhu Hong, et al. 2015. Impact of different impulsivity traits on adolescent overeating be-havior, Chinese Journal of Health Psychology, 23(8): 1229-1232.
[3] Chen Gui. 2013. Research of Relationship between Overweight/Obese Adolescent Delay Discounting and Impulsivity and Eating Behavior. PhD thesis, Hunan, Second Xiangya Hospital.
[4] Nederkoorn C, Eijs YV & Jansen A. 2004. Restrained eaters act on impulse. Personality and Individual Dif-ferences, 37: 1651-1658.
[5] Davis C, Karen, Robert P & Levitan et al. 2007. From motivation to behavior: A model of reward sensitivity, overeating, and food preferences in the risk profile for obesity. Appetite, 48: 12-19.
[6] Craeynest M, Crombez G & Houwer JD, et al. 2005. Explicit and implicit attitudes towards food and physical activity in childhood obesity. Behavior Research and Therapy, 43: 1111-1120.
[7] She Tao. 2015. Correlation analysis of socio-economic
factors of China’s overweight and obese migrant chi l-dren, Journal of Guangzhou Institute of Physical Educa-tion, 3(35): 35-38.
[8] Wardle J, Guthrie C & Sanderson S, et al. 2001. Food and activity preferences in children of lean and obese parents. International Journal of Obesity, 25: 971-977. [9] Enticott PG, James RP & Ogloff JL, et al. 2006.
Associ-ations between laboratory measures of executive inhibi-tory control and self-reported impulsivity. Personality and Individual Differences. 41: 285-294.
[10] Working Group of Obesity in China. 2004. BMI refer-ence norm for screening overweight and obesity in Chi-nese children and adolescents. ChiChi-nese Journal of Epi-demiology, 25(2): 97-102.
[11] Janssen I, Peter T, & Katzmarzyk. 2004. Overweight and obesity in Canadian adolescents and their associations with dietary habits and physical activity patterns. Jour-nal of adolescent health, 35: 360-367.
impend-ing reward and punishment: The bis/bas scales. Journal of Personality and Social Psychology, 67: 319-333. [13] Li Xianyun, Fei Lipeng & Xu Dong, et al. 2011.
Relia-bility and validity of application of an adapted Chinese version of Barratt Impulsiveness Scale in the community and university population. Chinese Mental Health Jour-nal, 25(8): 610-615.
[14] Van ST. 2002. Dutch Eating Behavior Questionnaire. Manual Thetford, UK: Thames Valley Test Company Limited.
[15] Wei Xiaolu. 2011. Behavioral Impulsivity and Impulse’s Influences on Restrained Eating. Master’s thesis,
Chongqing: Southwest University.
[16] Wang Y, Tussing L & Young AO. 2006. Obesity pre-vention in low socioeconomic status urban Afri-can-American adolescents: study design and preliminary findings of the HEALTH-KIDS Study. European Jour-nal of Clinical Nutrition, 92-103.
[17] Mobini S, Pearce M & Grant A et al. 2006. The rela-tionship between cognitive distortions, impulsivity and sensation seeking in a non-clinical population sample. Personality and Individual Differences, 40: 1153-1163. [18] Chen H, Gao X & Todd J. 2007. Predictive models for