International Journal of Innovative Technology and Exploring Engineering (IJITEE) ISSN: 2278-3075, Volume-9 Issue-2, December 2019
Abstract: Absenteeism in the workplace is a significant cause of lost productivity of the organization and the root cause of the company's performance to many employers. Managing absenteeism is inevitable, but making sudden changes without knowing the cause of the problem is a terrible mistake. This paper aims to develop a reliable workplace absenteeism prediction model using machine learning and natural language processing techniques to aid employers with analyzation of given minimal available information about the employees’ demographics. ‘Distance from residence to work,’ ‘disciplinary failure’ and ‘weight’ was negatively associated with absenteeism time in hours. ‘Age,’ ‘son,’ and ‘height’ were positively associated with absenteeism time in hours.
Keywords : Workplace absenteeism, Linear regression, Machine learning
I. INTRODUCTION
Absenteeism in the workplace is a significant cause of lost productivity of the organization and the root cause of the company's performance to many employers. [1]. It is clear the importance of reducing the work the organization. It is also important employees who want to go to work. The researchers suggested a variety of techniques that can be used to reduce tissue absences and motivate employees to work. Examples of recognition programs, this approach, health, employee feedback, reducing stress, health programs, and
organizational changes. The organization felt
disappointment in reducing absenteeism. There are many options for making educational decisions about which interventions are most effective when the study reported a reduction in absenteeism without stating whether the results were significant. This situation suggests that a systematic review of the methodologies are needed.
Managing absenteeism is inevitable, but making sudden changes without knowing the cause of the problem is a terrible mistake. This quantitative study has identified the cause of absenteeism and should support the workplace. The methodology used in this paper can also be considered a roadmap for the reader to follow the steps taken in this study and to apply a day procedure to identify the causes of many other problems. The purpose of this study is to find and analyze the causes of hope so that workplace leaders and managers can use the study to formulate possible solutions for problems.
Revised Manuscript Received on December 05, 2019.
Jae Won Choi, College of software, Chungang University, Heugseoglo 84, Dongjaggu, Seoul, Korea,
II. RELATEDSTUDY A. Absenteeism
The goal of this study was to explore the current literature on intervention strategies to reduce absenteeism from 1989 to 2013, and then identify the most effective strategies for the organization to reduce it. Employee absenteeism has a significant impact on the organization. A survey of 276 organizations on the impact of employee absences on their finances revealed that unplanned absences amount to 19% of their organizational salaries [2]. In addition, the recent economic downturn and rising unemployment are expected to be met by a parallel increase in physical and mental illnesses [3]. Increasing organizational demands can result in an overload of work and an increase in emotional. By reducing occupational resources (e.g., social support and learning opportunities), when two forces become ill, they become a strong predictor of exhaustion and absence. All of this shows that organizations should take steps to reduce absenteeism.
The literature looking into the superior and predictor of absenteeism seems rich. This study is very helpful in the area of absence reduction, but correlation does not necessarily imply causality. The correlation coefficient determines whether the two variables change from one another. Nevertheless, the correlation approach does not necessarily prove that one variable causes changes in the other. For example, height and intelligence may be related, but keys do not necessarily cause intelligence [4]. For experimental designs, study participants are assigned to intervention or control groups. By randomly assigning subjects, researchers can provide stronger results because they can be more confident than they can be that differences between groups can be attributed to arbitration.
B. A Multidimensional View of Absenteeism
Before you go over your absenteeism, you'd better investigate the reasons why people call you sick. Steers and Rhodes [5] were the two most important theorists in absenteeism and proposed a process model of attendance behavior, a theory prominent in absenteeism in the 1970s and 1980s. Steers and Rhodes [5] suggested that organizations generally assume that withdrawal, turnover, and sick employees are all caused by similar factors. These assumptions believe that absences can be remedied in the same way that organizations use to fight absenteeism and turnover.
Rhodes and steers [6] argued that this assumption is
Prediction of Workplace Absenteeism Time
Using Machine Learning
false because absenteeism, turnover and abrasion all have different causes. Unlike turnover or withdrawal, absences from work are voluntary. Employees decide not to go to work voluntarily and are currently unable to leave their jobs, so they use sick leave instead of resigning. The assumption that job dissatisfaction is the root cause of absenteeism has never been empirically strong support. Before the 1980s, researchers assumed that employees could generally go to work. And if they didn't choose, it was the result of the choices they made [6]. However, this study did not take into account employees who could not go to work because of family devotion or travel [6]. Rhodes 's and steers [6]’s process model of absenteeism suggests that employee attendance is a function of two main variables: employee motivation for work and employee ability to go to work. A lot of researchers have suggested many kinds of determinants of workplace absenteeism as the following table 1.
Table Ⅰ: The determinants of absenteeism
Category Contents Reference
Job Situation
Job situation is a strong determinant of employee motivation, and it can be
defined as the
characteristics of a job and the environment that the
employee works in. [6]
Job Stress
A challenging job situation improves job satisfaction,
which increases the
likelihood that employees will attend work.
Work Group Size
Smaller work groups
lessen absenteeism.
Employees who work in smaller groups develop greater social cohesion
[5]
Leadership Style
Leadership style correlates with job satisfaction, and thus with absenteeism.
[6]
Job Scope Job scope was significantly
related to absenteeism. [8]
Individual Differences
In large organizations,
women have more
absences than men. For employees who are injured at work, men are more likely to be absent
[9]
Organizational Commitment
Lower levels of
absenteeism occur in work units where organizational commitment is high
[10]
Job Characteristics
Job characteristics are a predictor of employee absenteeism
[6]
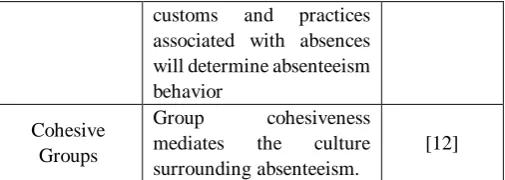
Absence Culture
A group’s cultural beliefs surrounding the legitimacy of work absences and the
[11]
customs and practices associated with absences will determine absenteeism behavior
Cohesive Groups
Group cohesiveness
mediates the culture surrounding absenteeism.
[12]
Many studies on churn have been reported, but no one can say that they can create universal human tools for predicting absenteeism or that we can see all the reasons for it. While most of the literature analyzed only age and gender, only a small number of marriages and geographic locations were examined. However, there is no literature linking these demographics to plans to manage the absenteeism. Absenteeism is so complex and linked to so many factors that researchers tend to take a small number of factors and ignore the effects of others. This paper is to understand what factors should be taken into consideration by the leader with the aim of qualitative methods. Wong [7] said the breakaway study was incomplete because it could be affected by a wide range of factors. Employee demographics are often changed, so that employees' demographics are constantly monitored. Some studies looked at age, gender, and geographic location. But researchers still can't express cultural and behavioral factors that can affect absenteeism.
III. METHODOLOGY
A. Dataset
Information about these variables comes from third-party websites, an international challenge to popular Internet platform Kaggle (www.kaggle.com) Data sets allow you to modify several new combinations of attributes and attribute exclusions (categories, integers, or mistakes) depending on the purpose of your study. The data set (Absenteeism at work - Part I) was used in academic research at the Universidade Nove de Julho - Postgraduate Program in Informatics and Knowledge Management. Kaggle asked participants to predict absence from work. To help develop algorithms, the organizer provided data stream types for large demographic information. Investigate the effects of 13 variables based on previous literature on breakaway-based communications services. These variables are listed and defined in Table 2.
Table Ⅱ : The variables in each category
Categories Variables
Absenteeism Absenteeism time in hours
External factors
Seasons, Transportation expense, Distance from Residence to Work
Internal factors
Service time, Disciplinary failure, Education
Personal factors
Age, Son, Social drinker, Social smoker, Pet, Weight, Height
B. Analysis Method
International Journal of Innovative Technology and Exploring Engineering (IJITEE) ISSN: 2278-3075, Volume-9 Issue-2, December 2019
machine learning for the prediction of workplace absenteeism.Linear regression analysis is a technique used for numerical prediction. Linear regression analysis is a statistical method to determine the strength of a relationship between variables. Just as classification gears are commonly used for the prediction of categorical labels, regression techniques are used for the prediction of continuous values. Linear regression analysis is used to fit a linear relationship between quantitative dependent variables Y and K independent variables. The basic model of multiple linear regression analysis is as follows.
Yi = β 0 + β 1·X1 + β 2·X2 + .... + β K·XK + ε i (1)
As described above, the factors of the facility, the distance to the nearest landmark, and the house price that can be described by the multivariate linear regression model using the nearest landmark popularity. However, due to the actual uncertainty, the uncertainty that can be simulated with noise ΔP should be combined when performing a price prediction.
(2)
In this model, this study uses the facility embedding fi
representing property types, d is room types, and q is bed types. In this model, β0, β1, β2 .... βK are the regression coefficients and εi is the superorder that occurs in measuring the dependent variable y. Creating a regression model involves finding the regression coefficient β0, β1, β2 ....βK.
Generally, the sample from the population is used in the blanch analysis. Since we do not know the exact regression coefficient β0, β1, β2 .... βK of the population, we use the least square method (OLS) to estimate it from the given sample data. This method yields an estimate β*0, β*1, β*2 .... *βK that minimizes the sum of squared deviations between the predicted values Y* of the model rather than the actual values
Y.
Y*i = β *0 + β *1·X1 + β *2·X2 + .... + β *K·XK + ε i (3)
OLS can be applied when the dependent variable satisfies the following assumptions.
1. The dependent variable follows the standard normal distribution.
2. The independent and dependent variables have a linear relationship.
3. Each observation is independent of each other.
4. The variability of the value of the dependent variable for each independent variable is the same regardless of the value of the independent variable. This is called homoscedasticity. If the above assumptions are met, the predicted value is an unbiased value, and the mean square error is the smallest compared to other unbiased estimates. If the regression model is used for prediction, the first assumption mentioned above is not satisfied, and even if the dependent variable has an arbitrary distribution, the estimated value of the
prediction can give very good results. This is possible because the data mining approach uses the case for verification separately from the case used in the learning model for verification.
To stay alive in the increasingly competitive market, many companies are using data mining technology to analyze pricing forecasts. It is important to build a more effective and accurate rental pricing model to effectively win customers. Statistical and data mining techniques were used to construct a pricing model. Data mining techniques can be used to detect interesting patterns or relationships in data and to predict or classify behavior by fitting models based on available data. In the case where the learning dataset and the test dataset are separated for machine learning, the test dataset must satisfy the following requirements. First, the training dataset and the test dataset must be created in the same format. Second, the test dataset should not be included in the training dataset. Third, the training dataset and the test dataset must be consistent in data. However, it is very difficult to create a test data set that meets these requirements. In data mining, various verification frameworks using one dataset have been developed to solve this problem. This study uses the Split Validation operator provided by RapidMiner to support this. The operator splits the input dataset into a training dataset and a test dataset to support performance evaluation. In this study, we select relative segmentation among the segmentation method parameters of this operator and use 70% of input data as learning data.Performance assessment uses training data to determine how well the generated model works. Performance measures can be divided into technical performance measures and heuristic measures. The technical performance measures to be used in this study show performance results by generating models from training data, processing test data into models, and comparing the class labels of original verification cases with predicted class labels. Measuring technical performance can be divided into supervised and unsupervised learning. The supervised learning used in this study is classified and regressed. The data used for this learning and test all have original class values. The performance is obtained by comparing and analyzing the original class values with the prediction results. RapidMiner provides Perfomance to measure performance indicators for common classification problems. Among them, this study uses root mean square error (RMSE).Root Mean Square Error (RMSE) is a commonly used measure when dealing with the difference between the estimated value or the value predicted by the model and observed in the real environment. Suitable for expressing precision. Each difference is also called residual, and the mean square root deviation is used to combine the residuals into a single measure. The root mean square deviation of the estimator with respect to the estimate is defined as the square root of the mean square error.
IV. RESULTS A. Linear Regression
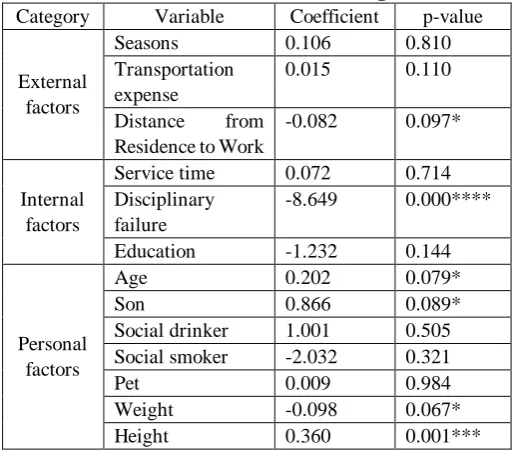
Table Ⅲ : The results of linear regression
Category Variable Coefficient p-value
External factors
Seasons 0.106 0.810
Transportation expense
0.015 0.110
Distance from
Residence to Work
-0.082 0.097*
Internal factors
Service time 0.072 0.714
Disciplinary failure
-8.649 0.000****
Education -1.232 0.144
Personal factors
Age 0.202 0.079*
Son 0.866 0.089*
Social drinker 1.001 0.505
Social smoker -2.032 0.321
Pet 0.009 0.984
Weight -0.098 0.067*
Height 0.360 0.001***
The analysis revealed that 6 of the 13 variables of property types were significant at the p <0.10 level. Regarding external factors, ‘distance from residence to work’ was negatively associated with absenteeism time in hours. For internal factors, ‘disciplinary failure’ was negatively related to absenteeism time in hours. Among personal factors, ‘age’, ‘son’, and ‘height’ were positively associated with absenteeism time in hours, while ‘weight’ was negatively related to absenteeism time in hours.
For many predictive tasks, this study tries to penalize predictive values that are much farther away than the actual values that are closer to the actual values. To do this, this study can take an average of the square error values, called root mean square error (RMSE). Here’s the formula for RMSE:
RMSE = root{(e1^2 + e2^2 + … + en^2) / n } (4)
where n represents the number of rows in the test set. This formula might look overwhelming at first, but all this study is doing is:
Taking the difference between each predicted value and the actual value (or error),
Squaring this difference (square),
Taking the mean of all the squared differences (mean), and
Taking the square root of that mean (root).
Hence, reading from bottom to top: root mean squared error. This study calculates the RMSE value of the prediction for the test set. RMSE is approximately 1.76 hours. One of the convenient things about RMSE is that because we take the square root and we take the square root, the unit of RMSE is the same as the predicted value, so it's easy to understand the magnitude of the error. In this case, this study cannot guarantee accurate predictions because the scale is not large.
V. CONCLUSION
This study uses the data sets listed in the Kagle to take
initiatives to explore the determinants of absenteeism from work The results provide a comprehensive understanding of absenteeism in the workplace. Based on a limited set of features, including employee demographics, this white paper attempts to present the best performance model for predicting workplace absence. Use machine learning techniques, including decision tree and neural network, along with functional criticality analysis to get the best results in terms of accuracy. Through this methodology, this study identified employee demographics patterns that could predict workplace absenteeism. This study contributes to the literature on workplace absenteeism by providing a global
model that summarizes absenteeism in employee
demographics. In fact, this research provides insight into how companies can manage their workplace absence potential. In addition, this study can provide specific work guidelines by quantifying the decision factors that actually occur to the carrier practitioners who are trying to prevent workplace absences.Nevertheless, this study recognizes important limitations of this study. Economic modeling is used to explore data sets and identify associations between various factors and rectal absences. However, social or psychological factors governing absenteeism cannot be considered. Therefore, it will be important to carry out quantitative research to find a theoretical basis for workplace absenteeism. The future works on this study can include (i) studying other feature selection schemes such as Random Forest feature importance, (ii) further experimentation with neural net architectures and (iii) getting more training examples from other hospitality services such as VRBO to boost the performance of K-means clustering with Ridge Regression model in particular.
REFERENCES
1. M. Kocakulah, A. Kelley, K. Mitchell, & M. Ruggieri, “Absenteeism problems and costs: Causes, effects and cures,” International Business & Economics Research Journal, 2012, 8(5), 81–88.
2. Mercer, Survey on the Total Financial Impact of Employee Absences, 2010, Retrieved March 23, 2013, from http://www.mmhayes.com/wpcontent/uploads/2011/06/
The%20Total%20Financial%20Impact%20of%20Employee%20Absen ces.pdf
3. M. Shoss, & L. Penney, “The economy and absenteeism: A macro-level study,” Journal of Applied Psychology, 2012, 97(4), 881–889 4. B. Thompson, K. Diamond, R. McWilliam, P.Snyder, & S. Snyder,
“Evaluating the quality of evidence from correlational research for evidence-based practice,” Exceptional Children, 2005, 71(2), 181–194. 5. R. Steers, & S. Rhodes, “Major influences on employee attendance: A
process model,” Journal of Applied Psychology, 1978, 63(4), 391–407. 6. S. Rhodes, & R. Steers, “A systematic approach to diagnosing employee
absenteeism,” Employee Relations, 1981, 3(2), 17–22.
7. K. K. Wong, “Getting what you paid for: Fighting wireless customer churn with rate plan optimization,” Database Marketing & Customer Strategy Management, 2011, 18(2). 73–82
8. R. Mowday, & D. Spencer, “The influence of task and personality characteristics on employee turnover and absenteeism incident,” Academy of Management Journal, 1981, 24(2), 634–642.
9. J. P. Leigh, “Sex differences in absenteeism,” Industrial Relations, 1983, 22(3), 349–361.
10. J. Hausknecht, N. Hiller, & R. Vance, “ Work-unit absenteeism: Effects of satisfaction, commitment, labor market conditions, and time,” Academy of Management Journal, 2009, 51(6), 1223–1245.
International Journal of Innovative Technology and Exploring Engineering (IJITEE) ISSN: 2278-3075, Volume-9 Issue-2, December 2019
12. J. Xie, & G. Johns, “Interactive effects of absence culture salience and group cohesiveness: A multi-level and cross-level analysis of work absenteeism in the Chinese context,” Journal of Occupational & Organizational Psychology, 2000, 73(1), 31–52.
AUTHORSPROFILE