International Journal of Innovative Technology and Exploring Engineering (IJITEE) ISSN: 2278-3075,Volume-8, Issue-10S, August 2019
Abstract: Glaucoma is considered to be one of the main root causes of blindness. As it shows no symptoms, if not properly identified at the correct time would result in the loss of vision. This paper proposes a method for the Automatic Detection of Glaucoma based on Refined Complete Local Binary Pattern and Random Forest Classification Method(RCLBP-RFC), which identifies the presence or the absence of glaucoma in a patient at an early stage. The first step is use to convert a color image into gray scale image and the second step we use Neighborhood Fuzzy K Means Clustering to segment Optic Disc(OD) and Optic Cup(OC). In the third step Statistical Optimized and Restoration model is use to extract the enhanced images using the restoration technique. In the Fourth step we exploit Refined Complete Local Binary Patterns Extraction to extract the most relevant features and finally, Random Forest Classification methods are involved to classify the features as normal, abnormal or early detected glaucoma. The experiments show that our RCLBP-RFC method achieves state-of-the-art OD and OC segmentation result on DRIONS dataset. Experimental results indicates that the proposed method identifies the presence or absence of glaucoma more precisely than other existing methods in terms of computational time and complexity, and accuracy.
Index Terms: Glaucoma, Random Forest, Neighborhood Fuzzy, Refined Complete Local Binary Pattern, Statistical Optimized.
.
I. INTRODUCTION
One of the most distinguished chronic eye diseases that harm the optic nerve head is glaucoma. Glaucoma is considered to be the second dominant reason of blindness worldwide and also to be the supreme cause of irreversible blindness. Automatic segmentation of Optic Disc (OD) and Optic Cup (OC) from fundus images is considered to be the primary function. In [1], Multi label Deep Network (M-Net) was designed that solved the OC and OC segmentation jointly via U-shape Convolutional Network, side-output layer and multi-label loss function. Though the running time was found to be less, one of the challenging issues that went unseen was the presence of blur or low contrast therefore
Revised Manuscript Received on July 08, 2019.
Narmatha venugopal, Computer and Information Science, Annamalai University, Annamalainagar, 608002.. [email protected]
Kamarasan mari, Computer and Information Science, Annamalai University, Annamalainagar, 608002..
increasing the involved in clustering and therefore glaucoma diagnosis.
A Gray Wolf Optimized Neural Network (GWO-NN)[2] identified the presence or absence of Glaucoma in a patient. Though early finding of Glaucoma was said to be attained, however, time consumed was found to be higher. A combination of clinical and multi resolution features was presented in [3] to assess optic nerve head for Glaucoma identification. Though prominent feature set were identified, with the lack of local central information, the complexity involved in glaucoma diagnosis was not analyzed. To address this issue, in the work, a Completed Local Binary Pattern, involving signs and magnitudes are investigated, so that prominent feature set by considering the local central information reduces the complexity involved in glaucoma diagnosis.
Yet another multi-parametric optic disk detection and localization method was presented in [4] using region-based statistical and textural features. With this, early diagnosis of Glaucoma was said to be ensured, however when the frequency of selected features grows, redundancy factors increases in magnitude with respect to the relevancy term, therefore selecting certain irrelevant features.
Motivated by the works of [1], [2], [3] and [4], in this work, Automatic Detection of Glaucoma based on Refined Complete Local Binary Pattern and Random Forest Classification Method(RCLBP-RFC) is presented.
II. RELATED WORKS
In [5], a method for automatic detection of glaucoma in retinal images utilizing a deep learning model together with the exploration of texture attributes via phylogenetic diversity indexes was presented. However, with cost expensive tools, glaucoma detection was found to be complex. To address this issue, a Cumulative Zero Count Local Binary Pattern, (CZ-CLBP) and Directional Differential Energy (DDE) was presented in [6], therefore minimizing the cost. As early detection is highly required, two automatic methods for
optic disc delineation and glaucoma quantification was
Automatic Detection of Glaucoma based on
Refined Complete Local Binary Pattern and
Random Forest Classification Method
16
Published By:
Blue Eyes Intelligence Engineering & Sciences Publication
Retrieval Number: J100308810S19/2019©BEIESP DOI: 10.35940/ijitee.J1003.08810S19
designed in [7]. Yet another automatic diagnosis method, based on Bit Plane Slicing (BPS) and Local Binary Patterns (LBP) was presented in [8]. An automated diagnosis system was designed in [9] by applying pyramid histogram of oriented gradients (PHOG) features, therefore resulting in diagnosis accuracy.
Yet another robust segmentation method was designed in [10] by integrating ResNet-34 model as encoding layers with U-Net decoding layers, therefore avoiding over-fitting and attaining robustness. However, with the increased fluid pressure in the optic nerve also resulted in vision loss. To address this issue, a scanning method based on Empirical Wavelet Transform was designed in [11] that in turn resulted in classification accuracy improvement. However with the unlabelled images disease diagnosis was said to be compromised. To address this issue, in [12], Super Pixels for Semi Supervised Segmentation was designed to generate a robust classifier via Co-forest Classifier. However, early glaucoma detection was not said to be ensured. In [13], a multi-layer perceptron with 12-D feature vector were utilized to classify the pixels based on optic cup segmentation. Besides, cup-to-disc ratio in addition to other contextual features was also extracted from the segmented OD and OC. . Motivated by the certainty that humans can identify optic discs in retinal images by discerning certain local features, a Local Feature Spectrum Analysis (LFSA) was presented in [14] that discarded the impact generated by the changeable spatial positions of local features. In [15], back propagation neural network was applied as the classifier model for detecting Retinal Nerve Fiber Layer (RNFL) in retinal fundus images, therefore resulting in higher rate of accuracy. Though accuracy was said to be improved, differentiation between healthy and glaucomatous subject were not said to be done. To address this issue, in [16], a machine learning based algorithm was designed that improved glaucoma diagnostic accuracy.
A new glaucoma Fuzzy Expert Systems for early glaucoma diagnosis was presented in [17] by considering both instrumental parameters and risk factors resulting in valuable identification suspected to have glaucoma. Yet another combination of clinical and multi resolution features using fundus images was presented in [18]. Computer-aided detection (CAD) was presented in [19] to make reliable and fast glaucoma diagnosis based on optic nerve features. Yet another deep learning method was applied in [20] for improving glaucoma prediction time.
As reported in the related work, one of the elements for early detection of glaucoma is CDR, which is obtained on the basis of the ratio of OD to OC, most of the work applied scientific classification methodologies for early glaucoma detection and classification. Another approach is using optimized neural network method, quantifying the images as normal or glaucomatous with vectors of attributes obtained through adaptive median filter. The present work differs from the others by using Neighbor Fuzzy K Means Cluster to address the presence of blur during segmentation. This method then explores the optimization and restoration of retinal fundus images for better texture pattern discrimination. Thus,
through the characterization of texture patterns, we were able to extract the local central information by applying the completed local binary pattern and classify images into normal and glaucomatous images in addition to early detection via Random Forest Classifier.
III. METHODOLOGY
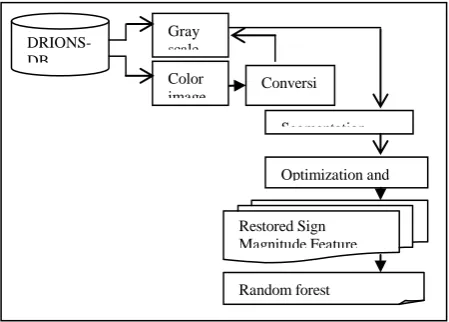
[image:2.595.306.531.246.407.2]The Glaucoma detection and classification process involves five different steps. The five different steps involved in the process of Automatic Detection of Glaucoma based on Refined Complete Local Binary Pattern and Random Forest Classification Method(RCLBP-RFC) are given below in figure 1.
Fig. 1 Block diagram of Automatic Detection of Glaucoma based on Refined Complete Local Binary Pattern and Random Forest Classification Method.
As shown in figure1, the first step in the proposed work involves the acquiring of retinal fundus images from DRIONS-DB [4], Digital Retinal Images for Glaucoma Detection and Classification. If the input retinal fundus image is a color image, the image is converted into gray scale image, this image is used as the input for the next step. With the input converted gray scale image, in the second step, Neighborhood Fuzzy K Means Clustering is applied to segment optic disk and optic cup. With the segmented portions, in the third step, enhanced optimization and restoration is performed to extract the enhanced images. With the optimal and restored segmented portions, Completed Local Binary Pattern is applied to extract the most relevant features forming the fourth step. Finally, with the extracted relevant features, Random Forest classifies the features for Glaucoma detection. Extracted relevant features are classified as normal, abnormal or early detected glaucoma, therefore improvement observed in early detection.
A. Gray Level Conversion The first step involved in the early Glaucoma Detection and
DRIONS-DB Digital Retinal Images
Gray scale image Color
image Conversion
Segmentation
Optimization and restoration
International Journal of Innovative Technology and Exploring Engineering (IJITEE) ISSN: 2278-3075,Volume-8, Issue-10S, August 2019 Classification is conversion of color retinal fundus images
into gray level images. If the acquired input retinal fundus images are in the form of gray scale, as the input for the next stage. On the other hand, if the input retinal fundus images are color images, they are converted into gray level.
B. Neighborhood Fuzzy K-Means model
The second step in early detection of Glaucoma and classification process is segmentation of optic disk and optic cup via Neighborhood Fuzzy K-Means model. With objective of segmenting gray level retinal fundus images with minimum blur, in this work, optic disk and optic cup are segmented using Fuzzy K means clustering for segmentation. The cup to disc ratio (CDR) [2] plays a salient feature in glaucoma screening and diagnosis. Hence effective segmentation of optic cup and optic disc from fundus images is an elementary task. For joint OD and OC segmentation, an entropy loss function based on MAXMIN principle (maximizing entropy and minimizing within cluster dispersion) is proposed, which deals well with the blur of pixel-wise segmentation for gray retinal fundus images.
Input: Retinal Fundus Image ‘ ’ Output: Low contrast segmented optic disk and optic cup images
1: Begin
2: For each Retinal Fundus Image
‘ ’
3: If ‘ ’ is a gray scale image 4: Go to step 8
5: End if
6: If ‘ ’ is a color image
7: Convert color image in to grayscale image 8: Measure initial blur map using equation (1)
9: Measure normalized blur map using equation (2)
10: Evaluate the objective function using equation (3)
11: Subject to constraints posted in equation (4) 12: End if
13: End for 14: End
Algorithm-1: Neighborhood Fuzzy K-Means Segmentation
Let ‘ ’ be a set of ‘ ’, gray scale images and let ‘ )’ represent the blurred gray scale retinal fundus image for which the amount of blurriness is to be measured. This is performed in this work by applying a blur measure operator ‘ ’ in the local neighborhood around a pixel ‘ ’. For this, B is applied on a local image neighborhood window ‘ ’ centered at pixel ‘ ’ to provide the blur measurement for this pixel. By moving this local image neighborhood for all the image pixels to be at the center of the neighborhood, the whole
image is said to be traversed resulting in the formation of initial blur map ‘ ’.
(1)
(2)
From the above two equations (1) and (2), ‘ ’ represents the blurred retinal fundus image with a blur measure operator of ‘ ’. With the formation of initial blur map ‘ ’, normalization ‘ ’ is performed using the minimum ‘ ’ and maximum ‘ ’ measurements. With the resultant local neighborhood-based low blur images the following objective function is derived to segment optic disc and optic cup with minimum blur. This is expressed as given below.
(3)
(4)
From the above equation (3) and (4), ‘ ’ refers to the objective function corresponding to the membership and cluster center matrix respectively with ‘ ’ representing the dissimilarity matrix between the ‘ ’ cluster center and ‘ ’ object. The first term in equation (3) refers to the cost function used in the traditional Fuzzy K-Means. On the other hand, the second term is added to maximizing entropy and minimizing within cluster dispersion with minimum blur contributing to the association of segmented objects. Therefore, the computational complexity involved in segmentation and therefore glaucoma diagnosis is said to be minimized.
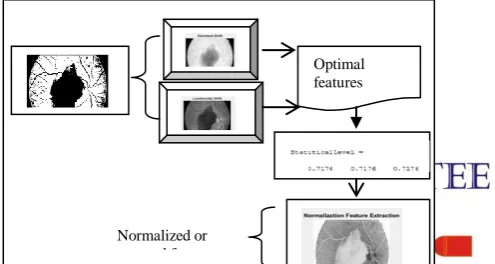
[image:3.595.306.554.701.833.2]C. Statistical Optimized and Restoration model With the segmented portions of retinal fundus image, optimal features have to be extracted. This is performed in this work by applying the Statistical Optimized Restoration model. In this work, separation of background and foreground retinal fundus image for non-uniformly luminosity and contrast images is performed so that optimal features are obtained. Next, with the optimal features generated, non-uniform illumination and contrast restoration is performed to improve the segmentation accuracy results. Figure 2 given below shows the block diagram of Statistical Optimized and Restoration model.
18
Published By:
Blue Eyes Intelligence Engineering & Sciences Publication
Retrieval Number: J100308810S19/2019©BEIESP DOI: 10.35940/ijitee.J1003.08810S19
Fig. 2 Block diagram of Statistical Optimized and Restoration model.
As shown in the block diagram, with the segmented portions of retinal fundus image given as input, along with the contrast drift and luminosity drift, optimization function is expressed as given below.
(5)
From the above equation (5), the original low contrast images ‘ ’ for ‘ ’ coordinates are obtained using the contrast drift term ‘ ’ for ‘ ’ coordinates, luminosity drift term ‘ ’ for ‘ ’ coordinates with the corresponding low contrast segmented optic disk and optic cup images ‘ ’ respectively. Besides, the corresponding low contrast segmented optic disk and optic cup images include both the foreground ‘ ’ and background ‘ ’ images respectively.
(6)
With the optimized non-uniformly luminosity and contrast resultant images, normalization is performed by applying the statistical model and is expressed as given below.
(7)
The pseudo code representation of Contrast-enhanced Statistical Optimized and Restoration is given below.
Input: Low contrast segmented optic disk and optic cup images ‘ ’, Contrast Drift ‘ ’, Luminosity Drift ‘LD’
Output: Contrast enhanced and non-uniform
luminous lesion images ‘ ’
1: Begin
2:Obtain Contrast Drift ‘ ’ and Luminosity Drift ‘LD’
3:For each low contrast segmented optic disk and optic cup images ‘ ’
4:Optimize low contrast images and obtain original low contrast images using equation (5)
5: Obtain the normalized image using equation (7) 6: Return (Contrast enhanced lesion images) 7: End for
8: End
Algorithm 2 Contrast-enhanced Statistical Optimized and Restoration algorithm
As given in the above Contrast-enhanced Statistical Optimized and Restoration algorithm, with the low contrast
segmented optic disk and optic cup images as input, the objective of the algorithm remains in improving the lesion of the contrast portions of the retinal fundus images without altering the features of the original retinal fundus images and lesion areas. In this algorithm, first optimized features are extracted by concentrating on both the non-uniform luminosity and contrast. Followed by which the restoration process is performed, therefore resulting in the improvement of the segmentation accuracy.
With the optimal and restored features, the next step in the proposed work is to extract the prominent feature along with the local central information, involving signs and magnitude is presented with the purpose of reducing the complexity involved in glaucoma diagnosis. This is performed in this work by applying Refined Complete Local Binary Patterns Extraction. Here, refined represents non-uniform luminous and contrast enhanced input images. Figure 3 shows the Refined Complete Local Binary Patterns Extraction model.
Fig. 3 Block diagram of Refined Complete Local Binary Patterns Extraction.
As illustrated in the figure 3, the contrast enhanced lesion images given as input forms the central gray level image ‘ ’. To start with, a histogram is obtained. Followed by which the local difference, being the product of sign and magnitude values are measured. Let us consider the image of size ‘ ’, to start with the LBP pattern of each restored features are identified and is expressed as given below.
(8) From the above equation (8), the local binary pattern ‘ ’ with total number of neighbouring pixels being ‘ ’ and radius of pixel being ‘ ’ is the difference between the central pixel ‘ ’ of gray image ‘ ’ and neighbour value ‘ ’ of gray image ‘ ’ respectively. With the analyzed local binary patterns, a histogram ‘ ’ is constructed and is expressed as given below.
(9)
From the above equation (9), ‘ ’ represents the maximal pattern
International Journal of Innovative Technology and Exploring Engineering (IJITEE) ISSN: 2278-3075,Volume-8, Issue-10S, August 2019 value with ‘ ’ representing the image size.
(10)
(11)
(12)
From the above equation (11) and (12), ‘ ’ represent the sign and ‘ ’ represent the magnitude of the corresponding contrast enhanced lesion images ‘ ’ provided as input. By applying the above refined and completed model of local binary pattern on the contrast enhanced lesion images, results in much better features being extracted, reducing the complexity involved in glaucoma diagnosis.
D. Random Forest Classifier
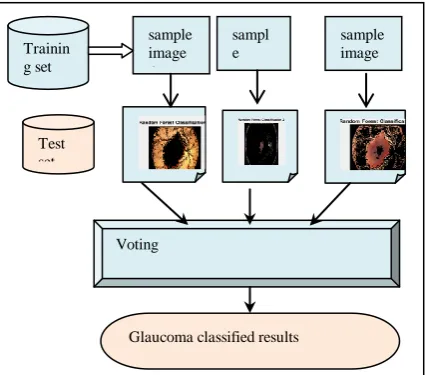
Finally, in this section, a classifier of type random forest is applied to the Refined Complete Local Binary Patterns Extracted. Figure 4 shows the structure of random forest classifier applied for glaucoma detection. As illustrated in the figure, random samples are obtained from DRIONS-DB [4], Digital Retinal Images for Glaucoma Detection and Classification. With the obtained random samples, decision tree are constructed for each sample, followed by which a classification result is obtained from each decision tree. The main objective here remains in minimizing the Gini index and therefore to enhance the homogeneity of obtained nodes. This is performed in the proposed work by applying Twoing index and is expressed as given below.
(13)
[image:5.595.50.263.560.747.2]From the above equation (13), ‘ ’ denotes the members of ‘ ’ class in left node and ‘ ’ denotes members of ‘ ’ class in right node respectively. Next, for each classified results, a voting is performed.
Fig. 4 Block diagram Glaucoma classified results using random forest classifier
(14)
(15) From the above equation (14), the score ‘ ’ of each class ‘ ’ for corresponding tree ‘ ’ for the instance ‘ ’, is measured. Finally, the results are classified based on the most votes as the final classification and this is expressed as given below.
(16) The pseudo code representation of Glaucoma Random Forest Classification for early diagnosis is given below.
Input: Contrast enhanced lesion images
‘ ’
Output: Early glaucoma detection 1: Begin
2: For each Contrast enhanced lesion images
‘ ’
3: Measure LBP pattern of each restored features using equation (8)
4: Obtain histogram for analyzed LBP using equation (9)
5: Measure CLBP of each restored features using equation (10)
6: By using CLBP measure homogeneity to form tree using equation (13)
7: Measure the score of each class using equation (14)
8: Perform final classification based on maximum votes using equation (15)
9: If training image equivalent to ‘ ’ 10: Images detected with glaucoma 11: End if
12: If training image not equivalent to ‘ ’ 13: Images are not detected with glaucoma 14: End if
15: If training image more equivalent to
‘ ’
16: Images forms early detection with glaucoma
17: End if 18: End for 19: End
Algorithm 3 Glaucoma Random Forest Classification algorithm
As given in the above Glaucoma Random Forest Trainin
g set
Test set
sample image
sampl e image
sample image
Voting
20
Published By:
Blue Eyes Intelligence Engineering & Sciences Publication
Retrieval Number: J100308810S19/2019©BEIESP DOI: 10.35940/ijitee.J1003.08810S19
Classification algorithm, for each contrast enhanced lesion images, initially, LBP is first obtained for each feature and followed by which, CLBP of each restored images are obtained to form tree. Then, final classification is performed on the basis of votes. If the training images are found to be equivalent to the final classified image, then the images are said to be detected with glaucoma. If the training images are not found to be equivalent to the final classified image, then the images are not said to be detected with glaucoma. Finally, if training image is found to be more equivalent to the final classified image, then a possible of early detection is said to be expected.
IV. EXPERIMENTAL SETTINGS
In this section, the results of four existing classifier methods with the proposed classifiers are evaluated on the publicly available retinal fundus datasets DRIONS [4] to test the robustness of the proposed method. The DRIONS dataset comprises of 110 color retinal fundus images and annotation of optical nerve head (ONH) by two trained human experts. The data was obtained from an analogical color fundus camera and digitized using a high-resolution scanner HP-Photo Smart-S20. The size of each image is 8 bits per pixel with a resolution of 600×400. The average age of the patients in this database is 53.0 years with a male to female ratio is 46.2%. The ratio of patients with chronic glaucoma disease is 23.1%.
V. RESULT AND DISCUSSION
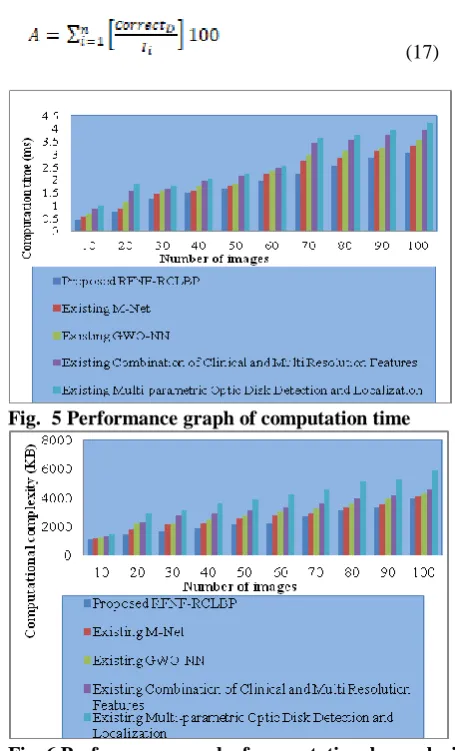
In this section, we compare the performance of Random Forest-based Neighborhood Fuzzy Refined Complete Local Binary Pattern (RFNF-RCLBP) method with four other existing state-of-art-works, Multi label Deep Network (M-Net) [1], Gray Wolf Optimized Neural Network (GWO-NN) [2], Combination of Clinical and Multi Resolution Features [3] and Multi-parametric Optic Disk Detection and Localization [4]. The above algorithms are implemented with MATLAB. on a workstation with i3 Processor running at 3.06 GHz with 4 GB of RAMs. In the simulation, number of retinal fundus images in the range between 10 and 100 each with varying template size was selected. The comparative metrics are the computational time, computational complexity and diagnosis accuracy with respect to 100 different images pertaining to varying sizes are selected.
Table 1: Performance Analysis of Computational Time, Complexity and Diagnosis accuracy.
Methods C.Ti me
C.Compl exity
Diagnosis Accuracy Propose
d
RFNF-RC
0.43 ms
1120KB 0.80
LBP
M-Net 0.54
ms
1180KB 0.70
GWO-N N
0.67 ms
1230KB 0.70
CC-MR F
0.86 ms
1320KB 0.60
MP-OD Detection and Localizatio n
0.97 ms
1430KB 0.60
Finally, diagnosis accuracy ‘ ’ is measured that refers to percentage ratio of number of retinal images correctly diagnosed to number of images.
[image:6.595.304.533.47.218.2](17)
[image:6.595.311.539.274.650.2]Fig. 5 Performance graph of computation time
[image:6.595.47.277.720.787.2]International Journal of Innovative Technology and Exploring Engineering (IJITEE) ISSN: 2278-3075,Volume-8, Issue-10S, August 2019
Fig. 7 Performance graph of glaucoma diagnosis accuracy
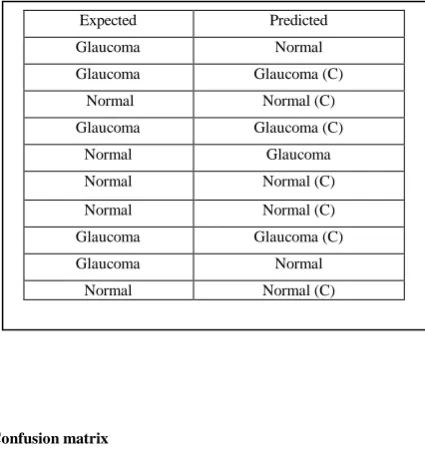
[image:7.595.55.276.47.249.2]Figure 7 given above plots convergence graph of glaucoma diagnosis accuracy for 100 different numbers of images. The corresponding confusion matrix is given below.
Fig. 8 confusion matrix for glaucoma detection To design confusion matrix (as in figure 8) first glaucoma classified as glaucoma was measured (3), normal classified as normal was measured (4) and incorrect predictions were also calculated i.e., glaucoma classified as normal (2) and normal classified as glaucoma (1). With the above said values, the confusion matrix in figure is obtained. Accuracy is found to be improved by applying proposed RCLBP-RFC method. This is because of the application of Gini index
homogeneity. Besides, by performing the Twoing index, images are said to be classified in an appropriate manner. Finally, with the argument maximization of the score value via voting, classification are said to be ensured, therefore diagnosing the glaucoma disease. With this, glaucoma diagnosis accuracy is improved by 11% compared to M-Net [1], 19% compared to GWO-NN [2], 41% compared to Combination of Clinical and Multi Resolution Features [3] and 30% over Multi-parametric Optic Disk Detection and Localization [4] respectively.
VI. CONCLUSION
A novel method has been proposed for glaucoma detection and classification from retinal fundus images. This method uses five classes Neighborhood Fuzzy K-Means method for segmenting optic disk optic cup via blur images and hence forming normalization, therefore to minimize the computational time involved. For optimization and restoration, statistical function is also used. Prominent feature extraction with local central information is obtained by applying Refined Complete Local Binary Patterns. Finally, the classification has been performed with random forest classifier with argument maximization of the scores with highest votes. The performance is analyzed using the metrics like computation time, computational complexity and glaucoma diagnosis accuracy. Experimental outcomes show that the proposed glaucoma detection and classification method recognizes the presence or absence of Glaucoma more accurately than the other state-of-the-art works. For the enhancement of the proposed work in future, other machine learning techniques could be deployed to increase the performance.
REFERENCES
1. Huazhu Fu, Jun Cheng, Yanwu Xu, Damon Wing Kee Wong, Jiang Liu, and Xiaochun Cao, “Joint Optic Disc and Cup Segmentation Based on Multi-label Deep Network and Polar Transformation”, Computer Vision and Pattern Recognition”, IEEE Transactions on Medical Imaging, Jun 2017 (Multi label Deep Network (M-Net)).
2. G. Gifta Jerith, P. Nirmal Kumar, “Recognition of Glaucoma by means of Gray Wolf Optimized Neural Network”, Multimedia Tools and Applications, Springer, Jan 2019.(Gray Wolf Optimized Neural Network (GWO-NN)).
3. Q1T.R. Kausu, Varun P. Gopi, Khan A. Wahid, Wangchuk Doma, Swamidoss Issac Niwas, “Combination of clinical and multiresolution features for glaucoma detection and its classification using fundus images”, Bio Cybernetics and Bio Medical Engineering, Elsevier, Feb 2018 (Combination of Clinical and Multi Resolution Features). 4. Zaka Ur Rehman, Syed S. Naqvi, Tariq M. Khan, Muhammad Arsalan,
Muhammad A. Khan, M.A. Khalil, “Multi-parametric Optic Disc Segmentation Using Superpixel Based Feature ClassiÞcation”, Expert Systems With Applications, Elsevier, Dec 2018 (Multi-parametric Optic Disk Detection and Localization) .
5. Marcos Vinõcius dos Santos Ferreira, Antonio Oseas de Carvalho Filho, Alcilene Dalõlia de Sousa, Aristofanes Corröea Silva, Marcelo Gattass, “Convolutional neural network and texture descriptor-based automatic detection and diagnosis of Glaucoma”, Expert Systems With Applications, Elsevier, Jun 2018.
6. Rashmi Panda, N.B. Puhan, Aparna Rao, Debananda Padhy, Ganapati Panda, “Automated retinal nerve
fiber layer defect detection using fundus imaging in glaucoma”, Computerized Medical Imaging Glaucoma Normal
Glaucoma 3 1
Normal 2 4
Expected Predicted
Glaucoma Normal
Glaucoma Glaucoma (C)
Normal Normal (C)
Glaucoma Glaucoma (C)
Normal Glaucoma
Normal Normal (C)
Normal Normal (C)
Glaucoma Glaucoma (C)
Glaucoma Normal
Normal Normal (C)
[image:7.595.55.268.383.615.2]22
Published By:
Blue Eyes Intelligence Engineering & Sciences Publication
Retrieval Number: J100308810S19/2019©BEIESP DOI: 10.35940/ijitee.J1003.08810S19
and Graphics journal homepage”, Elsevier, May 2018.
7. Antonio Sousa Vieira de Carvalho Juniora, Edson Damasceno Carvalhoa, Antonio Oseas de Carvalho Filho, Alcilene Dalília de Sousa, Aristófanes Corrêa Silva, Marcelo Gattass, “Automatic methods for diagnosis of glaucoma using texture descriptors based on phylogenetic diversity”, Computers and Electrical Engineering, Elsevier, Jun 2018.
8. Shishir Maheshwari, Vivek Kanhangad, Ram Bilas Pachori, Sulatha V. Bhandary, U. Rajendra Acharya,” Automated glaucoma diagnosis using bit-plane slicing and local binary pattern techniques”, Computers in Biology and Medicine, Elseiver, Nov 2018.
9. Neha Gour, Pritee Khanna, “Automated Glaucoma Detection using GIST and Pyramid Histogram of Oriented Gradients (PHOG) descriptors”, Pattern Recognition Letters, Elsevier, Nov 2018.
10. Shuang Yu Di Xiao Shaun Frost Yogesan Kanagasingam, “Robust Optic Disc and Cup Segmentation with Deep Learning for Glaucoma Detection”, Computerized Medical Imaging and Graphics, Elsevier, Feb 2019.
11. Shishir Maheshwari, Ram Bilas Pachori, and U. Rajendra Acharya, “Automated Diagnosis of Glaucoma Using Empirical Wavelet Transform and Correntropy Features Extracted from Fundus Images”, IEEE Journal of Biomedical and Health Informatics ( Volume: 21 , Issue: 3 , May 2017 ).
12. Mohammed El Amine Bechar, Nesma Settouti, Vincent Barra, Mohamed Amine Chikh, “Semi-supervised superpixel classification for medical images segmentation: application to detection of glaucoma disease”, Multidimensional Systems and Signal Processing, Springer, Mar 2017. 13. Muhammad Nauman Zahoor and Muhammad Moazam Fraz, “A
Correction to the Article Fast Optic Disc Segmentation in Retina Using Polar Transform''”, IEEE Access, Jan 2018.
14. Wei Zhou, Hao Wu, Chengdong Wu, Xiaosheng Yu, and Yugen Yi, “Automatic Optic Disc Detection in Color Retinal Images by Local Feature Spectrum Analysis”, Computational and Mathematical Methods in Medicine, Hindawi, Mar 2018.
15. Anindita Septiarini, Dr, Agus Harjoko, PhD, Reza Pulungan, Dr.-Ing, Retno Ekantini, Dr, “Automated Detection of Retinal Nerve Fiber Layer by Texture-Based Analysis for Glaucoma Evaluation”, Healthcare Informatics Research, The Korean Society of Medical Informatics, Jun 2018
16. Guangzhou An, Kazuko Omodaka, Kazuki Hashimoto, Satoru Tsuda, Yukihiro Shiga, Naoko Takada, Tsutomu Kikawa, Hideo Yokota, Masahiro Akiba, Toru Nakazawa, “Glaucoma Diagnosis with Machine Learning Based on Optical Coherence Tomography and Color Fundus Images”, Journal of Healthcare Engineering, Hindawi, Feb 2019. 17. A. Soltania, T. Battikha, I. Jabri, N. Lakhoua, “A new expert system based
on fuzzy logic and image processing algorithms for early glaucoma diagnosis”, Biomedical Signal Processing and Control, Elsevier, Oct 2017.
18. T.R. Kausu, Varun P. Gopi, Khan A. Wahid, Wangchuk Doma, Swamidoss Issac Niwas, “Combination of clinical and multiresolution features for glaucoma detection and its classification using fundus images”, Bio Cybernetics and Bio Medical Engineering, Elsevier, Feb 2018.
19.Yuki Hagiwara, Joel En Wei Koh, Jen Hong Tan, Sulatha V Bhandary, Augustinus Laude, Edward J Ciaccio, Louis Tong, U Rajendra Acharya, “Computer-Aided Diagnosis of Glaucoma Using Fundus Images: A Review”, Computer Methods and Programs in Biomedicine, Elsevier, Jul 2018.
20.A. Sevastopolsky, “Optic Disc and Cup Segmentation Methods for Glaucoma Detection with Modification of U-Net Convolutional Neural Network”, Pattern Recognition and Image Analysis, 2017, Vol. 27, No. 3, pp. 618–624. © Pleiades Publishing, Ltd., 2017
AUTHORS PROFILE
NARMATHA VENUGOPAL, Computer and Information Science, Annamalai University, Annamalainagar, 608002.