RAISING SECTOR SKILL LEVELS –
HOW RESPONSIVE IS LOCAL
TRAINING SUPPLY?
RESEARCH REPORT 9
APRIL 2005
RAISING SECT
OR SKILL LEVELS – HO
W RESPONSIVE IS LOC
AL
TRAINING SUPPL
Y?
RESEARCH REPOR
T 9 –
APRIL 2005
To obtain copies of this document, contact Sector Skills Development Agency Callflex Business Park
Golden Smithies Lane Wath-upon-Dearne South Yorkshire S63 7ER
Raising sector skill levels: how responsive is
local training supply?
Geoff Mason
Matt Osborne
Ana Rincon-Aznar
National Institute of Economic and Social Research, London
Email: [email protected], [email protected],
[email protected]
Sector Skills Development Agency: Research Series
Foreword
In October 2002 the Department for Education and Skills formally launched Skills for Business, a new UK-wide network of employer-led Sector Skills Councils (SSCs), supported and directed by the Sector Skills Development Agency (SSDA). The purpose of Skills for Business is to bring employers more centre stage in articulating their skill needs and delivering skills-based productivity improvements that can enhance UK competitiveness and the effectiveness of public services. The remit of the SSDA includes establishing and progressing the network of SSCs, supporting the SSCs in the development of their own capacity and providing a range of core services. Additionally the SSDA has responsibility for representing sectors not covered by a SSC and co-ordinating action on cross cutting and generic skills issues.
Research, and developing a sound evidence base, are central to the SSDA and to Skills for Business as a whole. It is crucial in: analysing productivity and skill needs; identifying priorities for action; and improving the evolving policy and skills agenda. It is vital that the SSDA research team works closely with partners already involved in skills and related research to generally drive up the quality of sectoral labour market analysis in the UK and to develop a more shared understanding of UK-wide sector priorities.
The SSDA is undertaking a variety of activities to develop the analytical capacity of the network and enhance its evidence base. This involves: developing a substantial programme of new research and evaluation, including international research; synthesizing existing research; developing a common skills and labour market intelligence framework; taking part in partnership research projects across the UK; and setting up an expert panel drawing on the knowledge of leading academics, consultants and researchers in the field of labour market studies. Members of this panel will feed into specific research projects and peer review the outputs; be invited to participate in seminars and consultation events on specific research and policy issues; and will be asked to contribute to an annual research conference.
The SSDA takes the dissemination of research findings seriously. As such it has developed this dedicated research series to publish all research sponsored by the SSDA and results are being made available in both hard copy and electronically on the SSDA website.
Lesley Giles
Contents
EXECUTIVE SUMMARY ……… 4
1
Background ………. 8
2
Methodology……… 15
3 Overview of telephone survey findings ……….. 21 4
Vehicle maintenance and repair: skill upgrading requirements and local training provision………
46
5 Telecommunications services: skill upgrading requirements and local training provision ………
53
6
Mechanical engineering: skill upgrading requirements and local training provision ……….
61
7
Textiles, clothing and footwear: skill upgrading requirements and local training provision ……….
68
8
Conclusions………. 75
References……… 82
Annex 1: SIC codes for sectors reported in analysis of NESS 2003 data
Annex 2: Survey questionnaire
Detailed employer responses to telephone survey available from: http://www.ssda.org.uk/ssda/default.aspx?page=41
Acknowledgements
EXECUTIVE SUMMARY
1. In this study we seek to shed new light on the extent and nature of any mismatches between employers’ training requirements and local vocational and educational training (VET) provision. We have made use of an innovative methodology which proceeded in two stages:
x A telephone survey of establishments in selected sectors and regions, designed to capture in finer detail than hitherto available the extent and nature of employers’ current skill improvement and updating needs (conducted in June and July 2004)
x Interviews with staff in colleges and training providers in the same regions to discuss the survey findings on local employers’ training requirements, and then to probe the extent to which these providers are already catering to those requirements and the nature of any constraints which may be impeding them from doing so (conducted between September and December 2004).
2. The survey covered employers in four sectors and eight regions which were chosen for diversity:
x Maintenance and repair of motor vehicles: Devon and Cornwall, Greater Manchester
x Telecommunications services: London West, Berkshire, Hampshire; Greater Merseyside, Greater Manchester, Cheshire and Warrington
x Mechanical engineering, vehicles and other engineering: Black Country, Hampshire and Isle of Wight
x Textiles, clothing and footwear manufacture: Leicestershire, West Yorkshire
3. In all four sectors large majorities of establishments reported that the skills needed by core groups of employees were expected to change over the next 12 months. Detailed follow-up questioning shed considerable light on the nature of these changing skill requirements. For example, the sought-after improvements in technical skills centred in vehicle maintenance on diagnostics, electronics and keeping up to date with new technology. In the other three sectors updating in the use of new technology also featured alongside sector-specific technical skills such as improved product knowledge and electrical installation and cabling in telecoms services; machine-setting and specialised programming in mechanical engineering; and use of standard programmes and adaptation to new software in textiles, clothing and footwear. The survey results also permitted a close monitoring of the extent to which technical skill upgrading needs overlap with required improvements in the skills required to communicate effectively with customers and work colleagues and in leadership and supervisory skills.
perceived lack of relevance of their courses to companies’ training needs and expected costliness.
5. These reservations did not appear in the main to be based on past negative experiences of using college and training provider services. Indeed, most establishments which had used external training suppliers in the past gave positive evaluations of their effectiveness. However, the majority of employers simply believed that colleges and many commercial providers were unlikely to be able to help them update their workers’ skills. The reactions of many college and training provider interviewees to the survey results showed that there is in fact some justification for these beliefs.
6. The bulk of skill upgrading needs identified in the survey related, firstly, to adult employees and, secondly, to gaps in skills which could be filled through reasonably short courses of training. The majority of FE college departments interviewed for the study were not well placed to commit resources to the preparation of training needs analyses and training plans for local employers or indeed to deliver much of the training that was apparently needed.
7. The departments’ stated first priority was to deliver courses, usually 12 months or more in duration, that led to accredited qualifications that would attract Learning and Skills Council (LSC) funding. Although some examples of adult participation in these courses were found, most of the provision was for 16-20 year olds at the beginning of their careers. Most teaching staff were fully engaged in delivering these LSC-funded courses and were therefore not available for short course preparation or delivery. In addition, several department managers reported that efforts to provide updating training would be hampered by out-of-date equipment and gaps in the FE teachers’ own skills and knowledge.
8. Where FE departments did have experience in providing short training courses for local employers, these relationships tended to be with large companies who could put forward a sufficient number of trainees to justify the departments’ efforts in developing the courses. There was reluctance to invest time in developing relationships with small and medium-sized enterprises (SMEs) who could only offer small numbers of trainees and who were seen as unlikely to be willing to pay the full costs of training in any event.
9. Many commercial training providers were also strongly wedded to LSC funding requirements and to beginning-of-career training. However, partly as a result of the entrepreneurial skills required for some of these organisations to survive in the changing market for training over recent decades, several training providers had already developed the capacity to work with local employers to meet their adult employees’ skills updating needs. This was particularly true in regions where the local industry had been relatively buoyant for some time (for example, mechanical engineering in southern England) or in sectors such as telecoms services where keeping up to date with rapidly-changing technologies and products is a pre-condition for commercial survival.
provide opportunities for economies of scale and were less likely to be willing to pay for full-cost training courses. However, there were some examples of SMEs being brought together through joint membership of training associations which sought to identify the commonalities among their many different training requirements.
11. In spite of some positive examples of vocational and educational training (VET) provision that meets local employers’ skill upgrading needs, the central conclusion that emerges from the study for all four sectors is that significant gaps exist in training provision, in particular, in short courses designed to update the skills of adult employees and particularly adult employees in SMEs. Given the diversity of the four sectors in question, it would not be surprising to find that these gaps are in fact widespread across the UK economy, although further research would be required to establish this with certainty. Although the sectors share a common problem, it is also evident that the detailed nature of the skills required and the most appropriate solutions are different across the four sectors studied here. Each sector requires a different approach, building on the existing skills and qualifications of the sector, in order to surmount the specific barriers that it faces in meeting its skill upgrading needs.
12. The study’s findings have important implications for Sector Skills Councils (SSCs), some of which are presently engaged in drawing up Sector Skills Agreements (SSAs) between employers and education and training suppliers. The detailed nature of the skills required and the most appropriate solutions clearly differ across the four sectors studied here. Each sector requires a different approach, building on the existing skills and qualifications of the sector, in order to surmount the specific barriers that it faces in meeting its skill upgrading needs.
13. In order to develop the labour market information base required by SSAs, we believe there is a strong case for more surveys of the present kind to be carried out in other sectors and regions. In the process of developing SSAs, some SSCs could make use of new survey information to negotiate with the LSC for new resources to be made available for short courses designed to meet the training needs of local employers.
they are rolled out to the National Employer Training Programme, must also be based on an assessment of the existing skills and qualifications of the sectoral workforce. SSCs already have responsibility for identifying priority training needs at NVQ3 level and above and this issue will no doubt be covered in SSAs. The Sector Skills Agreements will thus form another important input into policy development around NETP.
15. More information of the sector-specific kind produced through this study can help college departments and training providers to see more clearly what they could do – even with no changes in present resources or funding arrangements -- to meet local employers’ training needs. For example, additional closely targetted funding such as that released to designated COVEs (Centres of Vocational Excellence) has helped several departments and training organisations to upgrade their equipment and prompted them to take a more pro-active approach to building relationships with employers. In some cases it has also motivated them to seek out additional non-LSC funding sources to support their short course training provision. Also, the growing numbers of union learning representatives are well placed to intermediate between colleges and employers, providing information to colleges about what local training needs are and to employers about what courses are locally available.
16. Thought also needs to be given to new incentives for SMEs to pool resources as subscriber-members and participants in collective training associations of different kinds. Without such policy innovations, large numbers of SMEs are likely to continue trying to ‘get by’ on their own without really addressing their skill upgrading needs -- and colleges and other training providers will continue to assume that, in the end, most SMEs are either unwilling or unable to pay the costs of training courses delivered outside the LSC funding system, thus perpetuating a ‘vicious circle’ based on existing and perceived attitudes and funding issues.
This research report presents findings from a study into the training needs of
employers who wish to upgrade the skills of their existing staff and the ability of local Vocational and Educational Training providers to respond to these needs. The National Institute of Economic and Social Research was commissioned to conduct this research by the Sector Skills Development Agency (SSDA), to help inform and fill in information gaps around ‘Improving Learning Supply’, a key area of work for the SSDA and the Skills for Business network as a whole.
1. Background
The White Paper 21st Century Skills: Realising our Potential outlined a number of planned reforms which are designed to increase the responsiveness of further education (FE) colleges and training providers to employers’ demand for enhanced workforce skills. These reforms follow a long period of criticism of the variable quality of training provision by colleges and commercial training organisations, for example, as expressed in the Cabinet Office Strategy Unit report In Demand – Adult
Skills in the 21st Century (2001).
As recent guidance on effective employer engagement in post-16 learning makes clear, a number of positive examples of initiatives by colleges and training providers can now be identified which – in their specific contexts – go some way to addressing problems such as excessive bureaucracy and out-of-date content (Hughes, 2003). However, many colleges and training providers still have a long way to go to develop the types of training that will match employers’ rapidly-changing skill requirements. For example, a recent survey of college principals identified weaknesses such as inflexible timetables and lack of industry-related skills among staff which were inhibiting greater responsiveness to employers’ training needs (McCoshan and Otero, 2003).
Analysis of data from the 2003 National Employers Skill Survey (NESS) shows that there is substantial variation between industries in the extent to which use is made of FE colleges for staff training. 1 Among manufacturing sectors, for example, as many as half of all establishments in building installation had used FE colleges for training purposes in the last 12 months; in mechanical engineering nearly four in ten establishments had done so (Figure 1). By contrast in publishing and in textiles, clothing and footwear the proportions of establishments making use of FE colleges for staff training were as low as 19% and 15% respectively.
Among service industries, shown in Figure 2, the industries making greatest use of FE college training services were public sector-oriented (eg, education, social work and health – between 50-60% of establishments) and technical consultancy, testing and other related business services (43%). The lowest levels of involvement with FE colleges were in sectors such as transport services (13%) and specialised retailing (12%).
In all sectors the proportion of establishments making use of FE college training services is substantially below the proportions who funded or arranged employee training of one kind or another during the same 12 month period. The disparities between the two measures are greatest in service sectors such as banks and building societies in which some 93% of establishments arranged training of some kind but only 14% of them made use of FE college training services. Another example is telecommunications services in which 90% of establishments provided training but only 25% made use of colleges for this purpose.
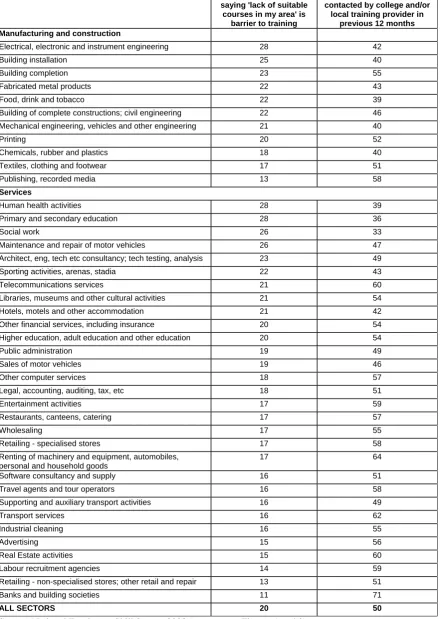
Clearly, in organising training for their employees, employers have many other options besides colleges to turn to for training provision, including their own resources and the training services provided by many equipment and machinery suppliers. Table 1 shows that only minorities of establishments in each sector cited ‘lack of suitable courses in my area’ as a barrier to developing or maintaining a proficient team of staff. The proportions of establishments so responding ranged from 24% in mechanical engineering down to as few as 8% in banking.
1
NESS 2003 covered 72,100 establishments in a nationally representative sample of employers in England. Figures 1-2 and Table 1 are based on a sub-sample of 54,063 establishments with five or more employees. As Forth (2003) showed in relation to Employers Skill Survey 2001, exclusion of micro-establishments with 1-4 employees permits a substantial degree of sectoral disaggregation while retaining confidence in the national representativeness of the sectoral sub-samples under consideration. This enables us to identify 46 sectors which, with a small number of exceptions, are all represented by 400 or more establishments with five or more employees. The exceptions are food, drink and tobacco; textiles, clothing and footwear; travel agents and tour operators; industrial cleaning; and
Figure 1: Percentage of manufacturing and construction establishments (1) making use of FE colleges for staff training and funding
(2) funding or arranging training for employees, analysed by sector
Source: National Employers Skill Survey 2003 Notes:
1. Refers to establishments with 5 or more employees 2. Estimates are establishment-weighted.
0 10 20 30 40 50 60 70 80 90 100
Textiles, clothing and footwear Publishing, recorded media Printing Building completion Food, drink and tobacco Fabricated metal products Chemicals, rubber and plastics Building of complete constructions;
civil engineering Electrical, electronic and instrument
engineering Mechanical engineering, vehicles and
other engineering Building installation
Figure 2: Percentage of service establishments (1) making use of FE colleges for staff training and funding (2) funding or arranging training for employees, analysed by sector
Source: National Employers Skill Survey 2003 Notes:
1. Refers to establishments with 5 or more employees 2. Estimates are establishment-weighted.
0 10 20 30 40 50 60 70 80 90 100
Retailing - specialised stores Transport services Renting of machinery and equipment, automobiles, personal and household goods Banks and building societies Industrial cleaning Retailing - non-specialised stores; other retail and repair Labour recruitment agencies Wholesaling Bars Restaurants, canteens, catering Travel agents and tour operators Entertainment activities Real Estate activities Other financial services, including insurance Advertising Software consultancy and supply Supporting and auxiliary transport activities Other computer services Telecommunications services Maintenance and repair of motor vehicles Hotels, motels and other accommodation Sales of motor vehicles Sporting activities, arenas, stadia Legal, accounting, auditing, tax, etc Libraries, museums and other cultural activities Architect, eng, tech etc consultancy; tech testing, analysis Public administration Human health activities Social work Higher education, adult education and other education Primary and secondary education
However, large proportions of establishments appear to have little contact with or knowledge of courses provided by colleges and other external training providers. Roughly half of all establishments with five or more employees said that they had not had any contact with colleges or other training providers in the last 12 months to discuss the courses they provided. The proportions saying this ranged from 39% in food and drink and 40% in mechanical engineering, building installation and chemicals up to 60% in telecoms services, 62% in transport services and 71% in banking (Table 1).
These low levels of interaction between employers and colleges and other external training providers are the basis for concern about potential mismatches between employers’ skill upgrading needs and local provision of vocational education and training (VET). However, much of the discussion of the responsiveness of local training providers to employers’ requirements takes little account of sectoral differences of the magnitude revealed by the NESS data. Furthermore, a lot of available survey information on just what those training requirements are tends to rely on very broad categories of skill such as ‘technical and practical skills’, ‘communication skills’ or ‘problem-solving skills’.
In the present study we seek to shed new light on the extent and nature of any mismatches between employers’ training requirements and local VET provision. We do so through an innovative methodology which proceeded in two stages:
1. A telephone survey of establishments in selected sectors and regions, designed to capture in finer detail than hitherto available the extent and nature of employers’ current skill improvement and updating needs (conducted in June and July 2004) 2. Interviews with staff in colleges and training providers in the same regions to
discuss the survey findings on local employers’ training requirements, and then to probe the extent to which these providers are already catering to those requirements and the nature of any constraints which may be impeding them from doing so (conducted between September and December 2004).
Due to the variation in VET systems and funding regimes across the four nations of the UK, the study chose to focus on only one of the countries, England. This was done to facilitate the drawing of conclusions regarding the impact of VET funding procedures on provision. The approach was also consistent with the analysis of the NESS data which informed the selection of sectors – this survey covers England only.
The key research questions to be addressed by the study were defined as follows:
1. In four selected sectors, what do employers believe are the main skills upgrading requirements for the occupation groups which are deemed to be most ‘critical’ to their firms’ future performance?
2. To what extent do these employers rely – or plan to rely – on FE colleges and other external training providers to help meet these skills upgrading needs?
3. What other means of enhancing their critical employees’ skill levels do employers make use of?
5. What types of college and other external training provision are most attractive to firms as ways of meeting their skills upgrading requirements?
6. For colleges and other training providers which are heavily involved in supplying training services to local employers, what are the main factors which help to nurture these relationships?
7. For colleges and other training providers which are not heavily involved in supplying training services to local employers, what are the main barriers which impede them from doing so?
8. What specific kinds of changes in the organisation and funding of colleges and other training providers might help them to improve their responsiveness to employers’ training needs?
Table 1: Percentage of establishments reporting (1) lack of suitable local training courses (2) lack of recent contacts with local colleges and/or training providers, analysed by sector (Ranked by % saying lack of local courses is a barrier to training)
% of establishments saying 'lack of suitable
courses in my area' is barrier to training
% of establishments NOT contacted by college and/or
local training provider in previous 12 months Manufacturing and construction
Electrical, electronic and instrument engineering 28 42
Building installation 25 40
Building completion 23 55
Fabricated metal products 22 43
Food, drink and tobacco 22 39
Building of complete constructions; civil engineering 22 46
Mechanical engineering, vehicles and other engineering 21 40
Printing 20 52
Chemicals, rubber and plastics 18 40
Textiles, clothing and footwear 17 51
Publishing, recorded media 13 58
Services
Human health activities 28 39
Primary and secondary education 28 36
Social work 26 33
Maintenance and repair of motor vehicles 26 47
Architect, eng, tech etc consultancy; tech testing, analysis 23 49
Sporting activities, arenas, stadia 22 43
Telecommunications services 21 60
Libraries, museums and other cultural activities 21 54
Hotels, motels and other accommodation 21 42
Other financial services, including insurance 20 54
Higher education, adult education and other education 20 54
Public administration 19 49
Sales of motor vehicles 19 46
Other computer services 18 57
Legal, accounting, auditing, tax, etc 18 51
Entertainment activities 17 59
Restaurants, canteens, catering 17 57
Wholesaling 17 55
Retailing - specialised stores 17 58
Renting of machinery and equipment, automobiles, personal and household goods
17 64
Software consultancy and supply 16 51
Travel agents and tour operators 16 58
Supporting and auxiliary transport activities 16 49
Transport services 16 62
Industrial cleaning 16 55
Advertising 15 56
Real Estate activities 15 60
Labour recruitment agencies 14 59
Retailing - non-specialised stores; other retail and repair 13 51
Banks and building societies 11 71
ALL SECTORS 20 50
2. Methodology
2.1 Selection of sectors
In order to carry out the telephone survey of establishments described above, we needed to choose four diverse sectors and two different regions per sector on which to focus our enquiries. Our emphasis on diversity reflected our wish to provide research evidence which might have a wider application even though our methodology depended on surveying employers in fairly narrowly-defined sectors and local LSC areas.
In selecting the sectors we aimed for a mix along the following lines:
x Two in manufacturing, two in services
x All sectors to be predominantly private sector-oriented
x Different levels of labour productivity and foreign trade exposure
x Different levels of skill requirement, for example, not all predominantly low skilled, not all graduate-intensive, and including at least one sector where intermediate skills requiring long duration training are important.
x Different levels of reported internal skill gaps (defined as the proportion of employees which managers report as ‘lacking full proficiency in their current jobs’)
x Different levels of training provision
x Different reported barriers to employer-provided training
x Different levels of relations with local colleges and other local training providers
NESS data on training provision, barriers to training and relations with colleges and training providers analysed by sector are shown in Figures 1-2 and Table 1 above. Sectoral differences in the incidence of internal skill gaps are shown in Table 3.
Taking the various criteria into account, it was decided to focus on the following sectors:
1. Manufacture of textiles, clothing and footwear
2. Mechanical engineering, vehicles and other engineering 3. Maintenance and repair of motor vehicles
4. Telecommunications services
Once the sector selection had been made, Sector Skills Councils (SSCs) representing these four sectors joined the project steering group to add their sectoral expertise. The SSCs were, respectively, Skillfast-UK; SEMTA; Automotive Skills and e-skills UK.
Table 2: Rankings of selected sectors on key criteria Key:
H = High, MH = Medium/High, M = Medium, ML = Medium/Low, L = Low
Skill gaps as % of
employment (Table 3)
Training provision (Figures 1-2)
Local courses barrier to staff developme nt (Table 1)
Contacted by colleges and /or training providers re views on courses (Table 1)
Use FE colleges for staff training and develop-ment
(Figures 1-2)
Textiles, clothing and footwear
L L ML M L
Mechanical engineering, vehicles and other engineering
M M M H H
Maintenance and repair of motor vehicles
MH ML H M M
Telecommunications services
H H M L M
2.2 Selection of regions
In choosing the regions in which to target establishments in these four sectors, we had an important practical issue to consider, namely, that the chosen sectors needed to be sufficiently concentrated in those regions to justify a focus on local provision of VET relevant to those sectors. The selected regions also needed to be fairly widely-dispersed in order to avoid basing the study on only a few parts of England. Taking local LSC areas as our geographical unit of analysis, we first identified sector / LLSC area pairings with a minimum of 300 establishments with five or more employees. We then selected the following sector/local LSC area combinations in which to conduct the survey:
1. Textiles, clothing and footwear manfacture: Leicestershire, West Yorkshire 2. Mechanical engineering, vehicles and other engineering: Black Country,
Hampshire and Isle of Wight
3. Maintenance and repair of motor vehicles: Devon and Cornwall, Greater Manchester
Table 3: Internal skill gaps analysed by sector Establishments with 5 or more employees
Column 1 establishment-weighted, Column 2 employment-weighted Ranked by skill gaps as % of employment
% employers reporting at least one skill
gap
Skill gaps as % of employment
Telecommunications services 49 20
Industrial cleaning 38 18
Labour recruitment agencies 37 17
Retailing – specialised stores 43 17
Restaurants, canteens, catering 48 16
Bars 44 16
Maintenance and repair of motor vehicles 37 16
Hotels, motels and other accommodation 47 15
Sporting activities, arenas, stadia 39 15
Supporting and auxiliary transport activities 35 15
Other computer services 33 15
Chemicals, rubber and plastics 39 14
Building installation 37 14
Food, drink and tobacco 48 14
Advertising 31 14
Retailing – non-specialised stores; other retail and repair 55 14
Real estate activities 29 13
Travel agents and tour operators 34 13
Other financial services, including insurance 36 13
Building completion 35 13
Banks and building societies 46 13
Mechanical engineering, vehicles and other engineering 40 12
Legal, accounting, auditing, tax, etc 34 12
Wholesaling 36 12
Renting of machinery and equipment, automobiles, personal and household goods
36 12
Fabricated metal products 37 11
Architect, eng, tech etc consultancy; tech testing, analysis 35 11
Electrical, electronic and instrument engineering 37 11
Building of complete constructions; civil engineering 33 11
Printing 32 10
Software consultancy and supply 29 10
Transport services 35 10
Textiles, clothing and footwear 34 10
Sales of motor vehicles 46 10
Entertainment activities 30 8
Publishing, recorded media 34 8
TOTAL (Excluding establishments with 1-4 employees) (a)
39 12
Source: NESS 2003 Note:
2.3 Telephone survey
The telephone interviews of employers in these sectors and local LSC areas were carried out by IFF Research Ltd in June-July 2004. The interviews were confined to establishments with five or more employees and lasted for an average 20 minutes each. The sampling frame used was the Experian/Yell (previously BT) Business Database which is establishment-based. It was regarded as essential for the interviews to be establishment-based rather than company-based as it is at establishment level that decisions on skill requirements and methods used to upgrade skills are usually taken. The respondents in medium-sized and large establishments were typically senior managers responsible for human resources and training. In small establishments most respondents were general managers or their equivalent.
In terms of size-distributions of sampled establishments, efforts were made to ensure a good mix within each sector of small, medium-sized and large establishments. However, the number of large establishments taking part was restricted by the low absolute numbers of candidate large establishments in the target local LSC areas. Indeed, in vehicle maintenance and repair, there were hardly any 100-plus establishments available to be surveyed.
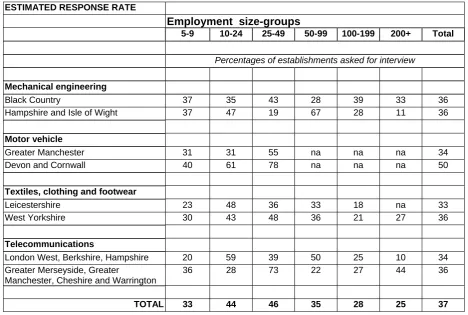
Table 4: Estimated survey response rates, analysed by sector, LSC region and size group
ESTIMATED RESPONSE RATE
Employment size-groups
5-9 10-24 25-49 50-99 100-199 200+ Total
Percentages of establishments asked for interview
Mechanical engineering
Black Country 37 35 43 28 39 33 36
Hampshire and Isle of Wight 37 47 19 67 28 11 36
Motor vehicle
Greater Manchester 31 31 55 na na na 34
Devon and Cornwall 40 61 78 na na na 50
Textiles, clothing and footwear
Leicestershire 23 48 36 33 18 na 33
West Yorkshire 30 43 48 36 21 27 36
Telecommunications
London West, Berkshire, Hampshire 20 59 39 50 25 10 34
Greater Merseyside, Greater
Manchester, Cheshire and Warrington
36 28 73 22 27 44 36
TOTAL 33 44 46 35 28 25 37
Note:
2.4 FE college and training provider case studies
Following analysis of the telephone survey findings, case study interviews were carried out in a total of 16 FE college departments and 16 commercial training providers which were evenly spread between the eight local LSC areas defined above. In selecting cases we aimed for colleges or other training providers that might reasonably be expected to provide training relevant to each of the four sectors of interest. In some cases these were colleges or training providers that were mentioned by respondents to the telephone survey. In other cases they were recommended by the relevant Sector Skills Councils as being suitable for inclusion.
[image:21.595.88.446.430.639.2]In each case we sought to interview senior managers with an overview of training provision relevant to the sectors concerned, for example, vehicle maintenance or textiles and clothing. In colleges the interviewees were typically Heads of Department and/or course leaders. In commercial training providers most respondents were general managers or chief executives. The interviews were semi-structured and face-to-face in nature and lasted up to two hours each. Table 5 shows the distribution of case study college departments and training providers by number of students and trainees respectively. Further descriptive information about these organisations is presented in Sections 4-7 below.
Table 5: Case study college departments and training providers, analysed by sector and number of students / trainees in sector – related courses
Vehicle maintenance
and repair
Telecommun-ications services
Mechanical engineering
Textiles, clothing and footwear
FE colleges: number of students on industry-related courses
Under 100 1 3 0 1
100-299 0 1 2 3
300-plus 2 0 2 0
No figures available
1 0 0 0
Total 4 4 4 4
Training providers: annual number of trainees on industry-related courses
Under 100 2 0 1 1
100-299 2 0 3 1
300-plus 0 3 0 1
No figures available
0 1 0 1
3. Overview of telephone survey findings
3.1 Sample characteristics
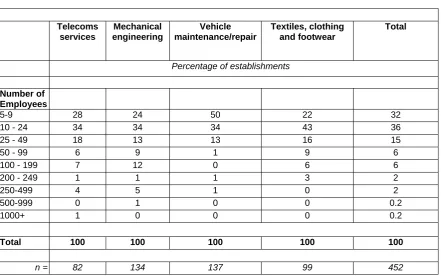
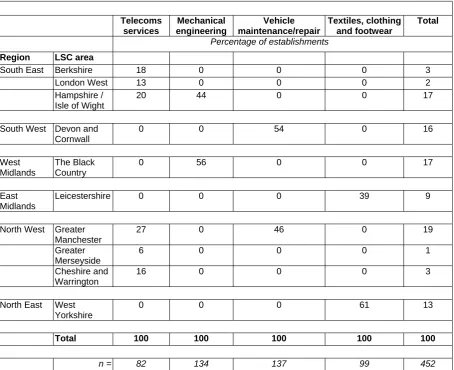
Size and regional distributions of the 452 sample establishments are shown in Tables
6-7. By design, establishments in three sectors are fairly evenly split between two
different LSC areas. The exception is telecoms services where the survey interviewers
had to diversify into neighbouring LSC areas in order to meet their interview targets.
Some additional caution needs to be attached to estimates for both telecoms and
textiles in the results below since the sample sizes in each sector / local LSC pairing
[image:22.595.90.532.317.593.2]are somewhat smaller than in the other two sectors.
Table 6: Sample establishments, analysed by sector and size group
Telecoms services
Mechanical engineering
Vehicle maintenance/repair
Textiles, clothing and footwear
Total
Percentage of establishments
Number of Employees
5-9 28 24 50 22 32
10 - 24 34 34 34 43 36
25 - 49 18 13 13 16 15
50 - 99 6 9 1 9 6
100 - 199 7 12 0 6 6
200 - 249 1 1 1 3 2
250-499 4 5 1 0 2
500-999 0 1 0 0 0.2
1000+ 1 0 0 0 0.2
Total 100 100 100 100 100
Table 7: Sample establishments, analysed by sector and local LSC area
Telecoms services
Mechanical engineering
Vehicle maintenance/repair
Textiles, clothing and footwear
Total
Percentage of establishments
Region LSC area
South East Berkshire 18 0 0 0 3
London West 13 0 0 0 2
Hampshire / Isle of Wight
20 44 0 0 17
South West Devon and Cornwall
0 0 54 0 16
West Midlands
The Black Country
0 56 0 0 17
East Midlands
Leicestershire 0 0 0 39 9
North West Greater Manchester
27 0 46 0 19
Greater Merseyside
6 0 0 0 1
Cheshire and
Warrington
16 0 0 0 3
North East West Yorkshire
0 0 0 61 13
Total 100 100 100 100 100
n = 82 134 137 99 452
63% of establishments were single-site enterprises while the remainder were part of
multi-site organisations (Table 8). The proportion in the multi-site category ranges
from 25% in textiles, clothing and footwear to 48% in telecoms. About 13% of all
establishments were head offices. The highest proportion of foreign ownership is in
telecoms (27% partly or jointly foreign-owned) and the lowest in vehicle maintenance
(8%). These and other sectoral differences considered in this section reflect the
Table 8: Sample establishments: whether single- or multi-site, head office or foreign-owned
Telecoms services
Mechanical engineering
Vehicle maintenance /
repair
Textiles, clothing and
footwear
Total
Percentage of establishments
Single-site enterprise 52 63 61 75 63
Part of multi-site enterprise
48 37 39 25 37
Head office 16 19 9 11 13
Partly or wholly foreign owned
27 20 8 9 15
n = 82 134 137 99 452
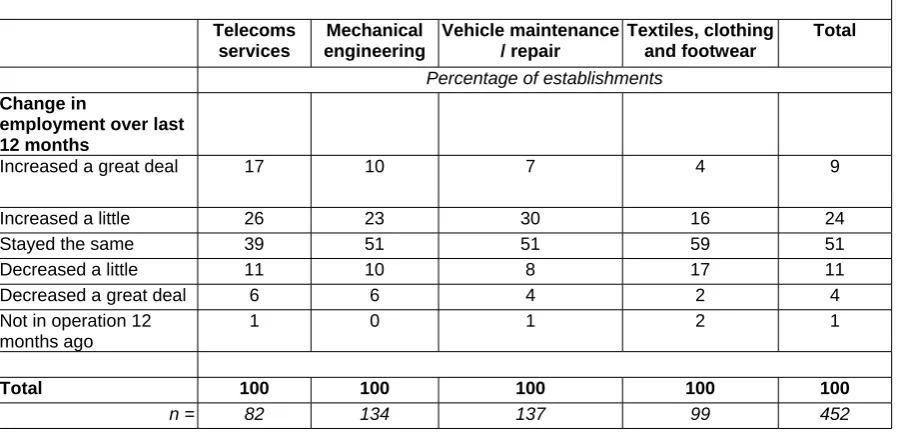
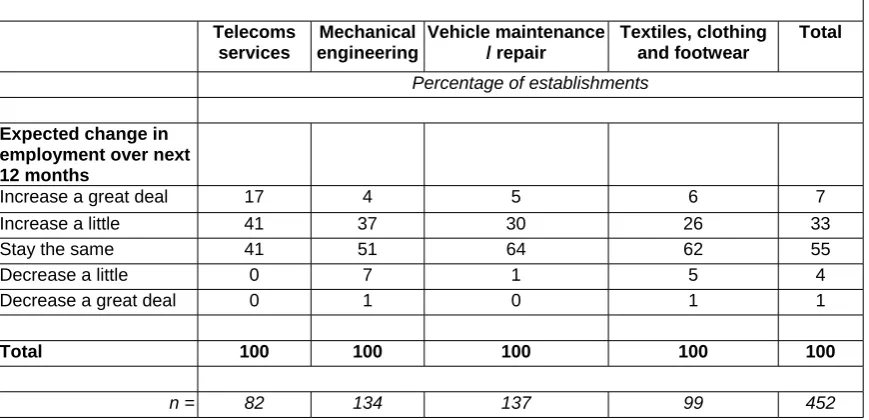
Telecoms services also stand out for having enjoyed the fastest growth in employment
in the previous 12 months and expecting the fastest employment growth in the next 12
months (Tables 9A-B). By far the most common cause of employment growth was
‘increase in turnover’ (results not tabulated). Only 5% of all sample establishments
expected employment to decrease in the next 12 months.
Table 9a: Change in employment over last 12 months, analysed by sector
Telecoms services
Mechanical engineering
Vehicle maintenance / repair
Textiles, clothing and footwear
Total
Percentage of establishments
Change in
employment over last 12 months
Increased a great deal 17 10 7 4 9
Increased a little 26 23 30 16 24
Stayed the same 39 51 51 59 51
Decreased a little 11 10 8 17 11
Decreased a great deal 6 6 4 2 4
Not in operation 12 months ago
1 0 1 2 1
Total 100 100 100 100 100
Table 9b: Expected change in employment over next 12 months, analysed by sector
Telecoms services
Mechanical engineering
Vehicle maintenance / repair
Textiles, clothing and footwear
Total
Percentage of establishments
Expected change in employment over next 12 months
Increase a great deal 17 4 5 6 7
Increase a little 41 37 30 26 33
Stay the same 41 51 64 62 55
Decrease a little 0 7 1 5 4
Decrease a great deal 0 1 0 1 1
Total 100 100 100 100 100
n = 82 134 137 99 452
A survey question asking respondents about the geographical scope of the main
market they competed in elicited the following breakdown: local 27%, regional 13%,
national 39% and international 21% (Table 10). This is perhaps surprising given the
preponderance of relatively small establishments. However, in telecoms, mechanical
engineering and textiles there are clearly large majorities of establishments which are
operating in national or international markets (presumably in part because there is little
scope for survival in these sectors in catering to regional or local markets). The
[image:25.595.90.525.116.326.2]predictable exception is vehicle maintenance and repair.
Table 10: Geographical market focus, analysed by sector
Telecoms services
Mechanical engineering
Vehicle maintenance / repair
Textiles, clothing and footwear
Total
Percentage of establishments
Primary market
Local 10 9 66 13 27
Regional 10 13 18 9 13
National 51 45 14 57 39
International 29 34 2 21 21
Total 100 100 100 100 100
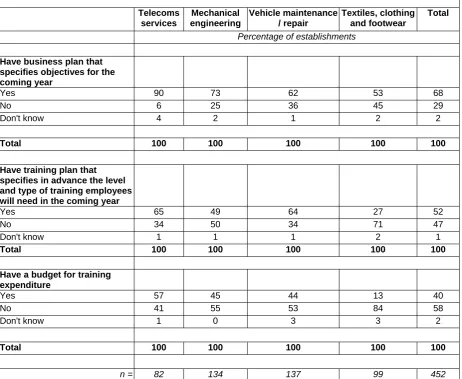
The incidence of formal training plans and budgets was markedly lower in textiles
than in the other three sectors (Table 11). Just under two thirds of telecoms and vehicle
maintenance establishments, and just under half in mechanical engineering, reported
having training plans that specified in advance what level and type of training
employees would need in the coming year. The equivalent proportion in textiles was
[image:26.595.90.553.264.643.2]only 27%.
Table 11: Incidence of business plans and training plans and budgets, analysed by sector
Telecoms services
Mechanical engineering
Vehicle maintenance / repair
Textiles, clothing and footwear
Total
Percentage of establishments
Have business plan that specifies objectives for the coming year
Yes 90 73 62 53 68
No 6 25 36 45 29
Don't know 4 2 1 2 2
Total 100 100 100 100 100
Have training plan that specifies in advance the level and type of training employees will need in the coming year
Yes 65 49 64 27 52
No 34 50 34 71 47
Don't know 1 1 1 2 1
Total 100 100 100 100 100
Have a budget for training expenditure
Yes 57 45 44 13 40
No 41 55 53 84 58
Don't know 1 0 3 3 2
Total 100 100 100 100 100
n = 82 134 137 99 452
In terms of workforce qualifications, telecoms services is (as expected) much more
graduate-intensive than the other three sectors while mechanical engineering and
vehicle maintenance and repair are relatively more intensive in intermediate skills
(NVQ3/4, below graduate). However, intermediate skills are clearly important in
Table 12: Percent o
f workfo
rce ho
lding degree-lev
el or intermediate qualifica
tio
ns, analysed by sector
Telecoms ser v ic es Mechanical e ngineering
Vehicle maintenance /
repair
Textiles, clothing and
fo o tw ear Total Graduates NVQ3/4, b e lo w grad uate Graduates NVQ3/4, b e lo w grad uate Graduates NVQ3/4, b e lo w grad uate Graduates NVQ3/4, bel ow grad uate Graduates NVQ3/4, bel ow grad uate Percentage of establ ishments Proportion of w o rkforce 0% 43 18 69
27 91 27 74
54 72 31 1 - 9% 10 16 18 22 7 28 15 18 12 22 10 - 19%
6 9 3 7 1 1 5 9 4 6
20
-
29%
5 6 2 6 1 1 4 6 3 5
30
-
39%
5 2 1 6 0 4 0 2 1 4
40
-
49%
2 6 1 3 0 1 0 0 1 2
50
-
59%
6
11
2 8 0 6 1 2 2 7
60
-
69%
2 6 1 4 0 3 0 0 1 3
70
-
79%
4 6 1 4 0 4 0 0 1 4
80
-
89%
2 7 1 4 0 9 0 1 1 6
90
-
99%
6 5 0 4 0 6 0 2 1 4
100
%
1 2 1 3 0 9 0 2
0.4
5
Don't
kno
w
7 5 0 2 0 1 1 4 2 3
T
o
tal
100 100 100 100 100 100 100 100 100 100
n
=
82
82
134 134 137 137
99
99
3.2 Identification of core groups of employees
In order to be able to probe in detail about establishments’ skill upgrading requirements and the degree of involvement they had with local FE colleges or other training providers, survey respondents were asked to identify ‘core groups’ of employees defined as the group ‘with the skills and knowledge which make the greatest contribution to the success of business’ (excluding managerial staff). A number of survey questions were then asked solely in terms of the designated core group. However, in the case of establishments with 5-9 employees (32% of the sample), no attempt was made to define a core group and the relevant survey questions applied to their entire workforce. 2
In more than three quarters of establishments with 10 or more employees, the core groups of employees also constituted the largest groups of employees. In telecoms the identified core groups were spread among a number of different occupational areas, with the top four being skilled metal and electrical trades, sales, business and public service associate professionals and science and technology professionals (Table 13). By contrast, in the other three sectors the core groups were much more concentrated, for example, among skilled metal and electrical trades and process, plant and machinery operators in mechanical engineering; skilled metal and electrical trades in vehicle maintenance and repair; and process, plant and machinery operators in textiles. Across the whole sample the single most common levels of formal qualifications held by core groups were NVQ3 and ‘no formal qualifications’ but with much more diversity of core group qualifications in telecoms and mechanical engineering than in the other two sectors (Table 14). Indeed, in textiles the qualifications held by core group employees were heavily concentrated towards the lower end of the spectrum.
3.3 External recruitment difficulties
Some 56% of establishments with ten or more employees had recruited at least one person to their core groups from the external labour market in the previous 12 months (Table 15). This proportion ranged from 73% in telecoms down to 39% in textiles. Over half of recruiting establishments reported that their recruits arrived with all or most of the skills they needed. However, some 28% of recruiting establishments said some of the skills were missing and a further 14% said all or most were missing. In textiles as many as 34% of recruiting establishments said all or most of the required skills were missing compared with only 4% in telecoms.
2
Table 13: Core groups of employees analysed by sector and tw
o-digit SOC code
Telecoms ser
v
ic
e
s
Mechanical engine
e ring Vehicle maintenance / repair Textiles, clothing an d fo ot w e ar Total
Percentage of establishments
11 Corp o rate man agers 9 6 0 5 5 21 Scienc e an d techno log y profe ssion als 10 4 2 0 4 24 Busin e ss an d pub lic servic e professi ona ls 5 0 0 0 1 31 Scienc e an d techno log y asso ciate profess io nals 2 4 2 1 2 34 Cultur e, media and sp
orts associate pr
ofessi ona ls 0 0 0 4 1 35 Busin e ss an d pub lic servic e associ ate profe ssion als 12 5 5 1 5 41 Administr ative occup a tio n s 9 2 2 3 3 42 Secretari al an d related occ u p a tions 0 1 0 0 0 52 Skille
d metal a
nd el ectrical tra des 24 38 75 3 35 53 Skille d constru c tion an d bu ild ing trades 0 6 0 3 3 54 T e xtiles, printi n
g and ot
her skil led trad es 0 0 0 8 2 71 Sales occ u p a ti ons 17 4 6 4 7 72 Customer serv ic e occup a tio n s 5 0 0 1 1 81 Process, pla
nt and mac
h in e o perativ es 0 28 3 54 24 82 T
ransport and mobil
e mach
in
e drivers a
nd o perativ es 0 1 6 1 2 91 Eleme n tar y tra des, pla nt and storage re late d occupati ons 2 1 0 11 3 Unclass ifie d 5 0 0 0 1 Total 100 100 100 100 100 n = 58 100 65 74 297
Note: Excludes establishm
ents where core
groups
are taken
to refer to a
ll em
ployees or to all
m
Table 14: Single most common level of formal qualification of core groups, analysed by sector
Telecoms services
Mechanical engineering
Vehicle maintenance / repair
Textiles, clothing and footwear
Total
Percentage of establishments
First degree and above
23 2 0 4 6
Other NVQ4 7 13 5 4 8
NVQ3 33 29 55 16 35
NVQ2 15 19 23 12 18
NVQ1 5 4 3 12 6
No formal qualification
17 33 14 52 28
Total 100 100 100 100 100
n = 82 134 137 99 452
Table 15: Incidence of external recruitment to core groups in last 12 months and indicators of the extent to which new recruits come readily equipped with skills that establishments need (establishments with ten or more employees), analysed by sector
Telecoms services
Mechanical engineering
Vehicle maintenance /
repair
Textiles, clothing and
footwear
Total
Percentage of establishments
Percent which have recruited into core group from outside establishment in last 12 months
73 57 57 39 56
n = 59 102 68 77 306
Fully equipped 14 17 23 20 18
Have most of the skills but there's some need for development
51 34 38 17 36
Have some of the skills but need development
30 31 21 30 28
Have few of the skills and need significant development
2 7 13 17 9
Have none of the skills
2 5 0 17 5
Don't know 0 5 5 0 3
Extent to which these recruits come
readily equipped with
skills that the establishment
needs
Total 100 100 100 100 100
[image:30.595.88.531.425.738.2]Another question on recruitment difficulties was asked of all sizes of recruiting establishments. Some 52% of them said it had been ‘Quite difficult’ or ‘Very difficult’ to meet recruitment targets for their core groups. By this measure all sectors were quite strongly affected, with vehicle maintenance and repair reporting the highest level of difficulties (Table 16). Taking these findings together with those in Table 15, one inference is that textiles establishments are more likely than those in other sectors to take on under-skilled recruits while in telecoms recruiting organisations are more able (or willing) to persevere with the recruitment process until people with the required skills can be found.
The main reasons cited for recruitment difficulties appear to be weak technical knowledge and understanding, lack of suitable qualifications and lack of practical work experience amongst job applicants. In all sectors but telecoms sizeable minorities of respondents also mentioned limited numbers of job applicants of any kind while in mechanical engineering as many as 90% of establishments facing difficulties referred to an ‘unattractive career image’ associated with the sector.
3.4 Preliminary assessment of skill upgrading requirements
As many as 77% of all establishments reported that the skills required for core group jobs had changed in the last 2-3 years (Table 17A). The proportion reporting no change in skill needs ranged from 12% in vehicle maintenance and 13% in telecoms up to 40% in textiles.
The main reasons for changing skill needs were the introduction of new technologies, the development of new products and services (especially in telecoms and vehicle maintenance), the introduction of new work practices and new legislative or regulatory requirements (both especially in vehicle maintenance). These perceptions of changing skill needs, and the reasons for them, were just as likely to be reported by slow-growing establishments as by fast-growing establishments. 3
An even larger proportion of establishments (83% of the total) expected the skills required for core jobs to change in the next 12 months, with the proportion so reporting as high as 94% in telecoms and ranging down to 67% in textiles (Table 17B). The reasons cited were similar to those given for past changes in skill needs.
Predictably there was a high correlation between establishments reporting past changes in skill needs and those expecting future skill changes (r = 0.471; p = 0.000). But some indication of a quickening pace of change is given by the fact that just over 40% of establishments which reported no change in skill needs in the previous 2-3 yearsdid expect skill needs to change in the next 12 months.
3
Table 16: Ease of meeting external recruitment targets for core groups in last 12 months by sector and main reasons for any recruitment difficulties (all establishments), an
alysed by sector
Telecoms ser
v
ice
s
Mechanical en
g in eeri n g Vehicle maintenance / repair Textiles, c lothin g a n d foot w e a r Total Percentage of establ ishm ents Ver y eas y 18 13 9 19 14 Quite eas y 45 35 20 35 32 Quite difficult 25 23 32 28 27 Very difficult 11 28 36 19 25 Don't kno w 0 1 3 0 2 Refused 2 0 0 0 0 Ease of mee ting recruit ment targ ets in last 12 mo nth s Total 100 100 100 100 100 n = 56 69 87 43 255 Not enough applications 5 43 32 25 30
Weak technical kno
w
ledge and u
n derstanding amo ngst applicant 35 23 25 20 25
Weak communication and pres
en tation skills 5 3 5 0 4
Lack of suitable qualifications
20
23
29
10
23
Lack of commercial understanding
and a w a reness 0 0 2 0 1
Lack of practical
w o rk experience amongst applicants 10 20 20 20 19
Lack of w
o
rk exp
e
rience of an
y kind amongst applicants
10
6
5
5
6
Not able to pa
y s u itable salar y 5 0 14 10 8
Location of compan
y
una
ttractive to job-seekers
15
0
2
5
4
Did not advertise w
idel y enough 0 0 2 0 1
Not an att
ractive career 10 90 3 20 8
Lack of soft skills i.e. motivation and common sense
Table 17A: Whether skill needs for core group of employees have changed in last two-three years and if so, for what reason
Telecoms services
Mechanical engineering
Vehicle maintenance / repair
Textiles, clothing and footwear
Total
Percentage of establishments
Whether skill needs have changed in last 2-3 years
Skills needs not changed 13 26 12 40 23
Skill needs have changed
87 74 88 60 77
Total 100 100 100 100 100
Reasons for changes in skills needed
The development of new products and services
65 40 63 27 49
The introduction of new working practices
43 35 51 19 38
The introduction of new technologies or equipment
71 56 77 31 60
New legislative or regulatory requirements
34 35 55 22 38
Skill needs have changed but for none of these reasons.
5 7 1 10 5
n = 82 134 137 99 452
Table 17B: Whether skills needed of core group are expected to change over next 12 months, and if so, for what reason
Telecoms services
Mechanical engineering
Vehicle maintenance / repair
Textiles, clothing and footwear
Total
Percentage of establishments
Whether skill needs are expected to change in next 12 months
Will not need new skills 6 19 11 33 17
Skill needs expected to change
94 81 89 67 83
Total 100 100 100 100 100
Whether need new skills/ reasons for skills changes
The development of new products and services
74 45 65 25 52
The introduction of new working practices
52 37 51 22 41
The introduction of new technologies or equipment
67 46 73 26 54
New legislative or regulatory requirements
40 40 53 21 40
Other 1 0 1 0 1
Don't know 6 15 3 21 11
[image:33.595.90.539.476.766.2]Table 18: Types of skills that are expected to need improving among core groups of employees over the next 12 months
Telecoms services
Mechanical engineering
Vehicle maintenance / repair
Textiles, clothing and footwear
Total
Percentage of establishments
Types of skills that need improving
General IT or computing user skills
51 37 41 17 37
IT or computing professional skills
23 9 12 3 11
Communication skills 52 32 39 27 37
Customer handling skills 55 25 45 15 35
Team working skills 50 39 44 34 41
Foreign language skills 5 4 3 2 4
Problem solving skills 39 39 47 18 37
Leadership or supervisory skills
48 36 36 26 36
Numeracy skills 20 15 17 13 16
Literacy skills 13 13 20 9 14
Technical or practical skills
57 57 70 32 56
Other skills 1 1 0 1 1
None 7 18 10 33 17
n = 82 134 137 99 452
The main types of skills that are expected to need improving over the next 12 months were reported as technical/practical skills (56% of all establishments), team-working, problem-solving, communication and other types of generic skill (35-41%) and general IT/computing skills (37%) (Table 18). Technical and generic skills are often required in combination by employers.
In Sections 4-7 below we present more detailed analysis of the types of skills that need improving for specific occupations in each sector in order to get ‘beneath’ the familiar but rather broad categories of skill shown in Table 18.
3.5 Training provision
In total as many as 98% of telecoms establishments answered either ‘Very likely’ or ‘Quite likely’ in response to at least one training option, followed by 93% in vehicle maintenance, 82% in mechanical engineering and 73% in textiles (Table 19, Row 11). If we focus solely onoff-the-job training or education options, these proportions drop to 94%, 93%, 78% and 60% respectively (Row 12).
These indicators of future training activity seem high. If we distinguish between those responding ‘Very likely’ and those responding ‘Quite likely’, then a different picture emerges. Overall, around two thirds of establishments said that it was ‘Very likely’ they would pursue at least one training option (Row 13) and just over half said it was ‘Very likely’ they would pursue at least one off-the-job training or education option (Row 14). As many as 73% of textiles establishments and 57% of mechanical engineering establishments did not say that they were ‘Very likely’ to arrange off-the-job training for their core groups of employees. By contrast, only 27% of telecoms establishments and 34% of vehicle maintenance establishments fell into this category.
Table 19: Likelihood of organising different types of training for core group in next 12 month
s
Telecoms ser
v
ic
e
s
Mechanical engine
e ring Vehicle maintenance / repair Textiles, clothin g and foot w e a r Total Percentage of establ ishments saying ‘V ery li kely ’ or ‘Q u ite li kely
’ that eac
h type of traini ng w ill be provi d
ed for co
re grou
p in the
next 12
mont
h
s
1. On the job traini
ng i n the w o rk situation 80 72 81 59 73
2. On site traini
ng carri
ed o
u
t off the job prov
ide d b y estab lis hment 63 39 62 34 49
3. On site traini
ng carri
ed out off the job prov
ided by
an equi
pment
producer or suppli
er
56 42 61
18
45
4. On site traini
ng carri
ed out off the job prov
ided by
any other kind
of exter
nal trai
ning suppli
er
41 32 42
18
34
5. Off site traini
ng prov ide d b y y o ur o w n or ga nisati on 50 26 44 16 34
6. Off site traini
ng prov
ided by an equ
ipm
ent producer or suppli
er 47 35 40 16 35
7. Off site traini
ng prov
ided by any
other kind of external trai
ning
supp
lier
34 25 36
16
28
8. Paid attendance at confer
ence
s,
w
o
rkshops or seminars
w h ere primar y p u rpos
e is traini
ng or
educ
atio
n
56 31 43
17
36
9. Paid time off for employ
e
es
to attend ex
ter nal courses 57 42 58 16 44
10. Fees pai
d for empl
o y ees t o stud y or train
in their o
w n ti me 41 33 28 18 30 Percenta ge of establ ish m e n ts respon din g as indic ated i n Colu mn 1
11. Have n
o t a n s w er ed ‘Ver y likel y’ or ‘Quite likel y’ to an y traini ng/ed ucati on opti on 2 18 7 27 14
12. Have not ans
w er ed ‘Very likely ’ to an y tr aini ng/e duc atio n optio n
13 40 24
48
32
13. Have n
o t a n s w er ed ‘Ver y likel y’ or ‘Quite likel y’ to an y off -the-jo b traini ng/ed ucati on opti on 6 22 7 40 18
14. Have not ans
w er ed ‘Very likely ’ to any of f -the-job traini ng/ed ucati on opti on
27 57 34
3.6 Use of external training suppliers
Some 34% of establishments said that it was either ‘Very likely’ or ‘Quite likely’ that they would make use of on-site training provided by external training suppliers other than equipment producers (Table 19). The equivalent proportion expecting to make use of off-site training provided by such suppliers was 28%. This latter figure ranged from 36% in vehicle maintenance, 34% in telecoms and 25% in mechanical engineering down to 16% in textiles.
[image:37.595.89.489.332.663.2]Detailed analysis of prospective use of external training suppliers shows that some 12% of all establishments thought it ‘Very likely’ that they would use FE college services in the next 12 months while another 20% thought it ‘Quite likely’ (Table 20). In the case of commercial training providers these proportions were 9% and 16% respectively.
Table 20: Likelihood of using different types of external training provider for core group in next 12 months
Telecoms services
Mechanical engineering
Vehicle maintenance
Textiles, clothing and footwear
TOTAL
Percentage of establishments
Equipment suppliers – onsite training
Very likely 29 15 21 4 17
Quite likely 20 25 35 12 24
Not likely 51 61 44 84 59
Equipment suppliers – offsite training
Very likely 20 7 15 2 11
Quite likely 22 25 22 12 21
Not likely 59 67 63 86 68
Commercial training providers
Very likely 10 10 12 4 9
Quite likely 26 19 14 5 16
Not likely 65 71 74 91 75
Non-profit training providers
Very likely 5 3 2 2 3
Quite likely 13 20 12 9 14
Not likely 82 77 86 89 83
FE colleges
Very likely 12 7 24 3 12
Quite likely 18 27 25 6 20
Not likely 70 66 51 91 67
Universities or other Higher Education institutions
Very likely 9 1 1 2 3
Quite likely 7 7 1 3 4
Not likely 84 92 98 95 93
n = 82 134 137 99 452
Notes:
(a) Refers to ‘All employees’ in the case of establishments with less than ten employees