NetML: Networking Networks
Ronald G. Addie
Department of Mathematics and Computing, University of Southern Queensland, Australia
Email: [email protected]
Yu Peng, Moshe Zukerman Electronic Engineering Department, City University of Hong Kong, Hong Kong SAR Email: [email protected], [email protected]
Abstract—NetML is a system which runs in a browser – with help from “the cloud” which can be used to analyse and design networks. Versions of NetML have existed for 10 years however the version now available is the first to include full graphical editing as well as a rich collection of network design and analysis tools.
NetML provides a way to navigate through views of one net-work, and through a network of networks. The software itself is networked and provides the means for network researchers to jointly develop networks and algorithms for research and educational purposes.
The tools provided in NetML include layered and single-layer network design, robust network design, availability anal-ysis, and loss analysis. Networks can also be transformed by means of XSLT scripts.
I. INTRODUCTION
NetML is a system for network analysis and design which runs in a browser with all heavy calculations in the cloud (an Internet server or a network of servers).
A. Key ideas
• Traffic-oriented design of networks (not link-oriented); • appropriate navigation and visualisation tools;
• internet sharing of networks and algorithms;
• computing ”in-the-cloud” with user access via a browser;
• support for layered networks;
• use of xml as the network description language.
B. Examples
The reader can explore the NetML system online in a matter of moments [1]. In particular, there are three examples provided in the network repository of the NetML system which are also described here. The reader can follow the steps outlined here by themselves, using a web browser, with the same network examples. The examples are: (a) an Australian network for universities and research
institutes, loosely based on AARNET [2];
(b) an American national carrier network (from a few years ago);
(c) the National Science Foundation network of the U. S. from several years ago [3].
In all these cases the NetML system has used to create a layered, robust design using switched ethernet, IP, WDM
and optical fibers, including a backup path for every traffic flow included in the design for every single link failure. These designs are equipped with costs and specifications of all the equipment required to construct the networks could be derived from the NetML specifications of the designed network.
C. Traffic-oriented Design
The designs for the above networks will all be on the basis of specified traffic. It has become common for networks to be designed by measuring traffic onlinks and deducing the required capacity on these links by estimating future traffic levels from these link measurements. The advantages of traffic-oriented design will be discussed below in Subsection II-B and further considered in Subsection VI-A.
II. THEGOALS OF THENETML SYSTEM
The NetML system is intended for both teaching and research. It is a graphical editor, analysis, design, and visualisation tool for networks
Many of the calculations which need to be carried out routinely in order to understand a network are too complex to be undertaken manually. An important example of such an algorithm is calculation of shortest paths, which the NetML server is able to do for all origin-destination pairs in a large network very quickly, by means of Floyd’s algorithm [4].
If a tool is available to do these calculations and present them to the user in a convenient form, the user (someone involved in managing, designing or undertaking research into networks) will be able to incorporate these algorithms in their practice. In effect, the NetML system will provide an extension to the network-related thinking powers of the user.
A. Other Products
1) Vector graphics tools: At first site the NetML system looks like a graphical editor for graphs, or perhaps vector graphics. There are many such tools, e.g. Visio [5], dia
[6], andinkscape[7]. The objectives of the NetML system are quite different from these tools.
which can be analysed by means of the important network analysis and design algorithms. These algorithms estimate the routing which is likely to occur, estimate the statistics of the traffic which will flow in each link, including how much traffic will be lost. The algorithms also include one to estimate the unavailability of end-to-end performance across a network and a layered routing and analysis tool which can be used to determine the location and capabilities for add-drop multiplexing.
Secondly, theappearanceof a network, and in particular of the elements in a network, in the NetML system, is diverted from its usual aesthetic role and instead employed as a vehicle for communicating complex information about the network which is difficult for users to comprehend by other means. There are many aspects of the operation of a network which are difficult to understand, and many of these can be readily conveyed graphically.
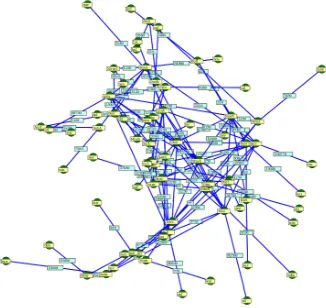
For example, NetML allows the path followed by a specific traffic flow, or the traffic flows carried by a specific link, to be displayed. In Figure 1 the selected links are the ones followed by the traffic stream at the top of the diagram; in the same figure, the collection of traffic flows carried by the link from WA to CO_UT) are the only ones currently visible. In both cases, the construct which is being displayed amounts to aset, and hence can be quite difficult to visualise. The support of a visual tool for displaying these constructs is therefore extremely effective as a way to improve visualisation.
Another important difference between NetML and a conventional graphical editor is that even in the case of modest networks, most of the information in the network will normally be hidden. This is because even in small networks there will often be much more information than can realistically be displayed at once. However, by allowing the user to easily choose what information they wish to show, this problem can be bypassed. The full depth and breadth of internal information and details of the network can be graphically presented and visualised, not in a single view, but instead in a succession of views, as selected by the user. 2) Similar Network design and analysis tools: There are many other graphic network design and analysis tools avail-able, although most of these are confined tosimulation. Most of these tools are commercial products, like OPNET [8] and NPAT [9]; while a small number of them are open sourced, such as Nam [10], [11] (the network visualization tool of NS2) and OMNeT++ [12]. Each of these tools depends on a specific platform and has its own network format, which introduces many difficulties when people using different tools collaborate together. Moreover, a single tool does not usually have all the required features on large network design and analysis task, programing among different tools costs lots of time and human resource. The use of an xml based language for network description potentially addresses this issue of inter-transfer of network specifications. Documents
encoded in xml can be readily translated into other formats by means ofxslttemplates.
Another difference between the NetML system and other existing products is deployment via a web site. It becomes possible for researchers to exchange network data, which is visually effective at the same time as being very precise, via a URL.
B. Traffic-oriented Network Design
Current network design practise is predominantly link-oriented in the sense that network administrators predom-inantly monitorlinktraffic, and institute link upgrades when traffic levels exceed specified thresh-holds.
Traffic-oriented design is the practise of bas-ing network design choices on information about the service requests from the network clients, as summarised in the form of traffic.
The principle that the design of a network should be based on what its client’s want is well founded. Traffic is a effective abstraction for summarising client service demands upon the network. The traffic carried on linkscan be misleading because it includes reflects the existing network structure and design.
An example of the sort of errors which can arise in link-oriented design is presented in Subsection VI-A.
III. NETML SYSTEMFUNCTIONALITY
A. Research applications
Communication via networks made up of optical fibers, wireless media, and switches and routers of many varieties continues to expand as a proportion of human activity. We continue to invest more of our time and resources into digital communication and additional inroads are currently being made by thevirtual worldinto regions previously dominated by thephysical world. In particular, online shopping expands while browsing through physical shops declines.
The rate of increase of data rates generated by individual users also has not slackened, but has probably instead accelarated recently due to the widepsread deployment of 3G and 4G phones, which are more than capable of fully loading the wireless networks to which they are connnected. As a consequence, networks are making increasing use of a combination of full wavelengths, SDH channels of a variety of sizes, and dark fiber, as well as using access over shared TCP/IP networks. How to make the right choices amongst such a diverse range is extemely challenging, and clearly requires computer support
Figure 1. Showing the links used by a traffic stream and the traffic streams carried on a link
As well as presenting a difficult design problem, it is also difficult to visualise, and therefore to understand these net-works. For this reason it is important to have a visualisation tool
1) Visualisation: The primary reason why visualisation tools are necessary for networks is that the complexity of these structures is too great to be presented in a single diagram. It is therefore necessary to provide tools which allow different views to be selected, and, going beyond simply selecting views, we need to enable the user to constructandstoreviews of the network.
Figure 2. A national carrier network
There are a variety of ways to construct views: • hiding and showing elements;
• changing the shape and colour of network elements; • transforming the network (e.g. by means of an xslt
[image:3.612.352.521.325.441.2]transforming possibly followed by application of a
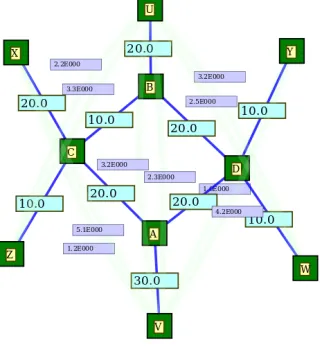
Figure 3. A national research network
network algorithm); • animation.
Typically animation is achieved by creating a series of images and then displying these images one after the other – each for only a short time. However, another useful animation technique which is a little easier to implement is to generate a series of separate images which represent the evolution of a network over time. These images do not have to correspond to moments in time which very close together.
[image:3.612.94.257.469.623.2]B. Educational applications
Thorough understanding of how networks really work is difficult to convey and it is not uncommon, at the present time, for qualified network staff to have an imperfect and ineffective understanding. As well as the inherent complexity of networking concepts, we have to face the problem that the whole field has developed only recently, and therefore the best way to explain important concepts has not yet been discovered.
Here are some examples of difficult concepts which are often poorly understood: VLAN’s, Network Address Translation (masquerading), virtual private networks, label switching. Each of these concepts, and others, are frequently dealt with by means of a model which only approximately captures the full technical details.
If these concepts, and a host of others, are presented to students as a mass of unconnected technical details, it is likely that the art of network administration will remain closer to black magic than science.
There is at present a strong movement to adopt, more and more widely, an approach to education which is tightly linked to specific companies:vendor certification. This has its own particular problems: in particular, it is hard to see how technical staff with an education which emphasises a specific range of products can be objective when considering alternatives.
1) Teaching Network Analysis and Design: At present it is difficult to convey a sound understanding of how networks operate. The diversity and complexity of currently used protocols is more than sufficient to cause conges-tion in undergraduate educaconges-tion for engineers or computer scientists. As a consequence, managers and network users have low confidence in the expertise of properly qualified networking professionals. This is one of the reasons for the high popularity of industry-certification programs, even though it is recognised that industry certification often has the disadvantage of constraining the viewpoint of IT profes-sionals to the product range of a particular organisation.
Furthermore, the greatest part of the difficulty is with understanding thebig picture. How do the differentlayersof network technology work together to provide the end-to-end functionality that users want? For this purpose a tool which allows users to see both the big picture and the details, and how the layers work together, is a valuable educational aid.
C. System Design
The complete design of the NetML system is described in a separate document [13]. The design of the software is outlined in brief here.
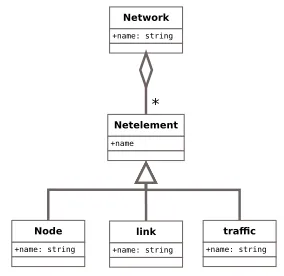
1) Networks: An object-relationship diagram for net-works is shown in Figure 4.
This class structure enables a good deal of the software in both the client and the server to be implemented very ef-ficiently. For example the software for setting and obtaining
Network
+name: string
Netelement
+name
*
Node
+name: string
link
+name: string
traffic
[image:4.612.368.510.91.229.2]+name: string
Figure 4. Object relationship diagram for a network
properties of network elements, like the colour, visibility, width, and so on, of a network element, is common for nodes, links, and traffic streams.
2) XML and XSLT: Externally, networks are stored in a form of xml which we refer to in this paper as NetML. This has many advantages. The entirexmlrepresentation of a network is also used, in both the client and the server, by making use of the standard tools which can be used for parsing an XML file into an internal data structure. This means that transferring networks from the client to the server and conversely is straightforward – the network is sent as a string, which contains the NetML representation of the network.
Another advantage of using xml is that we can make use of powerful tools such as xpath and xslt. xpath is used extensively in the client, and we usexslt extensively in the server. For example, to find, on the client, all the links with origin node called SF, the xpath expression
/nml:network/links/link[origin=’SF’]is used.
3) GWT and SVG: In order to make use of a responsive graphical user interface in a browser it is essential to make use of the AJAX approach to browser use, in which the browser’s javascript engine is used to alter the image displayed by the browser without updating the whole page. In the development of the NetML system, the Google Web Toolkit [14] is used to provide access to the browser’s javascript engine by means of a program written in Java. In effect, the Google Web Toolkit encapsulates the AJAX API. The Google Web Toolkit has proved to be very effective for this purpose. The Java code produced is efficient, and it is possible to develop powerful functionality in relatively transparent Java code, with only a moderate recourse to functions written injavascript.
highly complex graphics very efficiently in a browser. A library for accessing SVG functionality of modern browsers through the Google Web Toolkit is being developed at the moment and has sufficient functionality already to be usable for this project [15]. In addition, an xslt script which converts NetML into SVG has been developed as part of the NetML system and is used to create the basic SVG representation of a network, which is how it is displayed in the client in the NetML system.
D. Current Applications
1) Availability analysis: Given a network in which each link has been assigned an availability value, this tool calcu-lates the availability of traffic flows.
2) Routing and Loss: The core of this tool is Floyd’s algorithm, which calculates all the shortest paths through a network. In the case of layered networks this tool will carry out the shortest path analysis of all the network’s layers. Routing tables which record the routing in a form which could be used in routers are calculated, and traffic from all the traffic flows is also assigned to each link. The capacity needed on each link, to carry this traffic, is then calculated, using information about the range of module sizes which are available. Alternatively, this tool can leave the capacities of the links unchanged and calculate the amount of loss which will be experienced by traffic flows.
3) Layered network design: The most complex individual design algorithm in NetML assigns capacities to the links in multiple layers. The number of layers is arbitrary, although it would rarely exceed 4, and the most common number of layers is 2. The design algorithm uses shortest path routing in each layer, with link-cost defined as the marginal cost of using a link, as determined by the way that link is implemented, which will usually depend on other layers. As a consequence, the algorithm needs to iteratively revise the assignment of capacities to each layer until no further changes take place.
4) Robust design: This tool explores all the possible single-physical-link failure states and redesigns the network, using one of the tools described in the previous two subsec-tions. The capacities selected for the final design are the maximum of those required in each of the failure-affected designs.
5) Network Transformation, and Costing: It is easy to develop a variety of tools for transforming networks in
xslt. This is because thexslt language is very expressive for defining transformations of any document expressed in XML. At present tools for scaling networks geographically, growing traffic uniformly, and for costing networks, have been developed. There is also a tool under development which repeatedlyapplies one of these transformations, for example growing traffic by a certain percentage, and ap-plies one of the existing design tools, and then stores the entire series of networks obtained in this way, either as a
succession of independent files, or as an animation, i.e. a network in which each network element contains a collection of successive snapshots.
IV. THREEEXAMPLES
Three networks are used now to illustrate the NetML system. These are shown in Figures 1, 2, and 3. Each of these networks is based on a large real network in Australia or the United States.
The National Science Foundation network of the U.S.: See Figure 1. This network covers a wide area (thousands of kilometers) and It has 30 nodes, 62 links, and 240 traffic flows.
A national research network: See Figure 3. This network has 14 nodes, 24 links, and 34 traffic flows.
A national carrier network: See Figure 2. This is a large sparse network. It has 77 nodes and 241 links.
The design tools require only a few minutes to design the two smaller of these three networks. The largest example required approximately 15 minutes to complete the robust, layered network design. For this network, shown in Figure 2, the completed design also takes a long time to load in the client. This is due to the very large number of hidden links and traffic streams in the designed network. It appears that in order to deal with networks with more than 50 nodes effectively, it will be necessary to omit storage in the client of most information about hidden network layers, or at any rate, to avoid all but the simplest operations from being carried out on the hidden elements of a network unless absolutely essential.
A national research network: See Figure 3. This network has 14 nodes, 24 links, and 34 traffic flows.
The design tools all require only a few minutes to design these networks. The largest of these networks, shown in Figure 2, is takes a long time to load in the client. This is due to the very large number of hidden links and traffic streams in the designed network.
V. THEUSERINTERFACE A. Graphical manipulation of networks
Users need to create networks, which involves creating nodes, links, and traffic flows. Although creating networks is very important, the vast majority of activity in NetML is notcreating new networks. At present, creating new nodes is done with a left mouse-click, with thealt key held down during the click. In future the user interface functionality will be modified by the currently selected tool in acontrol panel.
B. Layering in the graphical user interface
example as defined in the OSI reference model. How should we use this concept in the context of networks?
Since the layering principle is extensively used, and very effectively in both cases, in the senses just described, in the NetML system layers are used in both senses: as network layers, in the sense of protocol layering, and in the sense of layers of detail.
The user-interface allows setting of default visual charac-teristics or all the objects in a layer. This is a very powerful feature. When an individual object is assigned specific properties these will over-ride the properties assigned to the layer, and, on the other hand, if a property is not set in the object, and not in the layer, then it will take a default value which applies to all layers. In summary, the visual properties of objects are set according to a hierachical system of settings elements.
In particular, frequently an entire layer will be either visible or hidden. It is possible to show specific objects from a layer, while the remaining objects remain hidden. When more than one layer is visible at the same time, it will usually be easy to distinguish the layers by means of colour, since the default colour for a layer will have been set.
Objects can also be assigned anopacity(the complement of transparency). Typically traffic flows will have opacity quite low, e.g 0.2.
VI. DISCUSSION A. Link-oriented vs Traffic-oriented design
[image:6.612.95.255.467.645.2]In Subsection II-B, the advantages of traffic-oriented design were described. Now we explore the possible weak-nesses of link-oriented design. Consider the network shown in Figure 5.
Figure 5. A national carrier network
If the available module sizes are few in number and relatively large, which is frequently the case in the case of transmission facilities, as the traffic in this network grows, it will become attractive to upgradesomeof the links. After
this is done, because of the larger module size allocated to somelinks, additional traffic will be attracted to these links, by the lower marginal cost of carrying traffic on these links. Initially this is sensible, since there will be a large level of free capacity on these links. However, when it comes time to upgrade the network again, because of this tendency, it is possible that the links which have already been upgraded to be upgraded again. This could be highly non-optimal. What appears to be a rational decision making process may actually be causing an increasingly distorted network design, relative to a design which starts uses complete information about the traffic flows in the network.
Another advantage of traffic-oriented design is that algo-rithms based on traffic can easily be applied for the purpose of robust design of networks, as applied in Section III-D4.
VII. CONCLUSION
The NetML system is capable of dealing with large networks and solving extremely complex problems. The high performance graphical display of outout from design algorithms enables students, and practitioners with limited experience of software, to understand quite sophisticated ideas, like layered routing. The use of XML as the data format for networks makes it much easier to manipulate the data in useful ways, and facilitates the translation of NetML files to forms which allow other tools to be used. For example it is expected that a tool which converts a NetML document into a script which can be used to run an NS2 simulation will be developed.
REFERENCES
[1] R. G. Addie. Netml 3.5, 2011.
[2] Aarnet Pty. Ltd. Australian academic and research network, 2011.
[3] Karen D. Frazer. Nsfnet: A partnership for high-speed networking, final report 1987-1995, 1995.
[4] Robert W. Floyd. Algorithm 97: Shortest path. Commun. ACM, 5:345–, June 1962.
[5] Microsoft Corporation. Microsoft visio 2003 software devel-opment kit, 2010.
[6] Alexander Larsson et al. Dia - a diagram drawing program, 1999.
[7] Tavmjong Bah.Inkscape: guide to a vector drawing program. Prentice Hall Press, Upper Saddle River, NJ, USA, first edition, 2007.
[8] Xinjie Chang. Network simulations with opnet. InSimulation Conference Proceedings, 1999 Winter, volume 1, pages 307 –314 vol.1, 1999.
[10] Paul Meenaghan and Declan Delaney. An introduction to ns, nam and otcl scripting - network simulator, 2004.
[11] Deborah Estrin, Mark Handley, John Heidemann, Steven McCanne, Ya Xu, and Haobo Yu. Network visualization with nam, the vint network animator. Computer, 33:63–68, November 2000.
[12] Andr´as Varga. The OMNeT++ Discrete Event Simulation System. Proceedings of the European Simulation Multicon-ference (ESM’2001), 2001.
[13] R. G. Addie. Netml v4.0 an online environment for access and sharing of network data and software for network analysis and design design documentation version 1.1. Technical Report SC-MC-1101, University of Southern Queensland, 2011.
[14] David Geary and Rob Gordon.Google Web Toolkit Solutions. Prentice Hall, 2007.