9 780755 977291
ISBN 978-0-7559-7729-1
E
d
u
ca
tio
n an
d Life
lo
n
g L
e
ar
nin
g
Behaviour in Scottish
Schools 2009
ISSN 0950 2254
ISBN 978 0 7559 7729 1
www.scotland.gov.uk/socialresearch
The text pages of this document are produced from 100% Elemental Chlorine-Free material.
The paper carries the Nordic Ecolabel for low emissions during production, and is 100% recyclable.
RR DonnelleyB62796 11/09
BEHAVIOUR IN SCOTTISH SCHOOLS 2009
Pamela Munn, Stephen Sharp, Gwynedd Lloyd, Gale Macleod,
Gillean McCluskey, Jane Brown and Lorna Hamilton
The University of Edinburgh
The views expressed in the report are those of the author(s) and do not necessarily reflect those of the Scottish Government or any other organisation(s) by which the
author(s) is/are employed.
The Scottish Government is making this research report available on-line in order to provide access to its contents for those interested in the subject. The Scottish Government commissioned the research but has not exercised editorial control over
the report.
This report and research findings are published by Education Analytical Services,
Scottish Government,
Victoria Quay, Edinburgh, EH6 6QQ. If you have any enquiries about these reports
Please contact the Dissemination Officer on 0131-244-0894; by e-mail on [email protected] or visit our website www.scotland.gov.uk/insight.
© Crown Copyright 2009
Limited extracts from the text may be produced provided the source is acknowledged. For more extensive reproduction, please write to,
the Chief Researcher at Office of Chief Researcher, 4th Floor West Rear, St Andrew’s House, Edinburgh EH1 3DG
TABLE OF CONTENTS
Page
Acknowledgements i
List of Tables ii
Executive Summary v
1 Introduction 1
2 Positive Behaviour in Primary Schools 7
3 Low-Level Indiscipline in Primary Schools 12
4 Serious Indiscipline/Violence in Primary Schools 18
5 Primary School Pupils’ Perspectives 31
6 Behaviour Management Policies in Primary Schools 39
7 Positive Behaviour in Secondary Schools 46
8 Low Level Indiscipline in Secondary Schools 52
9 Serious Indiscipline/Violence in Secondary Schools 58
10 Secondary School Pupils’ Perspectives 72
11 Behaviour Management Policies in Secondary Schools 81
12 Comparison of 2006 and 2009 Perceptions of Behaviour 90
13 Local Authority Policy and Approaches 102
14 Overview of Findings 112
i
ACKNOWLEDGEMENTS
This report would not have been written without the help and support of a great many people. We are very grateful to the teachers, headteachers and support staff who completed a long and quite complex questionnaire. The results from this exercise form the main part of the report. The visits to 15 primary and secondary schools allowed us to supplement the information from the surveys through interviews and focus groups with staff and pupils. We were warmly welcomed by staff and some staff in small schools gave up their lunchtimes or breaks to talk to us. We greatly appreciated the hospitality provided in all the schools and the time and trouble taken to ensure we collected all the information required. Schools have many competing demands on their time and we were grateful for the helpful way in which they and their pupils participated in the research. Our 32 local authority respondents also took time out of their busy schedule to speak to us at some length about policy and practice in their area.
Having collected and analysed a great deal of data, our Research Advisory Group provided helpful comment and advice as the report took shape.
Fiona Eldem stepped in at the last minute to help us present the report in a professional manner, when our research secretary was ill. We are grateful to her for her skill and good humour.
Pamela Munn
ii
LIST OF TABLES AND FIGURES
Page
Table 1.1 Respondent groups and return rates 3
Table 1.2 School visits – summary of interview and focus group
participants
5
Table 2.1 Primary teachers’ views of positive behaviour around the
school
8
Table 2.2 Primary headteachers’ views of positive behaviour around
the school
8
Table 2.3 Primary teachers’ views of positive behaviour in classrooms 9
Table 2.4 Primary headteachers’ views of positive behaviour in
classrooms
10
Table 2.5 Primary support staff’s views on positive behaviour in
classrooms
11
Table 3.1 Primary teachers’ views of low-level indiscipline around the
school
13
Table 3.2 Primary headteachers’ views of low-level indiscipline around
the school
14
Table 3.3 Primary teachers’ views of low level indiscipline in the
classroom 15
Table 3.4 Primary support staff’s views of low level indiscipline in the classroom
16
Table 4.1 Perceptions of the overall impact of serious indiscipline/pupil
violence on the running of primary schools
18
Table 4.2 Primary teachers’ views of serious indiscipline around the
school 20
Table 4.3 Primary headteachers’ views of serious indiscipline around
the school
22
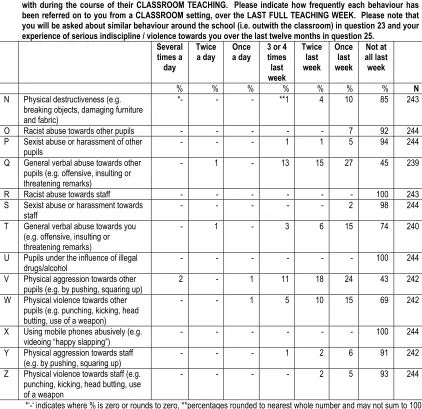
Table 4.4 Primary teachers’ views of serious indiscipline in the
classroom 23
Table 4.5 Primary headteachers’ views of serious indiscipline in the
classroom
25
Table 4.6 Primary support staff’s views of serious indiscipline in the
classroom
26
Table 4.7 Percentage of primary staff experiencing serious
indiscipline/violence at least once in the last twelve months 27
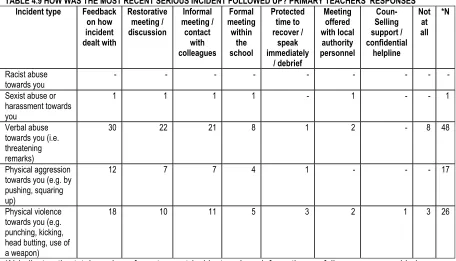
Table 4.8 Who was notified about the most recent serious incident?
Primary teachers’ responses
28
Table 4.9 How was the incident followed up? Primary teachers’
responses 28
Table 5.1 Primary pupils’ views of positive behaviour in classrooms 32
Table 5.2 Examples of positive behaviour from primary pupil focus
groups
32
Table 5.3 Primary pupils’ views of school activities to promote positive
behaviour
33
iii
Table 5.5 Primary pupils’ views of negative behaviour around the
school
35
Table 6.1 Primary teachers’/headteachers’ views on positive behaviour
strategies 40
Table 6.2 Members of the primary school community involved in
developing strategies
43
Table 6.3 Time spent on behaviour management by primary
headteachers and teachers in the last full teaching week 43
Table 6.4 Most and least frequently used behaviour management
strategies in primary schools
45
Table 7.1 Secondary teachers’ perceptions of positive behaviour
around the school
47
Table 7.2 Secondary headteachers’ perceptions of positive behaviour
around the school 47
Table 7.3 Secondary teachers’ perceptions of positive behaviour in
classrooms
49
Table 7.4 Secondary headteachers’ perceptions of positive behaviour
in classrooms 50
Table 7.5 Secondary support staff’s perceptions of positive behaviour
in classrooms
51
Table 8.1 Secondary teachers’ perceptions of low level indiscipline
around the school
53
Table 8.2 Secondary headteachers’ perceptions of low level
indiscipline around the school 54
Table 8.3 Secondary teachers’ perceptions of low level indiscipline in
classrooms
55
Table 8.4 Secondary support staff’s perceptions of low level
indiscipline in classrooms
56
Table 9.1 Perceptions of the overall impact of serious indiscipline/pupil
violence on the running of secondary schools
59
Table 9.2 Secondary teachers’ perceptions of serious indiscipline
around the school
60
Table 9.3 Secondary headteachers’ perceptions of serious indiscipline
around the school 61
Table 9.4 Secondary teachers’ perceptions of serious indiscipline in
the classroom
63
Table 9.5 Secondary headteachers’ perceptions of serious indiscipline
in the classroom
65
Table 9.6 Secondary support staff’s perceptions of serious indiscipline
in the classroom
67
Table 9.7 Percentage of secondary staff experiencing serious
indiscipline/violence at least once in the last twelve months
68
Table 9.8 Who was notified about the most recent serious incident?
Secondary teachers’ responses 69
Table 9.9 How was the incident followed up? Secondary teachers’
responses
69
Table 10.1 Positive behaviour in lessons: secondary pupils’ views 73
Table 10.2 Examples of positive behaviour: Feedback from secondary pupil focus groups
iv
Table 10.3 Secondary pupils’ view of school activities to promote positive behaviour
74
Table 10.4 Secondary pupils’ perceptions of negative behaviour in
lessons 76
Table 10.5 Secondary pupils’ views of behaviour around the school 77
Table 11.1 Policies and approaches on behaviour management in school in 2009
82
Table 11.2 Members of the secondary school community involved in developing strategies
85
Table 11.3 Time spent on behaviour management by secondary
headteachers and teachers in the last full teaching week 86
Table 11.4 Most and least frequently used behaviour management strategies in secondary schools
88
Table 12.1 Number of comparisons between 2006 and 2009 for each
question category and response group 91
Table 12.2 Secondary teachers’ responses to “Pupils arriving with the correct equipment”
92
Table 12.3 Secondary teachers responses to “Talking out of turn” 93
Figure 1 Primary teachers’ responses to “pupils keenly engaging with
their tasks”
93
Figure 2 Primary support staff’s response to “pupils arriving promptly
for classes”
93
Figure 3 Primary support staff’s response to “pupils contributing to
class discussions
94
Table 12.4 Direction and significance of changes between 2006 and 2009 for each respondent group for questions in the category “Positive behaviour in the classroom”
95
Table 12.5 Direction and significance of changes between 2006 and 2009 for each respondent group for questions in the category “Low level indiscipline in the classroom”
96
Table 12.6 Direction and significance of changes between 2006 and 2009 for each respondent group for questions in the category “Low level indiscipline around the school”
97
Table 12.7 Direction and significance of changes between 2006 and 2009 for each respondent group for questions in the category “Serious indiscipline in the classroom”
98
Table 12.8 Direction and significance of changes between 2006 and 2009 for each respondent group for questions in the category “Serious indiscipline around the school”
99
Table 12.9 Number of positively significant/non significant/negatively significant comparisons between 2006 and 2009 for each question category and respondent group
100
Table 14.1 Perceptions of the overall impact of serious indiscipline/pupil violence on primary and secondary schools
117
v
EXECUTIVE SUMMARY
This summary follows the order of the chapters of the report. For the sake of brevity we summarise the findings from primary and secondary schools together.
Introduction
1. The Scottish Government is committed to conducting three yearly national studies of behaviour in publicly funded schools. The aim is to provide a clear and robust picture of positive and negative behaviour in primary and secondary schools and of policy and practice in managing behaviour.
2. The current research provides a robust picture of perceptions and experiences of behaviour in publicly funded primary and secondary schools in 2009 and compares current findings to those in 2006.
3. The research involved surveys of teachers, headteachers and support staff in primary and secondary schools; interviews with representatives of all 32 local authorities and visits to a sample of 15 typical primary and secondary schools. The school visits complemented the survey findings and provided an opportunity to learn what pupils had to say about behaviour.
Positive behaviour around the school and in classrooms
4. The vast majority of staff said that all or most pupils were generally well behaved around the school and in classrooms. The least positive group were secondary school support staff with 79% saying that all or most pupils were generally well behaved around the school and 57% saying that pupils were generally well behaved in all or most lessons.
5. The most frequently encountered positive behaviour around both primary and secondary schools was pupils always or on most occasions greeting staff pleasantly.
6. The least frequently encountered positive behaviour around both primary and secondary schools was pupils challenging each other’s negative behaviour.
7. Primary and secondary headteachers tended to be more positive than teachers in their perceptions of positive behaviour around the school and in classrooms.
8. There are many examples of positive behaviour in classrooms. All staff surveyed were given the same list of positive behaviour and asked how frequently they encountered these during the last full teaching week. 9. More than 8 in 10 primary teachers and headteachers reported
meeting all the behaviours in the list in all or most lessons. For example, 91% of primary teachers observed pupils keenly engaging with their tasks; 96% of primary headteachers saw pupils listening to staff respectfully.
vi
equipment in all or most lessons but only around 1 in 4 saw pupils arriving promptly for most lessons.
11. Perceptions were less positive in secondary than in primary schools and there was more variation in secondary teachers’ perceptions compared to their primary colleagues. More than 6 in 10 secondary teachers reported meeting all the behaviours in the list of positive behaviours in classrooms in all or most lessons. Over 8 in 10 secondary teachers saw pupils following instructions and listening to the teacher respectfully in all or most lessons.
Low level indiscipline around the school and in classrooms
12. Describing behaviour as low level is not intended to underplay its effects on learning and teaching as this can be a constantly demanding aspect of their work for some teachers.
13. We provided a list of behaviours and asked staff how frequently they had encountered each behaviour in the last full teaching week around the school and in classrooms.
14. Around both primary and secondary schools, running in corridors was the most frequently observed behaviour. About a quarter of primary and secondary teachers and about 1 in 10 primary and secondary headteachers saw this several times a day.
15. A key difference between primary and secondary teachers in
behaviours around the school was the much greater observance of leaving school without permission in secondary school. 6% of primary and 46% of secondary teachers noticed this at least once a week. 16. There was a corresponding difference in respect of mobile phone use
against school policy around the school, with 71% of secondary teachers observing this at least once a week compared to 4% of primary teachers.
17. In the classroom the most frequently encountered behaviour by both primary and secondary teachers was the familiar irritant of talking out of turn. Only 4% of primary and 1% of secondary teachers said that they had not encountered this in the last week.
18. Using mobile phones/texting is the least frequently encountered low-level behaviour in classrooms with 98% of primary and 39% of secondary teachers saying that this had not been encountered at all in the last week. The difference between primary and secondary teachers is notable for this behaviour both around the school and in classroom. 19. Support staff identified a similar list of misbehaviour and tended to
observe these in greater numbers than teachers.
Serious indiscipline around schools and in classrooms
20. Primary and secondary staff1 were given a list of behaviours and asked
how frequently they had encountered these around the school and in classrooms in the last full teaching week. Headteachers were also
vii
asked how frequently these behaviours had been encountered by them or referred on to them.
21. The data reveal the occurrence of specific behaviour; they do not tell us about the numbers of pupils involved or the number of incidents. We focus first on physical violence and aggression towards staff before turning to pupil-to-pupil physical violence and aggression.
22. Both primary and secondary teachers and headteachers reported very low, although still of course concerning, numbers of serious incidents of physical violence and aggression towards them both in relation to the last full teaching week and over the previous twelve months.
23. When asked to rate on a five point scale the overall impact of serious indiscipline/pupil violence on the running of the school, the majority of primary teachers (65%), primary headteachers (77%) and support staff (64%) rated this as not very serious – points 4 and 5 on the scale. 24. In secondary schools the picture was less positive using the same
rating scale. A bare majority of secondary teachers (51%), and a minority of support staff (43%) rated this as not very serious – points 4 and 5 on the scale. However secondary headteachers were as positive as their counterparts in primary with 77% rating the impact of serious indiscipline/pupil violence on the running of the school as not very serious – points 4 and 5 on the scale
Around the school
25. Three out of 557 (<1%) primary and four out of 1,460 (<1%) secondary teachers reported experiencing physical violence towards them around the school at least once in the last full teaching week. Six primary out of 558 (<1%) and 39 out of 1460 secondary teachers (3%) reported physical aggression towards them around the school at least once in the last full teaching week.
26. Many more teachers and headteachers in both sectors report meeting pupil-to pupil physical violence and aggression around the school. For example, 1 in 4 primary and 1 in 5 secondary teachers encountered pupil-to-pupil physical violence around the school at least once last week. 38% of primary and 45% of secondary teachers say that they encountered pupil-to–pupil physical aggression.
27. Small numbers of primary headteachers, 16 out of 242 (7%), and secondary headteachers, 3 out of 245 (<1%) had experienced physical violence towards them or had this referred to them at least once during the previous week.
28. In contrast 33% of primary and 44% of secondary headteachers had either personally experienced or had referred to them pupil-to-pupil physical violence around the school at least once last week.
In classrooms
viii
support staff in primary and secondary schools on the classroom behaviours most frequently encountered or referred to them.
30. Twelve out of 554 (2%) primary and four out of 1459 (<1%) secondary teachers reported physical violence towards them in their classrooms at least once in the last full teaching week. For physical aggression the equivalent figures were 15 out of 554 (3%) primary and 44 out of 1458 (3%) secondary teachers.
31. For primary headteachers the classroom behaviour most frequently referred to them was pupil-to-pupil aggression with 57% saying that this had been referred to them at least once in the last week.
32. For secondary headteachers the classroom behaviour most frequently referred to them was general verbal abuse toward staff, closely followed by pupil-to-pupil general verbal abuse. Around 2 in 3 secondary headteachers said that these behaviours had been referred to them at least once in the last week.
33. Support staff in primary and secondary schools encountered physical violence or aggression in classrooms rarely. Some 19 out of 380 (5%) primary and five out of 654 (<1%) secondary encountered physical violence at least once in the last week.
34. The equivalent figures for physical aggression are 25 out of 380 (7%) primary and 27 out of 651 (4%) secondary support staff reporting this at least once last week.
35. The highest percentage of primary support staff experiencing serious indiscipline in the classroom related to pupil-to-pupil physical aggression, followed by pupil-to-pupil general verbal abuse. 56% and 47% of support staff reported encountering these behaviours respectively at least once last week.
36. Around 2 in 3 secondary support staff identified pupil-to-pupil general verbal abuse as the most frequently encountered serious indiscipline in classrooms.
37. When asked to list the types of behaviour which have the greatest negative impact on staff both primary and secondary headteachers tended to list lower levels of indiscipline such as cheeky or impertinent remarks and general rowdiness perhaps because of the greater frequency of these kinds of behaviour. They also highlighted verbal abuse among pupils, however.
In the last twelve months
ix
Pupils’ perceptions of behaviour in schools and classrooms
40. The data from pupils in primary and secondary schools provide a snapshot of opinion from a small sample in 15 schools. They are not representative of pupils in Scotland.
41. Primary and secondary pupils reported that most pupils behaved well usually around the school and in classrooms.
42. They enjoyed interesting lessons, extra curricular activities and primary pupils highly valued opportunities to choose activities.
43. They identified calling out in class or chatting as the most frequent low-level indiscipline in classrooms.
44. They saw schools as generally safe although the secondary sample had more mixed feelings about this than primary pupils.
45. Extreme forms of physical aggression and violence were seen as rare although there was concern about bullying in both sectors. They saw more physical violence and aggression amongst themselves than towards teachers.
46. There was praise for teachers who were fair, listened, had a sense of humour and used a variety of teaching methods.
47. Pupils in both sectors would have welcomed more opportunities to participate in decision-making about school matters.
Comparisons with 2006
48. There were 276 questions for which direct comparisons on behaviour in 2006 and 2009 were possible.
49. Perceptions of secondary teachers have moved in a positive direction for 51 out of 58 behaviours on which comparisons were possible. There was no change in perceptions for six behaviours and a negative change for one – pupils withdrawing from active engagement in the classroom.
50. Perceptions of secondary headteachers, primary teachers and primary headteachers have also moved in a positive direction but for these groups there were greater numbers of questions for which no significant movement either positive or negative could be detected. 51. Perceptions of secondary headteachers have moved in a positive
direction in 29 out of 45 behaviours for which comparisons were possible. There was no change for ten and a negative change in six. All the negative changes related to questions ending ‘towards you or your staff’ in 2009. In 2006 the questions focussed on only the headteachers’ experiences. The comparisons are therefore not strictly accurate.
x
53. Perceptions of primary headteachers have moved in a positive
direction for 15 out of 45 behaviours for which comparisons were possible. There was no change in 25 and a negative change in five. All the negative changes related to questions ending ‘towards you or your staff’ in 2009. In 2006 the questions focussed on only the headteachers’ experiences. The comparisons are therefore not strictly accurate.
54. Improvement in perceptions was least common among support staff in both sectors. Secondary support staff recorded a positive change for 11 out of the 35 behaviours for which comparison was possible. There was no change in 21 and a negative change in three.
55. Primary support staff reported a slightly larger number of negative than positive changes although they recorded no significant change for most items. Their perceptions had moved in a positive direction in three of the 35 behaviours for which comparison was possible. There was no change in 26 and a negative change in six.
Behaviour management approaches in primary and secondary schools
56. All schools surveyed used a multi-pronged approach to promote
positive behaviour and respond to negative behaviour. All strategies in the list provided in the survey were used in some schools.
57. The most frequently used strategies in primary schools were promoting a positive ethos through shared values, break time supervision and reward systems for pupils. These were also seen as the most helpful strategies.
58. Similar strategies were in frequent use in secondary schools, although anti-bullying policies and referral to more senior staff also featured prominently.
59. The majority of staff in both primary (83%) and secondary (68%) schools felt well supported by senior staff in dealing with behaviour management issues.
60. The majority of primary and secondary teachers surveyed had been actively involved in policy development, a view echoed by the headteachers who reported an open and consultative approach to policy development. For example, 99% of primary and secondary heads reported that they had involved teachers in developing behaviour management strategies.
61. There was a less positive picture from support staff with only 27% of support staff in secondary schools and 59% in primary schools agreeing or strongly agreeing with the statement that they had been regularly involved in discussions about improving behaviour.
62. A very large majority of primary teachers (93%) and secondary
teachers (87%) were confident or very confident in their abilities to promote positive behaviour. They were also confident or very confident in their abilities to respond to negative behaviour in their classrooms (89% and 85% respectively).
xi
they had had effective training. For secondary teachers the equivalent figure was 45%. Support staff in both sectors were less satisfied than teachers. Only 35% of primary and 21% in secondary agreed or strongly agreed that there was adequate training to deal with behavioural difficulties.
64. There is some evidence that newer approaches, specifically
encouraged by the Scottish Government and local authorities, such as restorative practices, are being more widely used in 2009.
Local authority perspectives
65. The foundation for behaviour policy was the development of a positive ethos and shared values in schools.
66. All authorities operated a form of staged intervention whereby
increasing levels of support were made available to pupils with behavioural needs. A common theme was in locating responsibility for pupils within schools, supported by specialist help and support from local authority officers at varying levels of seniority.
67. Two categories of young people giving cause for concern were those on the autistic spectrum and some very young children in early years settings, often from troubled households, who were displaying disruptive behaviour.
68. Authorities have different levels of satisfaction with their current
behaviour management policy, some feeling highly confident, others feeling that their policies were outdated and needing review and a large minority reporting that reviews were in progress.
69. Policy was typically developed through working groups involving
members from different sectors and holding a range of perspectives. Some authorities described broadening the base of policy development by more active involvement of parent and community representatives and young people.
70. Policies are monitored and evaluated through the analysis of local statistics using Quality Improvement Officers and in some cases by independent research.
71. The Positive Behaviour Team was highly regarded as a source of information, advice and support.
72. Authorities took very seriously the need to provide relevant and
effective training and a wide range is on offer.
73. All authorities reported procedures for handling serious indiscipline and violent incidents. A large minority of respondents were unsure about how statistics were used.
74. Policy priorities included the development of multi-agency working, and increasing input from Child and Adolescent Health Services in the context of concerns about numbers of young children growing up in very challenging circumstances.
1
1 INTRODUCTION
1.1 This chapter begins with a brief overview of the importance of behaviour in schools before outlining major policy developments in Scotland. It then describes the research design and methods adopted in the present study. It concludes by summarising the basis on which key research findings have been presented.
Policy context
1.2 Behaviour in schools is an emotive topic and one of enduring political interest and sensitivity. This is partly explained by the fact that establishing standards of good behaviour in schools has two linked purposes. It is a means to an end – the successful learning of young people. Clearly, young people are less likely to learn in classrooms where disruptive behaviour takes place and teacher time is spent on maintaining discipline rather than on the formal curriculum. Good behaviour is also an end in itself, however – a key purpose of schooling being to socialise young people into accepted norms of behaviour. Reports of declining standards of behaviour in schools, violence and bullying in playgrounds and on school premises generally, can thus contribute to more general concerns about crime, public safety and sense of well-being. As might be expected, concern about standards of behaviour in schools is not new and is an international one (Brown and Munn 2008).
1.3 The research specification for the current project describes the current policy in Scotland as follows:
The Scottish Government is committed to creating peaceful and positive learning environments in schools and to working in partnerships … to support local authorities and schools to introduce embedded approaches to promoting positive relationships and behaviour and to tackle indiscipline. (Scottish Government 2008).
Current policy is shaped by the focus on Curriculum for Excellence and Getting It Right For Every Child (GIRFEC). Curriculum for Excellence aims to provide a broad and flexible curriculum to engage and meet the needs of all children and young people. This builds upon and consolidates previous policy
from Better Behaviour Better Learning. Current policy is supported by the
Positive Behaviour Team and advised by the Scottish Advisory Group on Behaviour in Schools. GIRFEC and Additional Support for Learning policies provide the framework for more co-ordinated planning and support for children and young people. A more comprehensive review of policy development in this area is outside the scope of this report. It should be noted, however, that
current concern with behaviour can be traced to the Pack Report of 1977.2
The research
1.4 The Scottish Government is committed to conducting regular 3 yearly national studies of behaviour in schools to provide a clear and robust picture
2 We have used current policy terminology except where quoting directly from interviews or
2
of positive and negative behaviour in publicly funded schools and of current policy and practice in relation to managing behaviour. The 2009 research built on previous research in 2006 and had four main aims to:
• Provide clear and robust information on the nature and extent of
positive and negative behaviour in Scottish publicly funded schools in 2009;
• Provide trend information on key questions about positive and negative
behaviour compared to 2006;
• Describe the range of behaviour management approaches in use and
to report on staff’s perceptions of their effectiveness;
• Describe the training and support provided to staff and their confidence
in managing behaviour.
1.5 Media reports of behaviour in schools typically emphasise bad behaviour of one kind or another rather than positive behaviour. It was of obvious importance therefore, to collect robust evidence of the nature and extent of all behaviour so that a clear and reliable picture could be established. Equally important was the collection of evidence about effective strategies to promote positive behaviour so that there is evidence about the strategies and approaches currently being used in schools.
1.6 Measuring behaviour is no easy task since what counts as disruptive behaviour is highly context dependent. Teachers vary in what they see as disruptive behaviour depending, for example, on the age, stage, ethnicity and gender of pupils, the nature of the lesson and the time of day or year and levels of confidence and support. (See e.g. Pack Report 1977 and Johnstone and Munn 1992.) Similarly, strategies for intervention will differ according to the pupils or class concerned, the type of behaviour encountered and its frequency, the attitudes of senior management and the general ethos of the school (e.g. Munn et. al 2000). It was therefore important to develop a research design and methods which asked about specific types of positive and negative behaviour which staff experienced and to be able to supplement these perceptions with data gathering which was sensitive to school contexts. The survey approach used built on that used by Gray and Sime for the Elton Committee (DES 1989). This was to ask questions about specific behaviour encountered in the classroom and around the school in a specific week.
Research questions
1.7 The research questions for the study were developed from the aims above and from the research literature in this area. They are:
1. What do a range of stakeholders perceive and experience to be the nature and extent of positive and negative behaviour in publicly funded Scottish schools in 2009?
2. Are these perceptions significantly different from those in 2006?
3
4. What kinds of training and support are provided to staff about managing behaviour? How effective are these in the opinion of participants?
5. How confident are teaching and support staff in promoting positive behaviour and in managing negative behaviour?
6. How are serious incidents followed up?
Research design and methods
1.8 There were four main strands to the research design with different methods being used in each. The school visits encompassed two strands i) data collection from staff and ii) data collection from pupils.
Strand 1: Survey
1.9 This involved a large-scale survey of teachers, headteachers and support
staff in a representative sample of publicly funded primary and secondary
schools across Scotland.3 Table 1.1 summarises information on response
rates.4
TABLE 1.1: RESPONDENT GROUPS AND RETURN RATES
Table 1.1 gives, for each respondent group, the numbers of survey forms sent out and received back in 2006 and 2009 along with the return rates. The last column gives the 2009 standard error as a percentage of the 2006 standard error (SE).
Respondent group 2006
forms sent out
2006 forms
back
2006 return
rate
2009 forms sent out
2009 forms
back
2009 return
rate
09 S.E./ 06 S.E.
Secondary Teachers 1,008 550 54.6% 3,382 1,468 43.4% 61%
Secondary
Headteachers 250 169 67.6% 377 246 65.3% 83%
Secondary Support
Staff 500 314 62.8% 1,305 678 52.0% 68%
Primary Teachers 1,032 530 51.4% 1,288 560 43.5% 97%
Primary Headteachers 330 215 65.2% 430 244 56.7% 94%
Primary Support Staff 330 187 56.7% 863 391 45.3 % 71%
1.10 The 2009 survey offers improved precision compared to the 2006 survey due to the larger sample size in 2009. Even though the response rate was lower for all groups the number of survey forms returned was higher. For example, the response rate from secondary teachers was 43% in 2009 compared to 55% in 2006. However there were 1468 responses from this group in 2009 compared to 550 in 2006.
1.11 The standard errors are dependent on the achieved samples (i.e. the number that responded rather than the response rates) and, despite the lower response rates, achieved samples were still larger than in 2006 for all six groups. In the case of the Primary Teachers, the increase was very small and
3 The surveys and details of sample construction are available in a technical annex available
online.
4
the standard error fell by only three per cent. The largest increase was for the Secondary Teachers where the standard error was reduced by over a third. As an example of the effect of this in practice, if 33% of Secondary Teachers in the sample expressed a given opinion, the standard error for the estimate of this proportion in the population would be 1.2 in 2009, down from 2.0 in 2006.
1.12 Testing for the effects of non-response from schools revealed that there is no evidence that the achieved level introduced a significant degree of bias into the results of the 2009 survey5. We are unable to test for the effects of non-response from individuals in schools (i.e. whether those who do not respond hold the same views as those who do). Nevertheless, we are confident that the 2009 survey results provide a statistically robust picture of the perceptions of the six groups of respondents in terms of positive and negative behaviour in schools.
1.13 A final point to bear in mind is that the surveys provide us with information about the kind of behaviour experienced and the frequency of dealing with it. They do not tell us about the number of pupils behaving in particular ways or about the number of individual incidents. This is particularly important when we come to chapters on low level and serious indiscipline in primary and secondary schools.
1.14 Although one pupil misbehaving is one too many, it would be mistaken to assume that the frequency of the occurrence of a behaviour is the same as the number of pupils displaying that behaviour.
Strands 2 and 3: school visits
1.15 A second strand of the research consisted of visits to 7 typical primary and 8 typical secondary schools. The purpose of the visits was to contextualise the survey findings and to explore issues that did not lend themselves to investigation via the surveys. These included for example, the details of the approaches to behaviour management adopted in the schools.
1.16 The schools were selected on the basis of recent reports and scores from HMIe as typical. They were chosen to achieve a balance in terms of urban/rural location, denominational/non-denominational status and proportion of roll entitled to free school meals. Permission to approach them was sought from the local authority and then discussions took place with the headteacher. One primary school was unable to take part at a late stage because of the illness of the headteacher.
1.17 Within each school a number of different data collection activities took place. These were:
• Interviews with the headteacher and other senior staff;
• Two focus groups of staff including probationer teachers and chartered
teachers where possible;
5
• One focus group of support staff – those actively involved in helping
children in classrooms.
1.18 Strand three of the research undertaken at the same time as school
visits involved data collection from pupils. This comprised:
• Surveys of pupils in P5 and P7 and S1 and S3 (one class per year);
• Focus groups of pupils from the above years exploring in more detail
their perceptions of positive and negative behaviour in the school.
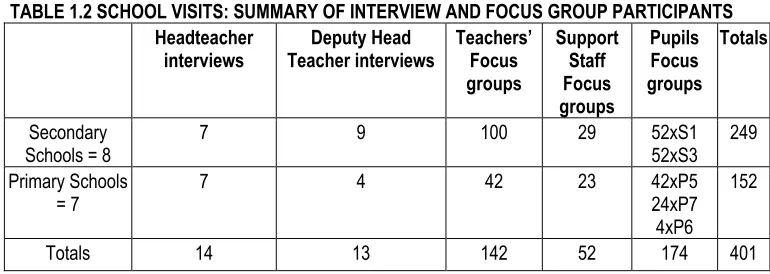
1.19 All interviews and focus groups with staff and pupils were tape-recorded and extensive notes were taken. The research team worked in pairs to facilitate the focus groups and administered the questionnaires directly to pupils in their classes, clarifying questions as appropriate. Pupil numbers in the survey are reported in more detail in the chapters discussing pupils’ views. A total of 250 primary pupils and 316 secondary pupils completed the surveys. Table 1.2 below provides a summary of the numbers of staff and pupils involved in the interviews and focus groups.
Strand 4: local authority interviews
[image:22.595.121.506.461.598.2]1.20 The fourth strand of the research involved telephone interviews with local authority representatives, selected by Directors of Education or equivalent to be well placed to discuss the local authority’s approach to behaviour management. The representatives received a copy of the interview schedule in advance to enable them to prepare for the interview and collect appropriate documentation. All interviews were tape-recorded and the researchers also took extensive notes.
TABLE 1.2 SCHOOL VISITS: SUMMARY OF INTERVIEW AND FOCUS GROUP PARTICIPANTS Headteacher
interviews Teacher interviews Deputy Head Teachers’ Focus groups
Support Staff Focus groups
Pupils Focus groups
Totals
Secondary
Schools = 8 7 9 100 29 52xS1 52xS3 249
Primary Schools = 7
7 4 42 23 42xP5
24xP7 4xP6
152
Totals 14 13 142 52 174 401
1.21 The qualitative data were analysed by summarising key themes from each school visit. The researchers visiting particular schools wrote a jointly agreed report based on these themes. Pairs of researchers varied across the 15 schools so that different people were involved in writing each report. These were aide memoirs backed by extensive notes and tape recordings where details could be checked as need be.
6 A robust picture
7
2 POSITIVE
BEHAVIOUR
IN PRIMARY SCHOOLS
Introduction
2.1 Primary schools actively promote positive behaviour as well as having systems in place to deal with negative behaviour. How were strategies promoting positive behaviour reflected in perceptions of positive behaviour around the school and in the classroom? We report data from the surveys of primary teachers, headteachers and support staff supplemented by interviews and focus groups undertaken in the visits to seven primary schools. We begin by considering data about positive behaviour around the school before moving to data concerning classrooms. In general we highlight the most and least frequently encountered behaviours in commenting on the tables. We conclude the chapter by highlighting key comparisons with the 2006 data.
A positive picture
2.2 Before beginning the detailed reporting of the survey data in this and subsequent chapters it is important to provide an overview of perceptions of behaviour of pupils from survey respondents. The picture is overwhelmingly positive.
2.3 We asked headteachers, teachers, and support staff, ‘Thinking about the
all the behaviour you encounter around the school, how many pupils do you find generally well behaved?’ An impressive 100% of primary headteachers, 97% of teachers and 96% of support staff indicated that all or most of the pupils they encountered around the school were generally well behaved.
2.4 We also asked about behaviour in classrooms. Just over 99% of
headteachers6 said that all or most of the school roll were generally well
behaved during lessons,7 and 93% of teachers and 89% of support staff said
that pupils were generally well behaved in all or most lessons.
Positive behaviour around the school
2.5 The survey asked teachers and headteachers about how often they encountered particular types of pupil behaviour during the last full teaching week.8
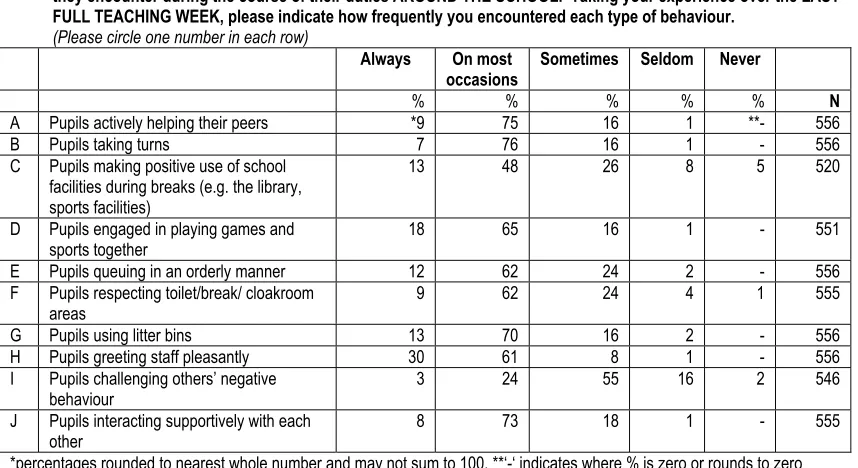
2.6 Table 2.1 shows that the positive behaviour encountered most frequently on all or most occasions by teachers, 91%, was that pupils greet them pleasantly (H), a view shared by 97% of headteachers. (See table 2.2).
2.7 The behaviour least frequently encountered by teachers and headteachers was pupils challenging others’ negative behaviour (I). Some 18% of teachers encountered this seldom or never as did 10% of headteachers.
6 Most primary headteachers had class contact time.
7 Most primary headteachers had class contact time.
8
TABLE 2.1 PRIMARY TEACHERS’ VIEWS OF POSITIVE BEHAVIOUR AROUND THE SCHOOL
Q16. We have listed below some examples of different types of positive pupil behaviour which teachers have told us they encounter during the course of their duties AROUND THE SCHOOL. Taking your experience over the LAST FULL TEACHING WEEK, please indicate how frequently you encountered each type of behaviour.
(Please circle one number in each row)
Always On most occasions
Sometimes Seldom Never
% % % % % N
A Pupils actively helping their peers *9 75 16 1 **- 556 B Pupils taking turns 7 76 16 1 - 556 C Pupils making positive use of school
facilities during breaks (e.g. the library, sports facilities)
13 48 26 8 5 520
D Pupils engaged in playing games and
sports together 18 65 16 1 - 551
E Pupils queuing in an orderly manner 12 62 24 2 - 556 F Pupils respecting toilet/break/ cloakroom
areas 9 62 24 4 1 555
G Pupils using litter bins 13 70 16 2 - 556 H Pupils greeting staff pleasantly 30 61 8 1 - 556 I Pupils challenging others’ negative
behaviour 3 24 55 16 2 546
J Pupils interacting supportively with each
other 8 73 18 1 - 555
*percentages rounded to nearest whole number and may not sum to 100, **‘-‘ indicates where % is zero or rounds to zero
Table 2.2 PRIMARY HEADTEACHERS’ VIEWS OF POSITIVE BEHAVIOUR AROUND THE SCHOOL
Q16. We have listed below some examples of different types of positive pupil behaviour which teachers have told us they encounter during the course of their duties AROUND THE SCHOOL. Taking your experience over the LAST FULL TEACHING WEEK, please indicate how frequently you encountered each type of behaviour.
(Please circle one number in each row)
Always On most
occasions Sometimes Seldom Never
% % % % % N
A Pupils actively helping their peers *10 84 6 **- - 244 B Pupils taking turns 12 84 5 - - 244 C Pupils making positive use of school
facilities during breaks (e.g. the library, sports facilities)
17 63 16 2 1 232
D Pupils engaged in playing games and sports together
21 70 10 - - 243
E Pupils queuing in an orderly manner 18 72 10 - - 243 F Pupils respecting toilet/break/cloakroom
areas
17 75 8 - - 243
G Pupils using litter bins 18 75 7 - - 244 H Pupils greeting staff pleasantly 40 57 3 - - 244 I Pupils challenging others’ negative
behaviour 2 26 61 10 - 243
J Pupils interacting supportively with each other
10 81 9 - - 244
*percentages rounded to nearest whole number and may not sum to 100, **‘-‘ indicates where % is zero or rounds to zero
[image:25.595.86.513.375.604.2]9
2.9 The school visits supported this general picture. We were given the opportunity to tour the schools, visiting the library; general classrooms, staffrooms and pupil support bases and often shared a meal with pupils in the dining room. We got the impression of a lively and purposeful environment and observed pupils and staff walking around the school greeting each other in a polite and friendly way. The schools were generally clean and tidy. The general view was typified by the comment from focus groups in one primary
school that behaviour was: good and manageable. (PS5)
Positive behaviour in classrooms
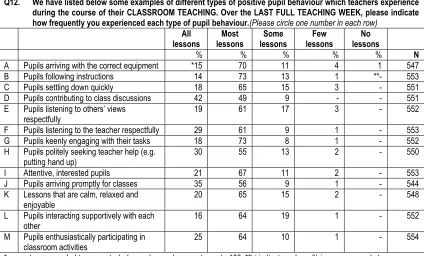
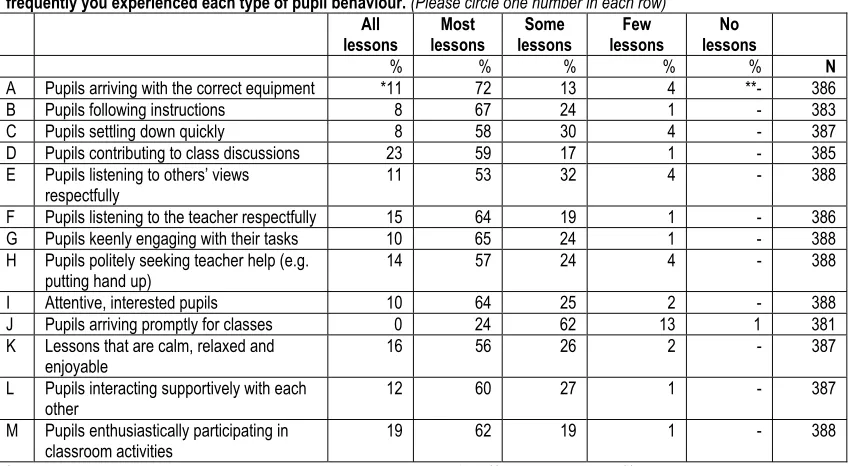
[image:26.595.86.510.289.545.2]2.10 The survey asked teachers, headteachers and support staff about how often they encountered particular types of pupil behaviour in classrooms during the last full teaching week.
TABLE 2.3 PRIMARY TEACHERS’ VIEWS OF POSITIVE BEHAVIOUR IN CLASSROOMS
Q12. We have listed below some examples of different types of positive pupil behaviour which teachers experience during the course of their CLASSROOM TEACHING. Over the LAST FULL TEACHING WEEK, please indicate how frequently you experienced each type of pupil behaviour.(Please circle one number in each row)
All
lessons lessons Most lessons Some lessons Few lessons No
% % % % % N
A Pupils arriving with the correct equipment *15 70 11 4 1 547 B Pupils following instructions 14 73 13 1 **- 553 C Pupils settling down quickly 18 65 15 3 - 551 D Pupils contributing to class discussions 42 49 9 - - 551 E Pupils listening to others’ views
respectfully 19 61 17 3 - 552
F Pupils listening to the teacher respectfully 29 61 9 1 - 553 G Pupils keenly engaging with their tasks 18 73 8 1 - 552 H Pupils politely seeking teacher help (e.g.
putting hand up) 30 55 13 2 - 550
I Attentive, interested pupils 21 67 11 2 - 553 J Pupils arriving promptly for classes 35 56 9 1 - 544 K Lessons that are calm, relaxed and
enjoyable
20 65 15 2 - 548
L Pupils interacting supportively with each
other 16 64 19 1 - 552
M Pupils enthusiastically participating in
classroom activities 25 64 10 1 - 554
*percentages rounded to nearest whole number and may not sum to 100, **‘-‘ indicates where % is zero or rounds to zero
2.11 The overwhelmingly general picture of positive behaviour in classrooms mentioned above is reinforced by particular examples of positive behaviour. Table 2.3 above shows that 91% of teachers saw pupils contributing actively to class discussions (D) on all or most occasions. The least frequently noticed behaviours, pupils listening to others views respectfully (E) and pupils interacting supportively with each other (L), were reported by about 1 in 5 teachers to occur in all lessons. The very small percentages in the few or no lessons columns reinforces the generally positive picture of life in classrooms.
10
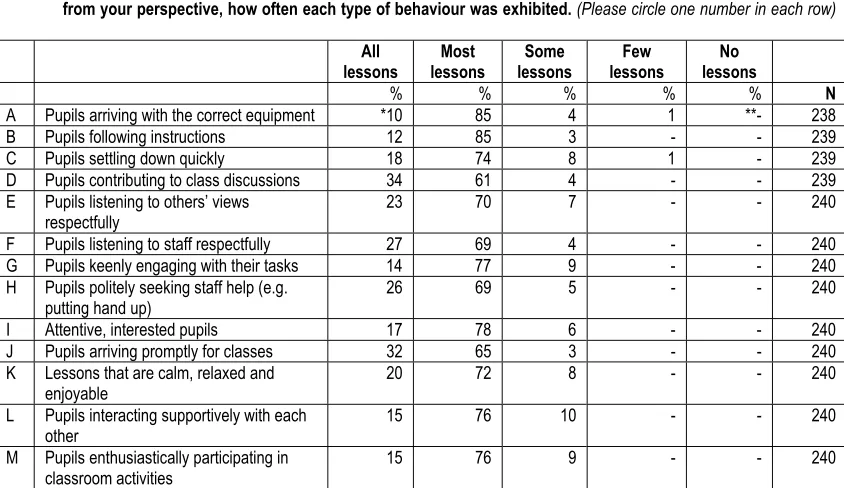
[image:27.595.87.509.159.403.2]lessons, reported by 97% of headteachers. The blank percentages in the “few” or “no lessons” columns reinforces the generally positive picture of life in classrooms.
TABLE 2.4 PRIMARY HEADTEACHERS’ VIEWS OF POSITIVE BEHAVIOUR IN CLASSROOMS
Q17. We have listed below some examples of different types of positive pupil behaviour which teachers experience during the course of their CLASSROOM TEACHING. Over the LAST FULL TEACHING WEEK, please indicate, from your perspective, how often each type of behaviour was exhibited. (Please circle one number in each row)
All
lessons lessons Most lessons Some lessons Few lessons No
% % % % % N
A Pupils arriving with the correct equipment *10 85 4 1 **- 238 B Pupils following instructions 12 85 3 - - 239 C Pupils settling down quickly 18 74 8 1 - 239 D Pupils contributing to class discussions 34 61 4 - - 239 E Pupils listening to others’ views
respectfully 23 70 7 - - 240
F Pupils listening to staff respectfully 27 69 4 - - 240 G Pupils keenly engaging with their tasks 14 77 9 - - 240 H Pupils politely seeking staff help (e.g.
putting hand up) 26 69 5 - - 240
I Attentive, interested pupils 17 78 6 - - 240 J Pupils arriving promptly for classes 32 65 3 - - 240 K Lessons that are calm, relaxed and
enjoyable
20 72 8 - - 240
L Pupils interacting supportively with each
other 15 76 10 - - 240
M Pupils enthusiastically participating in
classroom activities 15 76 9 - - 240
*percentages rounded to nearest whole number and may not sum to 100, **‘-‘ indicates where % is zero or rounds to zero
11
TABLE 2.5 PRIMARY SUPPORT STAFF’S VIEWS ON POSITIVE BEHAVIOUR IN CLASSROOMS
Q8. We have listed below some examples of different types of positive pupil behaviour which teachers experience during the course of their CLASSROOM TEACHING. Over the LAST FULL TEACHING WEEK, please indicate how frequently you experienced each type of pupil behaviour. (Please circle one number in each row)
All lessons
Most lessons
Some lessons
Few lessons
No lessons
% % % % % N
A Pupils arriving with the correct equipment *11 72 13 4 **- 386 B Pupils following instructions 8 67 24 1 - 383 C Pupils settling down quickly 8 58 30 4 - 387 D Pupils contributing to class discussions 23 59 17 1 - 385 E Pupils listening to others’ views
respectfully
11 53 32 4 - 388
F Pupils listening to the teacher respectfully 15 64 19 1 - 386 G Pupils keenly engaging with their tasks 10 65 24 1 - 388 H Pupils politely seeking teacher help (e.g.
putting hand up) 14 57 24 4 - 388
I Attentive, interested pupils 10 64 25 2 - 388 J Pupils arriving promptly for classes 0 24 62 13 1 381 K Lessons that are calm, relaxed and
enjoyable 16 56 26 2 - 387
L Pupils interacting supportively with each
other 12 60 27 1 - 387
M Pupils enthusiastically participating in classroom activities
19 62 19 1 - 388
*percentages rounded to nearest whole number and may not sum to 100, **‘-‘ indicates where % is zero or rounds to zero
Comparisons with 2006
2.14 Comparisons were made with 2006 on key questions showing where there were significant positive or negative changes in the frequencies with which behaviours were reported. Chapter 12 considers comparisons in detail. The key findings at classroom level9 are:
• There was no significant change in primary head teachers views
between the two surveys;
• There is a positive change in perceptions of primary teachers on five
out of 11 behaviours for which comparison is possible. For example they show a more positive view of attentive pupils, keenly engaging with their tasks, listening to each other/their teachers and of a relaxed classroom;
• There was no significant change in perceptions of primary support
staff for 9 of the 11 behaviours where comparison was possible. In two aspects of classroom behaviour, following instructions and contributing to class discussion perceptions were more negative in 2009 than in 2006.
2.15 Overall there was little change in the views of primary school staff. Where views have changed the picture is much more reflective of positive than of negative change from 2006 to 2009.
12
3 LOW-LEVEL INDISCIPLINE IN PRIMARY SCHOOLS
Introduction
3.1 Previous surveys have contrasted perceptions of the frequency of so called ‘low-level’ indiscipline in schools and classrooms, such as talking out of turn and work avoidance, with more serious aggressive and violent behaviour. We continue with this approach. We begin by reporting perceptions of this low-level indiscipline around the school and in the classroom before turning to more serious behaviour in the next chapter. We should make clear, however, that describing indiscipline as low-level is not intended to underplay its effects on learning and teaching. Indeed, teachers in previous surveys have talked about the wearing effect of the ‘drip, drip’ of low-level misbehaviour in their classrooms (Johnstone and Munn 1992). What did they have to say about this in 2009? We begin by reporting survey data from teachers, headteachers and support staff, supplemented by data from the seven primary schools we visited. In general we highlight the most and least frequently encountered behaviours in commenting on the tables.
3.2 It is important to note that the surveys provide us with information about the kind of behaviour experienced and the frequency of dealing with it. They
do not tell us about the number of pupils behaving in particular ways or the
number of individual incidents. This is very important when we look at both low-level and serious indiscipline. Although one pupil misbehaving is one too many, it would be mistaken to assume that the frequency of the occurrence of a behaviour is the same as the number of pupils displaying that behaviour. So a teacher perceiving talking out of turn several times a day, for example, could be reporting one pupil talking out of turn several times, or several pupils talking out of turn once.
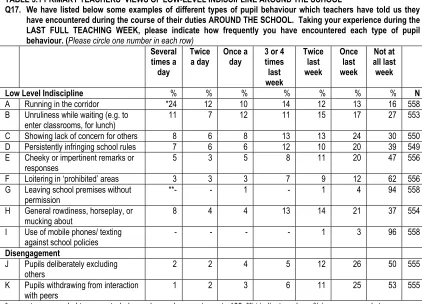
Low-level indiscipline around the school
3.3 We provided teachers and headteachers10 with a list of behaviours and
asked them about how frequently they had encountered these around the school in the last full week. Tables 3.1 and 3.2 provide a mixed picture. We can see that in Table 3.1 the behaviour encountered most frequently by teachers was pupils running in corridors (A) twice a day or more frequently. More than one in three teachers experienced this. The least frequently encountered behaviour was leaving school without permission (G) with 94% of teachers saying that they had not encountered this at all in the last week.
13
TABLE 3.1 PRIMARY TEACHERS’ VIEWS OF LOW-LEVEL INDISCIPLINE AROUND THE SCHOOL
Q17. We have listed below some examples of different types of pupil behaviour which teachers have told us they have encountered during the course of their duties AROUND THE SCHOOL. Taking your experience during the LAST FULL TEACHING WEEK, please indicate how frequently you have encountered each type of pupil behaviour. (Please circle one number in each row)
Several times a day
Twice a day
Once a day
3 or 4 times last week
Twice last week
Once last week
Not at all last week
Low Level Indiscipline % % % % % % % N
A Running in the corridor *24 12 10 14 12 13 16 558 B Unruliness while waiting (e.g. to
enter classrooms, for lunch)
11 7 12 11 15 17 27 553
C Showing lack of concern for others 8 6 8 13 13 24 30 550 D Persistently infringing school rules 7 6 6 12 10 20 39 549 E Cheeky or impertinent remarks or
responses
5 3 5 8 11 20 47 556
F Loitering in ‘prohibited’ areas 3 3 3 7 9 12 62 556 G Leaving school premises without
permission
**- - 1 - 1 4 94 558
H General rowdiness, horseplay, or mucking about
8 4 4 13 14 21 37 554
I Use of mobile phones/ texting
against school policies - - - - 1 3 96 558
Disengagement
J Pupils deliberately excluding
others 2 2 4 5 12 26 50 555
K Pupils withdrawing from interaction
with peers 1 2 3 6 11 25 53 555
*percentages rounded to nearest whole number and may not sum to 100, **‘-‘ indicates where % is zero or rounds to zero
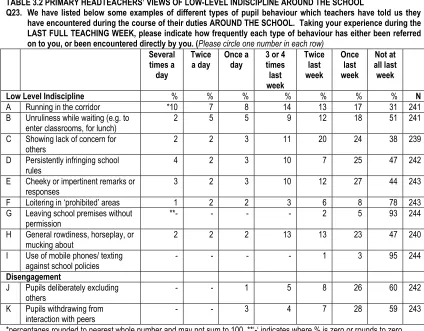
3.4 Primary headteachers also represent a fairly positive picture of behaviour around the school as Table 3.2 shows. 17% had seen running in the corridors (A) twice a day or more, the most frequently encountered behaviour. At the other end of the scale, 95% had not encountered at all in the last week pupils using mobile phones/texting against school policies (I).
3.5 Primary headteachers tended to be more positive in their reporting of behaviour around the school than teachers. They tended to encounter low-level indiscipline less frequently. Eight out of the eleven types of low-low-level indiscipline were reported less frequently by headteachers than teachers. Of the three behaviours reported more frequently by teachers, the percentages differences with headteachers were slight.
3.6 A typical view from the schools visited was that often if things went wrong
it was in the playground. Such behaviour tended to be: very, very low
14
TABLE 3.2 PRIMARY HEADTEACHERS’ VIEWS OF LOW-LEVEL INDISCIPLINE AROUND THE SCHOOL
Q23. We have listed below some examples of different types of pupil behaviour which teachers have told us they have encountered during the course of their duties AROUND THE SCHOOL. Taking your experience during the LAST FULL TEACHING WEEK, please indicate how frequently each type of behaviour has either been referred on to you, or been encountered directly by you. (Please circle one number in each row)
Several times a day
Twice a day
Once a day
3 or 4 times last week
Twice last week
Once last week
Not at all last week
Low Level Indiscipline % % % % % % % N
A Running in the corridor *10 7 8 14 13 17 31 241 B Unruliness while waiting (e.g. to
enter classrooms, for lunch)
2 5 5 9 12 18 51 241
C Showing lack of concern for
others 2 2 3 11 20 24 38 239
D Persistently infringing school
rules 4 2 3 10 7 25 47 242
E Cheeky or impertinent remarks or responses
3 2 3 10 12 27 44 243
F Loitering in ‘prohibited’ areas 1 2 2 3 6 8 78 243 G Leaving school premises without
permission
**- - - - 2 5 93 244
H General rowdiness, horseplay, or mucking about
2 2 2 13 13 23 47 240
I Use of mobile phones/ texting
against school policies - - - - 1 3 95 244
Disengagement
J Pupils deliberately excluding
others - - 1 5 8 26 60 242
K Pupils withdrawing from
interaction with peers - - 3 4 7 28 59 243 *percentages rounded to nearest whole number and may not sum to 100, **‘-‘ indicates where % is zero or rounds to zero
Low-level indiscipline in the classroom
3.7 We now turn to low-level indiscipline in the classroom. We focus on the views of classroom teachers and support staff as those most directly able to report on this11.
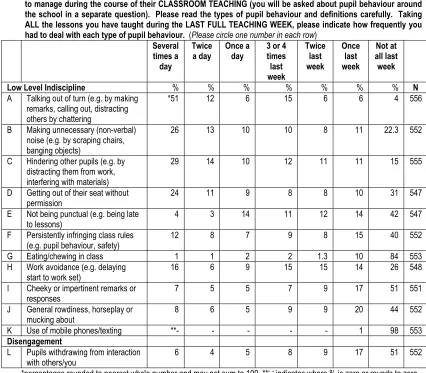
3.8 In Table 3.3 we can see that, as with previous surveys, ‘talking out of turn’ (A) is the behaviour encountered by teachers most frequently. Some 63% met this twice a day or more and only 4% of teachers said that they had not encountered talking out of turn in their last teaching week. The least frequently encountered behaviour was use of mobile phones/texting (K) with 98% of teachers saying that they had not encountered this behaviour at all in the last week.
15
TABLE 3.3 PRIMARY TEACHERS’ VIEWS OF LOW-LEVEL INDISCIPLINE IN THE CLASSROOM
Q13. We have listed below some examples of different types of pupil behaviour which teachers have told us they have to manage during the course of their CLASSROOM TEACHING (you will be asked about pupil behaviour around the school in a separate question). Please read the types of pupil behaviour and definitions carefully. Taking ALL the lessons you have taught during the LAST FULL TEACHING WEEK, please indicate how frequently you had to deal with each type of pupil behaviour. (Please circle one number in each row)
Several times a day
Twice
a day Once a day 3 or 4 times last week Twice last week Once last week Not at all last week
Low Level Indiscipline % % % % % % % N
A Talking out of turn (e.g. by making remarks, calling out, distracting others by chattering
*51 12 6 15 6 6 4 556
B Making unnecessary (non-verbal) noise (e.g. by scraping chairs, banging objects)
26 13 10 10 8 11 22.3 552
C Hindering other pupils (e.g. by distracting them from work, interfering with materials)
29 14 10 12 11 11 15 555
D Getting out of their seat without permission
24 11 9 8 8 10 31 547
E Not being punctual (e.g. being late
to lessons) 4 3 14 11 12 14 42 547
F Persistently infringing class rules
(e.g. pupil behaviour, safety) 12 8 7 9 8 15 40 552 G Eating/chewing in class 1 1 2 2 1.3 10 84 553 H Work avoidance (e.g. delaying
start to work set)
16 6 9 15 15 14 26 548
I Cheeky or impertinent remarks or responses
7 5 5 7 9 17 51 551
J General rowdiness, horseplay or
mucking about 8 6 5 9 9 20 44 552
K Use of mobile phones/texting **- - - - - 1 98 553
Disengagement
L Pupils withdrawing from interaction with others/you
6 4 5 8 9 17 51 552
*percentages rounded to nearest whole number and may not sum to 100, **‘-‘ indicates where % is zero or rounds to zero
3.9 In considering the perceptions of support staff, it is important to remember that support staff work with pupils in different ways and do not necessarily see the same range of classes as teachers. To illustrate the range and variety of
ways in which support staff work we asked, ‘Who do you provide classroom
support to this school year?’ We asked them to report all the different ways – not just the main way in which they provided support.
• 48% provided support to a few classes;
• 39% provided support to few pupils;
• 38% provided support to one individual pupil
• 34% provided support to any class as required;
• 22% provided support in a classroom where there were pupils with
behavioural needs;
• 18% provided support to one particular class.
• 7% provided support in a support base, with pupils who have
behavioural needs.
16
they had not encountered talking out of turn at all in the last week. The behaviour least likely to be encountered by support staff was pupils’ use of mobile phones/texting (K) with 97% saying that they had not met this behaviour in the last week.
3.11 In one or two focus groups support staff were critical of teachers’
responses to misbehaviour, for example indicating that: Sometimes something
has to be done (PS7), meaning that sometimes a sanction could be used when the teacher uses an alternative approach. This may mean, of course, that there is a miscommunication or lack of discussion between support staff and teachers about the timing and use of sanctions in relation to particular individuals.
TABLE 3.4 PRIMARY SUPPORT STAFF’S VIEWS OF LOW-LEVEL INDISCIPLINE IN THE CLASSROOM
Q9. We have listed below some examples of different types of pupil behaviour which staff have told us they have to manage during the course of their CLASSROOM TEACHING. Please read the types of pupil behaviour and definitions carefully. Taking ALL the lessons you have assisted in during the LAST FULL TEACHING WEEK, please indicate how frequently you had to deal with each type of pupil behaviour. (Please circle one number in each row)
Several times a day Twice a day Once a day
3 or 4 times last week Twice last week Once last week Not at all last week
Low Level Indiscipline % % % % % % % N
A Talking out of turn (e.g. by making remarks, calling out, distracting others by chattering
*52 10 9 12 7 7 4 382
B Making unnecessary (non-verbal) noise (e.g. by scraping chairs, banging objects)
39 10 9 9 5 11 17 383
C Hindering other pupils (e.g. by distracting them from work, interfering with materials)
34 12 12 10 7 11 14 381
D Getting out of their seat without
permission 36 9 10 9 7 8 20 380
E Not being punctual (e.g. being late to lessons)
8 6 14 7 8 14 43 370
F Persistently infringing class rules (e.g. pupil behaviour, safety)
18 7 8 11 8 12 36 376
G Eating/chewing in class 3 2 3 1 2 6 84 377 H Work avoidance (e.g. delaying
start to work set)
18 8 10 12 10 18 24 381
I Cheeky or impertinent remarks or
responses 19 4 7 9 9 18 34 381
J General rowdiness, horseplay or
mucking about 18 6 9 10 10 19 28 382
K Use of mobile phones/texting **- - 1 - 1 2 97 378
Disengagement
L Pupils withdrawing from interaction
with others/you 9 2 7 6 8 17 50 375
*percentages rounded to nearest whole number and may not sum to 100, **‘-‘ indicates where % is zero or rounds to zero
Comparison with 2006