The urban and regional
dimension of the crisis
Eighth progress report on economic,
social and territorial cohesion
Europe Direct is a service to help you find answers
to your questions about the European Union.
Freephone number (*):
00 800 6 7 8 9 10 11
(*) Certain mobile telephone operators do not allow access to 00 800 numbers or these calls may be billed.
More information on the European Union is available on the Internet (http://europa.eu).
Cataloguing data can be found at the end of this publication.
Luxembourg: Publications Office of the European Union, 2013
ISBN: 978-92-79-31129-1 doi:10.2776/74866
Cover Pictures: © Directorate-general for Regional and Urban Policy
© European Union, 2013
1. Introduction
. . . .6
2. Setting the scene
. . . .7
2.1. Contraction of GDP and employment
. . . .7
2.2. Deteriorating national and sub-national finance
. . . .7
2.3. Construction and manufacturing most affected by the recession
. . . .8
2.4. Exports recovering
. . . .8
2.5. Foreign direct investments slowing down
. . . .8
2.6. Increasing risk of poverty and exclusion
. . . .10
3. The regional impact
. . . .13
3.1. GDP and employment in the first three years of the crisis
. . . .13
3.2. Unemployment increasing especially in southern regions
. . . .13
3.3. Migration slowing down
. . . .14
4. The urban impact
. . . .15
4.1. Metro regions mix resilience and vulnerability
. . . .15
4.2. Cities in crisis
. . . .15
5. Cohesion policy and the crisis
. . . .17
Annexes
. . . .19
The eighth progress report on economic, social and territorial cohesion highlights the regional and urban impact of the crisis. This report was adopted during the final days of the negotiations on cohesion policy period 2014 to 2020. This new period of Cohesion policy will start amidst the wreckage of the worst recession in the last fifty years, while some regions and countries continue to face a shrinking economy even in 2014.
Between 2008 and 2012, unemployment increased in four out of five regions in the EU. In addition, GDP shrank in two out of three regions between 2007 and 2010. This crisis has a widespread effect including both more and less developed regions. As a result, the disparities between EU regions have started to grow again after a long period of convergence. Most capital metro regions have managed to withstand the crisis better than the other metro regions. Now the challenge is to ensure that all regions return to a positive growth path.
As the crisis drags on, the impact on poverty and exclusion has started to emerge. The number of people at-risk-of-poverty-and-exclusion has grown significantly since the start of the crisis. In particular, the number of people living in a household with a very low work intensity increased by more than 4 million between 2008 and 2011. Between 2008 and 2011, the at-risk-of-poverty-and-exclusion increased twice as much in cities than in other areas. This was especially noticeable in the EU-15, where the poverty and exclusion rates were already higher in cities before the crisis.
The next round of cohesion policy programmes should ensure that their investments in contribute most to overcoming the impact of the crisis on our regions and cities.
Maximising the impact requires both the right institutional and economic context and selecting the best projects. That is why the Commission wants to invest more in improving administrative capacity and has linked Cohesion Policy to the broader EU economic governance to improve the conditions for growth. The best projects depend on the region or city, but they will often include measures to boost innovation, education, training, entrepreneurship and access to finance.
Foreword
Johannes Hahn
Member of the European Commission in charge of Regional Policy
László Andor
In 2014, the Cohesion Policy programming period will start in the aftermath of the worst recession of the last fifty years. The crisis has reversed the process of convergence of regional GDP per head and unemployment within the EU. The chal-lenge now is to ensure a prompt return to a strong growth path, especially in the less developed regions and cities.
To support the forthcoming programme negotiations, this report highlights the crisis-induced changes that will affect the context and priorities of the new programmes. The report first sets the scene with an overview of the main developments at national level. It then looks at the impact of the crisis on regions and cities and the growing dispari-ties. Finally, it outlines how the changed economic environ-ment will affect the future Cohesion programmes and underlines the need for a strong thematic concentration.
This report follows the 7th progress report, published in 2010, and will be followed by the publication of the 6th Cohesion Report in 2014. The 6th Cohesion report will also cover issues such innovation, climate and environment, which could not be included here.
2.1. Contraction of GDP
and employment
The EU entered a recession in the second quarter of 2008, which lasted five quarters. Since the recession, overall growth in terms of GDP has been sluggish. The EU’s GDP contracted again in the last quarter of 2011 and the first two and the last quarter of 2012. If GDP also contracts in the first quarter of 2013 it will have become a triple-dip recession.
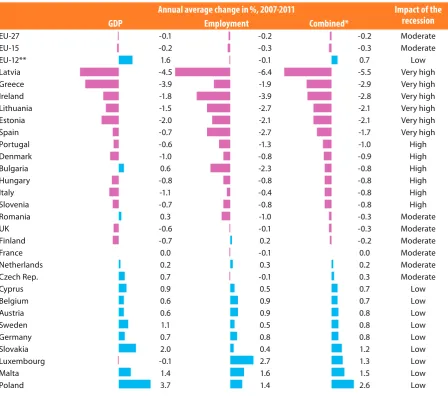
The overall impact of the crisis on GDP and employment between 2007 and 2011 has been highest in the three Baltic States, Ireland, Greece and Spain (see Annex Figure 1). The Baltic States and Ireland started growing again in 2010 or 2011 and are forecast to continue to grow until 2014.
Spain and Greece, however, have not returned to a consist-ent growth path. Spain started growing in 2011, but its GDP contracted in 2012. Provisional GDP growth rates for Greece show a continuation and strengthening of the recession. Its GDP declined by around 7 % in 2011 and 2012 and may only start to grow in 2014.
In addition, Cyprus was confronted with a financial crisis in 2012 which led to a harsh reduction of GDP and employ-ment which is expected to continue until 2014.
In contrast, nine Member States experienced a relatively mild recession or, in the case of Poland, merely a slowing down of growth.
2.2. Deteriorating national
and sub-national finance
The economic and financial crisis has led to significant increases in total government debt (see Factsheet 1) in four ways. First, several national governments supported the financial sector through bank recapitalisation and assets
transfers. Second, the slowing down of economic activity reduced tax receipts and increased social spending (e.g. unemployment benefits). Third, governments adopted stimu-lus packages to boost demand. Fourth, the debt–to–GDP ratio is also driven upwards by low GDP growth.
As a result, the government debt-to-GDP ratio in the EU jumped between the first quarter of 2008 and the fourth quarter of 2012 from 59 % to 85 %. National increases were highest in Ireland (90 percentage points), Portugal (56 pp), Greece and Spain (both 49 pp). Member States that bought out failing banks may be able to reduce their debt by selling the banks remaining assets, but their value remains uncertain.
High government debt can raise concerns about a govern-ment’s ability to service its debt in the long run. This may lead to higher interest rates and payments. The higher taxes required to service the debt may act as a brake on growth.
In the 2011-2013 period, many Member States have embarked on fiscal consolidation by primarily cutting expenditure (-1.5 % of EU GDP in 2011 compared to 2010). Mainly growth-friendly expenditure was cut. Consequently, public invest-ment (here: Gross Fixed Capital Formation) as a share of GDP will be lower in 18 Member States in 2013 than in 2011. These cuts may affect medium-term growth.
Public debt does not affect all countries equally. Estonia’s public debt is only 10 % of its GDP. Only 13 Member States have a public debt below 60 % of their GDP: the three Nordic Member States, Luxembourg and nine of the ten Central and Eastern Member States. The crisis affects sub-national govern-ments in two ways. First, the crisis has led to a decrease of tax revenues and to tax cuts to stimulate growth. Second, the crisis has increased local demand for public services and social protection, triggering higher public expenditure.
Fiscal consolidation is putting pressure on sub-national gov-ernments’ budgets. They still face higher levels of social expenditure and have to reduce expenditure and increase revenues. Their financial difficulties may affect delivery of public services.
Growth-friendly fiscal consolidation should ensure that reductions in central government debt are not offset by an increase in sub-national government debt. This co-ordinated debt reduction should also ensure that growth-enhancing public investments, including those co-financed by Cohesion Policy, are maintained.
2.3. Construction and
manufacturing most
affected by the recession
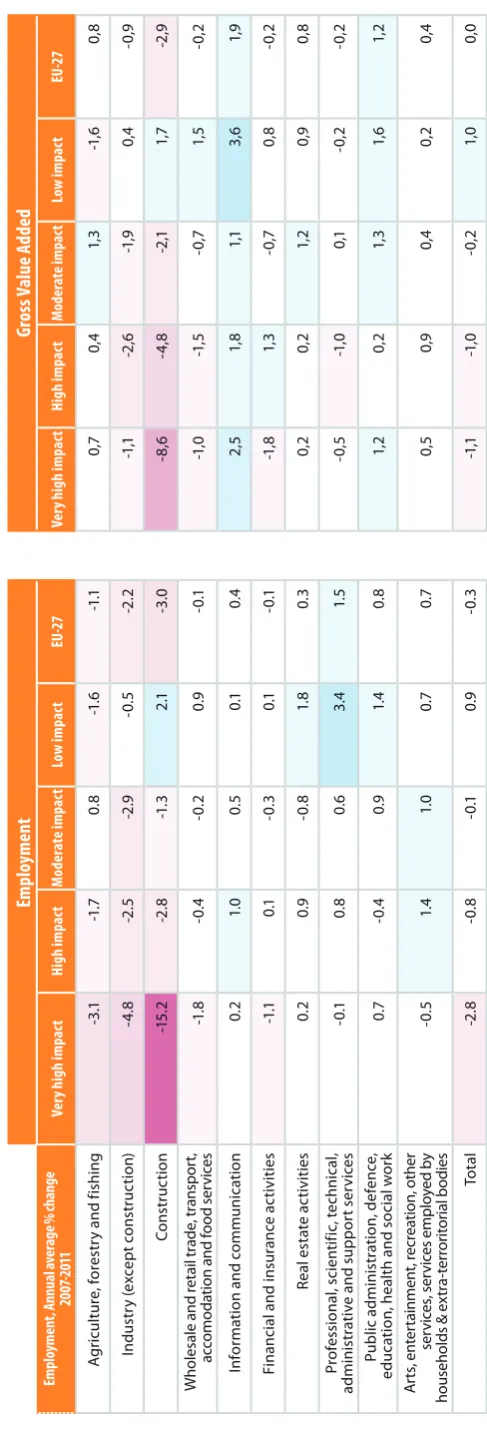
Although the crisis started in the financial and insurance sec-tor, this sector accounted for roughly the same amount of gross value added (GVA) and employment in the EU in 2011 as it did in 2007. In the six Member States most affected by the crisis, however, this sector’s employment dropped by 1 % and its GVA by 1.8 % a year between 2007 and 2011 (see Annex Figure 2).
Between 2007 and 2011, both GVA and employment in con-struction declined by 3 % a year in the Union. In the six coun-tries where the impact of the recession was greatest, the decline was even between 10 and 20 % a year for employ-ment and between 6 % and 20 % for GVA.
These dramatic declines in the construction sector are linked to the real estate bubble and the ensuing collapse of real estate prices in several Member States. Between 2007 and 2012, real estate prices dropped by between 30 % and 50 % in Ireland (1), Latvia and Estonia (see Factsheet 2). In Portugal, they have declined by -9 % so far. In Greece, Eurostat figures indicate moderate increase between 2007 and 2010, but other sources (2) indicate that prices have started to fall since 2010. Overall, more decreases cannot be excluded.
The manufacturing sector took a hit with a decrease of more than 2 % a year between 2007 and 2011. In the six most affected Member State, the annual average contraction was almost 5 %. The decrease in GVA was more moderate at 0.9 %. The changes of GVA were more variable with the biggest reductions over the period occurring in Greece (-6 %) and
Finland (-5 %) and the biggest increases in Slovakia (8 %) and Ireland (4 %) (see Annex Figure 3). The contraction of manu-facturing was closely tied to the contraction in trade.
2.4. Exports recovering
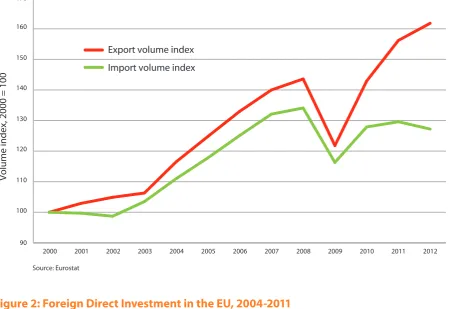
In the wake of the crisis, credit became scarce, which reduced investments and consumption. This reduced trade in goods and caused the recession to spread quickly to important trad-ing partners, leadtrad-ing to further income and/or job losses. Although the 2004 enlargement gave a boost to EU trade, the crisis caused an abrupt drop (see Figure 1).
Exports were still growing in 2008, albeit at a much slower rate, whereas the growth in import volumes was close to zero. In 2009, exports and imports dropped by 15 % to a level com-parable to that of 2005.
The Central and Eastern Member States suffered the highest drop in imports (see Factsheet 3). Most of the countries that joined the EU after 2004 were enjoying a period of high eco-nomic growth fuelled by high investments and consumption, before the crisis hit them.
In western Member States, exports dropped more than imports because, at least initially, domestic consumption and investments were less affected by the crisis. The global drop in demand led to a reduction in exports, causing production to fall in the manufacturing sector. Exports, fortunately, recov-ered quickly with similar volumes in 2010 as in 2007. However, the consequences of the abrupt fall in exports continue to be felt in the labour market.
2.5. Foreign direct investments
slowing down
As a result of the crisis, foreign direct investment (FDI) dropped rapidly. Many foreign investors directed available resources back to ‘mother’ companies. Joining the EU made it easier for the Central and Eastern Member States to access FDI thanks to the single market and the incorporation of the EU acquis. FDI can contribute to efficiency gains, transfer of innovative technologies and higher productivity in the receiv-ing countries. Hence, FDI inflows play an important role in the less developed Member States for employment creation and modernisation of their economies.
1. 2007-2010
Figure 1: Changes in EU trade volume, 2000-2011
Figure 2: Foreign Direct Investment in the EU, 2004-2011
0 2000 4000 6000 8000 10000 12000
0 200 400 600 800 1000 1200
2004 2005 2006 2007 2008 2009 2010 2011
Inward flow from outside the EU
Inward flow from another EU country
EU stocks in billion euro
Cumulative Inward FDI flow in billion euro
EU Stocks owned by non-EU country
EU Stocks owned by another EU country
Source: Eurostat 90
100 110 120 130 140 150 160 170
2000 2001 2002 2003 2004 2005 2006 2007 2008 2009 2010 2011 2012
Volume index, 2000 = 100
Export volume index
Import volume index
[image:9.595.88.549.401.745.2]Foreign direct inward investment flows from other Member States and from outside the Union grew rapidly between 2004 and 2007. Inward investments flows quadrupled between 2004 and 2007 (see Figure 2). Inward investment flows fell in 2008 and 2009 when the global credit situation deteriorated. The lowest point, in 2010, corresponded to the level of 2004. In 2011 the flows grew again.
Foreign direct investment flows do not show the stock of for-eign investment. Stocks held in other countries increased by almost 60 % between 2004 and 2007. This rise was never reversed. By 2011, foreign-owned stocks were more than twice as high than in 2004.
In some EU countries, FDI inflows are a major source of capital and investments. For example, average FDI net inflows as pro-portion of GDP between 2005 and 2007 were between 15 % and 23 % in Bulgaria, Malta, Belgium and Estonia. The crisis led to a rapid reduction of FDI inflows in ten Central and Eastern Member States. It dropped by between 1.5 % and 6 % of their GDP between the periods 2005-07 and 2008-10, with the exception of Bulgaria, where it dropped by 12 % of its GDP (see Factsheet 4).
2.6. Increasing risk of poverty
and exclusion
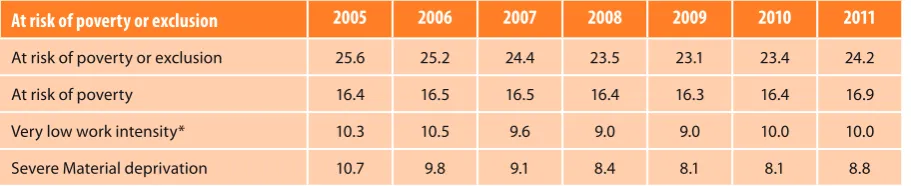
At EU level, the crisis increased the population at risk of pov-erty or social exclusion. Between 2009 and 2011, the share increased by one percentage point. All three components (at-risk-of-poverty rate, severe material deprivation and very low work intensity) are also on the rise, in particular very low work intensity (see Figure 3). This impact is likely to be felt more in the future as the crisis is not over yet and the effect takes time to filter through.
The impact on the risk of poverty or exclusion was the highest in the six most affected Member States, but the impact in Italy and Bulgaria was also significant. Several of the large Member States, however, had only small increases, such as Germany and the UK, or even a slight reduction of the risk of poverty or exclusion, such as Poland and Romania.
In the wake of the crisis, many people were faced with a lower income due to job losses or reductions in hours and wages. In the six most affected MS countries, real gross adjusted disposable income dropped substantially after the crisis (see Figure 4).
In the Baltic States real adjusted disposable household income per capita grew rapidly between 2005 and 2008 and then experienced a sharp drop. In Latvia, disposable income shrank by nearly a fifth in 2009. Since 2010 disposable income has been growing again in all three Member States, but none have reached the pre-crisis level.
In Greece, Spain and Ireland, which have considerably higher levels of disposable income than the Baltic states, the picture is more mixed. In Spain and Ireland, the effect of the crisis only started to be felt in 2009. Since then, both countries have lost around 8 % of their disposable income, returning them to 2005 levels. In Greece, the decline in disposable income started slowly in 2007. In 2009 and 2010 it took a very sharp downturn. As a result, Greek disposable income in 2011 was well below its 2005 level.
[image:10.595.58.514.616.709.2]Due to reductions in the median income, and thus the pov-erty threshold, the at-risk-of-povpov-erty rate often goes down during a recession. This section will use a poverty threshold fixed at the 2005 level to avoid this effect.
Figure 3: Poverty and social exclusion in the EU, 2005-2011
At risk of poverty or exclusion
2005
2006
2007
2008
2009
2010
2011
At risk of poverty or exclusion 25.6 25.2 24.4 23.5 23.1 23.4 24.2
At risk of poverty 16.4 16.5 16.5 16.4 16.3 16.4 16.9
Very low work intensity* 10.3 10.5 9.6 9.0 9.0 10.0 10.0
Severe Material deprivation 10.7 9.8 9.1 8.4 8.1 8.1 8.8
Figure 5: At risk-of-poverty rate with 2005 threshold, 2006-2011
Figure 4: Real gross adjusted disposable household income per head, 2005-2011
80 90 100 110 120 130 140
2005 2006 2007 2008 2009 2010 2011
Real gross adjusted disposable household
income per capita in constant prices, 100 = 2005
R.G.A. Disposable Household
Income in PPS, 2011
EU = 100
Estonia
Greece
Latvia
Ireland
Spain
Lithuania
EE: 55
LT: 64
LV: 51
IE: 98
ES: 95
EL: 80
Source: Eurostat, European Sector accounts
0 5 10 15 20 25
2006 2007 2008 2009 2010 2011
% of total population
Estonia
Greece
Latvia
Ireland
Spain
Lithuania
[image:11.595.89.542.404.716.2]In Ireland, the share of people at risk of poverty relative to the 2005 threshold increased from 10 % in 2008 to over 15 % in 2010 (see Figure 5). This share reached 20 % in Spain and 23 % in Greece. Due to the high income growth of the early part of the 2005 to 2011 period, the at-risk-of-poverty rates relative to the 2005 threshold only grew slightly post-crisis in the Baltic States, reaching 10 % or less, and did not reach the pre-crisis levels.
The share of people at risk of poverty relative to the 2005 threshold increased slightly in Belgium, Hungary, Germany, Luxembourg, the Netherlands and the UK. In the remaining parts of the EU, it declined or remained stable.
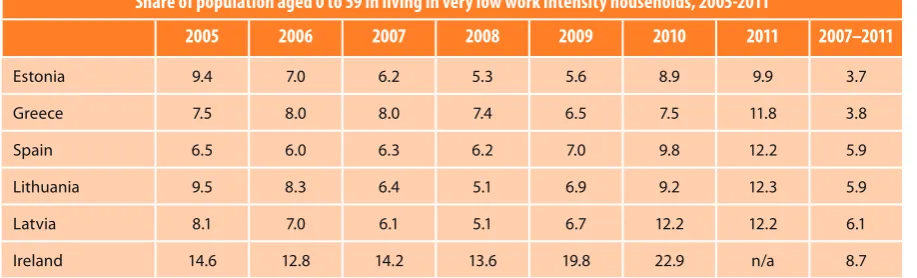
[image:12.595.57.516.416.555.2]The share of population aged 0 to 59 living in a household with a very-low-work intensity increased post crisis, but still remained below 2006 values at the EU level. In the six most affected Member States, however, this share has increased with between 4 and 9 pp between 2007 and 2011 (see Figure 6).
Figure 6: Very low work intensity, 2005-2011
The share of severely materially deprived population, i.e. those unable to afford 4 out of 9 basic items, decreased at the EU level from 11 % to 8 % between 2005 and 2010. The highest shares can be found in Romania and Bulgaria and both man-aged to reduce the share of severe materially deprived popu-lation to 31 % and 35 % in 2010. In 2011, however, the EU share increased again.
Between 2008 and 2011, severe material deprivation increased most in Latvia (3) (12 pp), Lithuania (6pp), Hungary (5pp) and Greece (4pp). In 2010, Ireland’s share increased by 2 pp to 7.5 %, which is high given its income levels. Spain, with a slightly lower income level, only had a rate of 4 %. Poland achieved a remarkable reduction of its share of severely mate-rially deprived persons, from 18 % in 2008 to 13 % in 2011.
For a more detailed analysis of changes in poverty and social exclusion, including poverty depth, see Chapter 2 of the Employment and Social Developments in Europe 2012 Report (4).
Share of population aged 0 to 59 in living in very low work intensity households, 2005-2011
2005
2006
2007
2008
2009
2010
2011
2007–2011
Estonia 9.4 7.0 6.2 5.3 5.6 8.9 9.9 3.7
Greece 7.5 8.0 8.0 7.4 6.5 7.5 11.8 3.8
Spain 6.5 6.0 6.3 6.2 7.0 9.8 12.2 5.9
Lithuania 9.5 8.3 6.4 5.1 6.9 9.2 12.3 5.9
Latvia 8.1 7.0 6.1 5.1 6.7 12.2 12.2 6.1
Ireland 14.6 12.8 14.2 13.6 19.8 22.9 n/a 8.7
Source: Eurostat
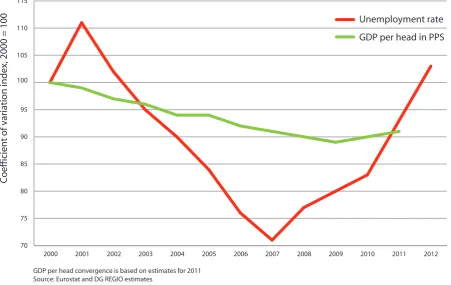
The crisis brought to an end a long period during which regional disparities in GDP per head and unemployment were shrinking. Between 2000 and 2008, regional disparities in GDP per head dropped every single year (see Figure 7). In 2009, those reductions came to a halt and grew in 2010 and 2011.
Figure 7: Regional convergence and the crisis
Regional unemployment rates had been converging from 2001 to 2007, but then increased every year from 2007 until 2012. The EU-15 have also witnessed increasing disparities since 2007 for both GDP per head and regional unemployment.
3.1. GDP and employment in the
first three years of the crisis
Two thirds of the regions suffered a contraction of GDP of up to -6 % a year between 2007 and 2010. The ten regions where GDP shrank fastest between 2007 and 2010 include the three Baltic States and seven regions from seven different Member States (See Factsheet 5). GDP shrank by more than 3 % a year in these regions. None of the Spanish or Greek regions appear among these regions. Spain does not appear in the top ten because it suffered a smaller GDP reduction than employ-ment reduction. Greece does not appear in the top ten because most of the GDP contractions occurred after 2010. In 2012, Cyprus saw the start of a contraction in employment and GDP which is expected to continue into 2014.
In several Member States, the capital region has the highest growth rate, including Bulgaria, Germany, Slovakia, and Poland.
One out of two regions saw its total employment shrink over the same period. Employment dropped by more than 4 % a year in the Baltic States, three Spanish regions, the two Irish regions and one region in Bulgaria (see Factsheet 5). The con-traction in Greek employment happened only after 2010, which is why they do not appear among the worst affected regions.
Overall, the link between regional GDP and employment change is weak during these years, as it takes time for reduc-tions in output to affect employment. In addition, several policies were aimed directly at maintaining (part-time) employ-ment during the crisis.
3.2. Unemployment increasing
especially in southern
regions
At EU level, unemployment rates increased from 7 % to 10 % between 2008 and 2012. Unemployment rates in the most affected Member States, however, doubled or even tripled with increases above 8 pp in five Member States and up to 17 pp in Spain (see Factsheet 6). Unemployment rates, in the five most affected Member States for this indicator, ranged from 12 % in Cyprus to 25 % in Spain (5).
Unemployment increased significantly also in Latvia, Estonia, Slovenia, Slovakia and Denmark. On the other hand, unem-ployment rates actually dropped in Germany and barely changed in Luxembourg, Malta, Belgium and Austria.
Overall, more than four out of five EU regions were faced with an increase between 2008 and 2010. Most saw the biggest increase in this period. More than one third of these regions have managed to reduce unemployment since 2010.
In line with the recommendations in the European Economic Recovery Plan, several Member States set up measures to prevent excessive labour shedding, and to increasing the coverage and duration of benefits.
Youth unemployment increased from 16 % in 2008 to 21 % in 2011 at the EU level (see Factsheet 7). In 52 regions, one out of three economically active young people were unem-ployed. In 11 of those regions it was even one out of two, mostly in Spain and Greece. Also the share of people aged 15 to 24 not in employment, education or training (NEET) has risen: between 2008 and 2011 NEET rates increased in almost four out of five regions, especially in Romania, Greece and the UK (See Factsheet 8).
3
The regional impact
3.3. Migration slowing down
Between 2004 and 2008, the number of residents living out-side their country of citizenship in the EU-27 increased by 1.5 million a year. As a result, the corresponding proportion of the total EU-27 population grew from 5.1 % to 6.2 %. For the years 2009 to 2011, the annual increase dropped to 0.9 million, leading to a share of 6.7 % in 2011.
Between 2004 and 2008, Ireland, Spain, and Cyprus wit-nessed an increase of their share of foreign population of over 4 pp, mostly from the Member States who joined in 2004 or 2007. Over that period, Italy, Portugal, Luxemburg and the UK also experienced a substantial increase of the share of foreign citizens.
The biggest effect of the crisis on migration was in regions that experienced largest inflows of labour migrants in the pre-crisis period. The slowdown in migration was strongest
in Spain, Ireland, Cyprus and some regions of the UK and Italy (see Factsheet 9), but remained positive. Many regions of Spain, southern France and northern Italy still had some of the highest levels of positive net migration.
The crisis accelerated emigration in Lithuania and Latvia. In Poland, negative net migration became less negative in the border regions and positive net migration of the capital region increased. The negative net migration was shrunk in Romania due to return migration from Spain. As the crisis continues to unfold, the increasing differences in regional unemployment rates and wages may still further affect migration.
[image:14.595.62.514.416.701.2]The rapid decline of employment in construction and indus-try contributed to the decline in net migration in Spanish regions and in Northern Italy. Net-migration tended to drop more in regions with a high share of migrants from other Member States.
Figure 7: Regional convergence and the crisis
70 75 80 85 90 95 100 105 110 115
2000 2001 2002 2003 2004 2005 2006 2007 2008 2009 2010 2011 2012
Coefficient of variation index, 2000 = 100
Unemployment rate
GDP per head in PPS
4
The urban impact
To analyse the urban impact, this report uses two spatial approaches: metro regions and cities.
(1) Metro regions are NUTS-3 regions that represent urban agglomerations of more than 250 000 inhabitants. This approach allows an urban interpretation of GDP and employment changes.
(2) Cities are defined at the national level and capture the main cities in the EU. This approach provides access to data on employment and poverty.
4.1. Metro regions mix resilience
and vulnerability
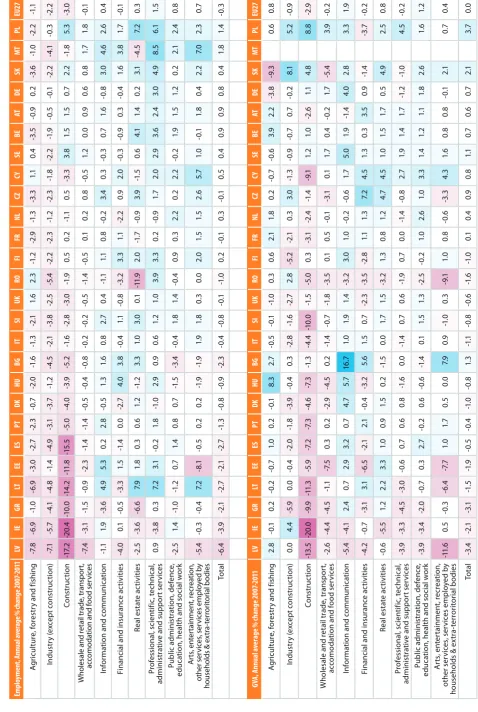
In two out of three Member States (6), metro regions on aver-age increased their GDP per head in PPS relative to the coun-try as a whole between 2007 and 2010 (see Annex Figure 4). In the twelve Member States that increased their GDP per head relative to the EU, their metro regions outperformed the rest of the country. In eight of the twelve Member States that had a decline in GDP per head relative to the EU, GDP per head in metro regions declined faster than in the country as a whole.
This pattern of faster GDP growth in growing economies and faster decline in most declining economies could mean that urban economies are more volatile and succeptible to booms and busts.
Despite the strong overall performance of metro regions, over three out of five saw their GDP per head drop between 2007 and 2010 relative to the national level. Smaller metros lost most ground with 74 % of them declining relative their coun-try. Also second-tier metros suffered with 54 % losing ground. Only capital metro showed a stronger performance with only 30 % losing ground.
In most Member States, employment (7) in metro regions was more resistant to the crisis than in non-metro regions between 2007 and 2010 (see Annex Figure 5). Only in Finland, Greece, Hungary and Latvia did employment in non-metro regions decline more slowly than in metro regions.
Similar to GDP per head changes, not all metro regions expe-rienced stronger employment change than their country. Only half of the metro regions experienced a milder employ-ment decline (or faster employemploy-ment growth) than the non-metro regions in their country. Slightly more than half the second-tier metros outpaced their country. Slightly less than half of the smaller metros performed better than their coun-try. Capital metros performed much better: nine out of ten had with a stronger employment performance. Nine capital metros even achieved employment growth despite a decline in national employment.
In the UK and Spain roughly half of the metro regions had a worse employment performance than the non-metro regions. In Greece and Hungary almost all metro regions per-formed worse. In the majority of the Member States, however, all or most metro regions had a better employment perfor-mance than the non-metro regions. This was particularly evi-dent in Poland, Slovakia, the Czech Republic, Romania and Bulgaria.
In these first three years of the crisis, most metro regions showed themselves to be resilient, especially the capital city metro regions. The second-tier metros performed less well. The smaller metros proved quite vulnerable with the majority lagging behind in terms of GDP per head and employment changes.
4.2. Cities in crisis
Poverty and social exclusion are concentrated in cities, espe-cially in North-western Europe. The crisis has further intensified this concentration. The at-risk-of-poverty-or-social-exclusion (AROPE) rate increased by 1 pp in cities in the EU, compared to an increase of 0.5 pp outside cities (see Figure 8).
In 2011, people living in cities in the EU-15 were at greater risk of poverty or social exclusion than those living outside cities (see Figure 9). Also the three components of this risk are higher in cities than outside. In the EU-12, the situation tends to be the opposite. People living in cities have a considerably lower risk of poverty or social exclusion.
Figure 8: Change in the risk of poverty
or social exclusion, 2008-2011
EU27
AROPE
AROP
LWI
SMD
Cities 1.0 0.6 0.9 0.5
Other areas 0.5 0.5 1.1 0.3
EU15
Cities 1.2 0.6 1.2 0.7
Other areas 0.9 0.3 1.4 0.9
EU12
Cities -0.4 0.3 -0.3 -0.7
Other areas -1.0 0.8 0.3 -1.5
Source: Eurostat
Severe material deprivation is higher in cities in 18 Member States. Very low work intensity is more prevalent in cities in 15 Member States (see Factsheet 10). The poverty risk is higher in cities in 10 Member States.
The high share of very low work intensity households in cities with their high concentration of jobs is somewhat paradoxi-cal. This may be due to skills mismatch, precarious jobs or the higher share of one-person households in cities. It may also be related to the higher proportion of residents born outside the EU in cities.
In 11 of the EU-15 Member States (8), people born outside the EU were much more likely to live in a household with a very low work intensity. In 2010, the very low work intensity rate of those not born in the EU was at least six pp higher than for people born in the country they are living in. Many non-EU born persons face multiple barriers to entering the labour market, such as not speaking the local language, lack of skills, lack of recognition of their qualifications and discrimination.
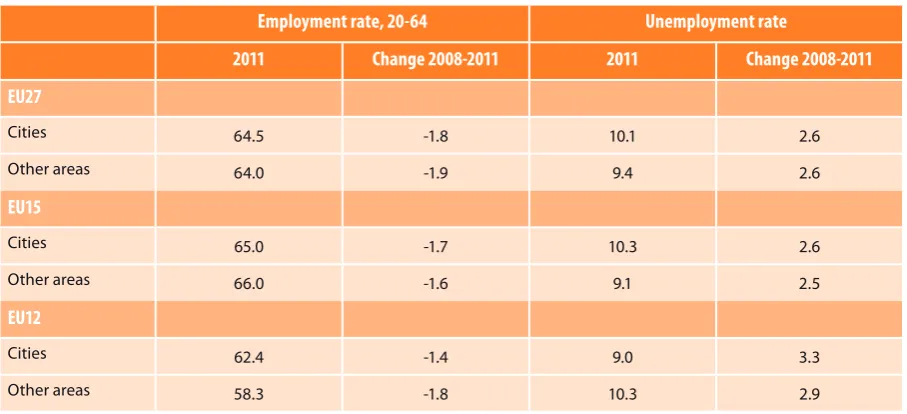
[image:16.595.291.495.322.466.2]As with poverty and social exclusion, cities in the more devel-oped Member States tend to have lower employment rates and higher unemployment rates than towns, suburbs and rural areas (see Figure 10), while the opposite is the case in less devel-oped Member States. The crisis has not altered this pattern.
Figure 9: Risk of poverty or social
exclusion in cities, 2011
EU27
AROPE
AROP
LWI
SMD
Cities 23.3 15.7 11.0 8.4
Other areas 25.0 18.0 9.1 9.2
EU15
Cities 23.1 16.8 12.0 6.8
Other areas 21.9 16.6 9.2 5.3
EU12
Cities 24.1 9.9 6.5 16.5
Other areas 34.5 22.2 8.9 20.8
Source: Eurostat
Figure 10: Employment and unemployment in cities and other areas, 2008-2011
Employment rate, 20-64
Unemployment rate
2011
Change 2008-2011
2011
Change 2008-2011
EU27
Cities 64.5 -1.8 10.1 2.6
Other areas 64.0 -1.9 9.4 2.6
EU15
Cities 65.0 -1.7 10.3 2.6
Other areas 66.0 -1.6 9.1 2.5
EU12
Cities 62.4 -1.4 9.0 3.3
Other areas 58.3 -1.8 10.3 2.9
[image:16.595.58.512.523.730.2]This report outlines a few of the key issues that cohesion pro-grammes should consider for 2014-20 period.
The crisis has made it more difficult to reach the Europe 2020 goals due to reduced employment rates and increasing pov-erty and social exclusion. Moreover, widening regional dis-parities are undermining one of the key goals of the European Union and Cohesion Policy.
Although some Member States, such as Germany and Poland, have escaped the crisis relatively unscathed, most will face more problems and fewer public resources. These include, for many if not most Member States:
• GDP and employment levels which have not
yet returned to pre-crisis levels.
• Higher levels of unemployment, poverty and exclusion.
• Reduced household income, which depresses
consumption and imports.
• Unprecedented levels of public debt and the need for fiscal consolidation.
The report shows that the intensity of problems varies signifi-cantly throughout Europe. This suggests that the design of future cohesion programmes should reflect these differences to maximise impact and target problems where they are more acute.
Against this background, the future cohesion programmes will have to put particular emphasis on growth-enhancing and job creating-investments. Only a stable and strong recov-ery can reduce the unemployment rates.
This is why the Commission is proposing to concentrate resources on a few, important areas such as employment (particularly for young people), training and education, social inclusion, innovation and SMEs, energy efficiency and a low-carbon economy and is open to expand it to ICT infrastruc-tures and digital growth measures
5
Cohesion policy and the crisis
Exports and foreign direct investment constitute a major engine of growth in less developed Member States, help-ing to create jobs and transferrhelp-ing knowledge and technol-ogy. SMEs, one of the main target groups of Cohesion Policy, are particularly affected by the deteriorating the business environment. In a context of low internal demand, export-ing more goods and services will help to revive growth. Investments in innovation and smart specialisation could improve the performance of this sector.
The construction sector will continue to suffer from the con-sequences of the banking crisis, owing to limited access to credit, the bursting of the housing bubble, and the reduced disposable household income and income security. Investing in energy efficiency of buildings could help to restore some of the jobs lost in this sector.
The risk of poverty or exclusion increased at EU level and may continue to rise due to the delayed impact of the crisis on poverty and exclusion.
Annual average change in %, 2007-2011
Impact of the
recession
GDP
Employment
Combined*
EU-27 -0.1 -0.2 -0.2 Moderate
EU-15 -0.2 -0.3 -0.3 Moderate
EU-12** 1.6 -0.1 0.7 Low
Latvia -4.5 -6.4 -5.5 Very high
Greece -3.9 -1.9 -2.9 Very high
Ireland -1.8 -3.9 -2.8 Very high
Lithuania -1.5 -2.7 -2.1 Very high
Estonia -2.0 -2.1 -2.1 Very high
Spain -0.7 -2.7 -1.7 Very high
Portugal -0.6 -1.3 -1.0 High
Denmark -1.0 -0.8 -0.9 High
Bulgaria 0.6 -2.3 -0.8 High
Hungary -0.8 -0.8 -0.8 High
Italy -1.1 -0.4 -0.8 High
Slovenia -0.7 -0.8 -0.8 High
Romania 0.3 -1.0 -0.3 Moderate
UK -0.6 -0.1 -0.3 Moderate
Finland -0.7 0.2 -0.2 Moderate
France 0.0 -0.1 0.0 Moderate
Netherlands 0.2 0.3 0.2 Moderate
Czech Rep. 0.7 -0.1 0.3 Moderate
Cyprus 0.9 0.5 0.7 Low
Belgium 0.6 0.9 0.7 Low
Austria 0.6 0.9 0.8 Low
Sweden 1.1 0.5 0.8 Low
Germany 0.7 0.8 0.8 Low
Slovakia 2.0 0.4 1.2 Low
Luxembourg -0.1 2.7 1.3 Low
Malta 1.4 1.6 1.5 Low
Poland 3.7 1.4 2.6 Low
[image:19.595.86.535.166.562.2]* Average of change in GDP and change in employment ** EU-12 are the Member States that joined in 2004 and 2007 Source: Eurostat
Figure 1: Member States grouped by impact of recession, 2007-2011
Fi
g
u
re 4
: C
h
an
g
e i
n G
DP p
er h
ea
d i
n
d
ex (
PP
S) i
n me
tr
o r
eg
io
n
s, 2
00
7-20
[image:22.595.71.526.108.725.2]Annexes
Fi
g
u
re 5
: C
h
an
g
e i
n e
m
p
lo
yme
n
t i
n me
tr
o r
eg
io
n
s, 2
00
7-20
[image:23.595.135.507.133.718.2]The general government debt is defined as the consolidated gross debt of the whole of the general government sector outstanding at the end of the quarter (at nominal value). The general government sector comprises central government, state government, local government, and social security funds. The debt is measured as a percentage of GDP.
Why does this matter?
The Maastricht Treaty specifies government debt must not exceed 60 % of GDP unless it is sufficiently diminishing and approaching 60 % at a satisfactory pace. Unsustainable levels of public debt undermine macro-economic stability, increase government spending interests and the higher taxes required to service the debt may act as a drag on growth.
How do the EU Member States score?
Government debt-to-GDP ratios increased drastically over the 2008-2012 period in both the euro area (24.9 percentage points) and in the EU-27 (26.2 p.p.), sustained by government budget deficits (negative primary balances), increasing inter-est payments and lower nominal GDP growth. During the crisis, the total debt-to-GDP ratio of EU-27 registered a nega-tive trend, peaking at 85.2 % in the last quarter of 2012 (latest available data).
The highest ratios of government debt to GDP are recorded in Greece (156.9 %), Italy (127.0 %) and Portugal (123.6 %). The total government debt is higher than the annual GDP also in Ireland, and close to this level in Belgium. The lowest ratios, instead, are registered in Estonia (10.1 %), Bulgaria (18.5 %) and Luxembourg (20.8 %). The values of the last quarter of 2012 represent a peak (since 2000) for eleven countries, including Germany, Portugal, Netherlands and the UK. Greece, instead, peaked (170.3 %) in the fourth quarter of 2011 and decrease is mainly due to the exchange of bonds. Also Hungary (79.2 %) improved its situation compared to the peak recorded in the second quarter of 2010 (85.3 %).
The highest increases between 2008 and 2012 are registered in Ireland, where the ratio increased by a staggering 90.0 per-centage points, Portugal (56.1) and Greece (49.0).
The debt to GDP ratio increased in all EU-27 countries, although Sweden (+0.2 p.p.), Bulgaria (+3.1 p.p.) and Estonia (+6.0 p.p.), starting from a very low base) registered a mild increase.
This table shows the five countries with the highest government debt-to-GDP ratio
Country
General Government Gross Debt,
fourth quarter 2012
Greece 156.9
Italy 127.0
Portugal 123.6
Ireland 117.6
Belgium 99.6
This table shows the five countries with the biggest increase of government debt-to-GDP ratio
Country
General Government Gross Debt, first
quarter 2008 - fourth quarter 2012
Ireland 90.0
Portugal 56.1
Greece 49.0
Spain 48.6
UK 46.7
Annexes
General government debt in % of GDP, 2012
Change in debt as a share of GDP, 2008-2012
0
20
40
60
80
100
120
140
160
Ireland Por tugal
Gr eec e
Spain ed K Unit ingdom Cyprus La tvia Slo venia
Lithuania Romania Slo vak ia Nether
lands Franc e
Italy Finland Cz
ech R epublic
Denmar k Ger
man y embour Lux g
Poland Malta
Belg ium
Austr
ia Hungar
y Est onia
Bulgar ia Sw
eden EU-27
2012 fourth quarter
Change in debt as % of GDP
Sour
ce: E
ur
osta
t
0
20
40
60
80
100
120
140
160
G
en
er
al
G
ov
er
n
m
en
t D
eb
2. House Price Index (HPI)
House Price Indices (HPIs) measure inflation in the residential property market. The HPI captures price changes of all kinds of residential property purchased by households (flats, detached houses, terraced houses, etc.), both new and exist-ing. Only market prices are considered, self-build dwellings are therefore excluded. The land component of the residen-tial property is included.
Why does this matter?
Rapid increases in housing prices reduce the affordability of housing, especially for first-time buyers. Rapid reductions in housing prices lead to mortgages which are higher than the current value of the house, so-called negative equity. These reductions also lead to fewer transactions on the housing market, with effects on mobility of workers.
How do the EU Member States score?
Housing market bubbles have been one of the main macro-economic imbalances leading to the current macro-economic crisis. Household indebtedness is closely linked with housing mar-ket developments: growth in credit to households, house price increases and high residential investment went hand in hand during the decade preceding the crisis, leading to higher indebtedness of the private sector. While the length and the speed of this expansion has shown significant vari-ations across countries, house prices peaked in a vast major-ity of Member States in 2007/2008 (1), ending a particularly pronounced price cycle across the EU. In 2006-2007, half of the Member States where data is available recorded price increases above 6 %/year, a threshold considered as an alert of internal imbalances (2).
Taking into account the 2007-2012 period, house prices con-tracted considerably in Ireland (-49.5 %, until 2010), Latvia (-35.7 %) and Estonia (-30.2 %). In Ireland house prices in 2010 were significantly lower than in 2005. A substantial decrease between 2007 and 2012 was also registered Spain (-28.0 %), and Romania (-26.1 %, 2010-2012).
Between 2007 and 2012, house prices kept on increasing considerably in Sweden (+16.3 %), Luxembourg (+15.1 %), Finland (+14.8 %) and Belgium (+14.0 %), and at a slower pace in Malta (+8.2 %), Germany (+6.8 %) and France (+4.5 %).
This table shows the five countries with the highest drop of house prices
Country
House Price Index, 2007-2012
Ireland (2007-2010) -49.5
Latvia -35.7
Estonia -30.2
Spain -28.0
Romania (2009-2012) -26.1
Annexes
Total change in %
-50
-40
-30
-20
-10
0
10
20
Ireland ** La tvia Est onia
Spain Romania * Lithuania
Denmar k **
Bulgar ia *
Hungar y Nether
lands Por tugal *
Slo venia
Cyprus ** Cz ech R epublic
Slo vak ia Austr
ia * ** Italy * ed K Unit
ingdom Gr eec e **
Franc e man Ger
y ** Malta
Belg ium *
Finland Lux embour g
Sw eden
EU-27
* Diff
er
en
t star
ting y
ear
: BG & PT
: 2008, R
O
, A
T & BE: 2009, IT
: 2010
** Diff
er
en
t ending y
ear
: C
Y & IE: 2010, DE
, A
T & DK
: 2011
Sour
ce: E
ur
osta
t
H
o
us
e p
ri
ce i
n
d
ex
, 2
00
7-20
3. Trade in Goods, 2008-2009
International trade refers to selling (exports) or buying (imports) of goods and services along international borders. The analysis is based on the trade volume index. It accounts, simultaneously, for change in prices and in volumes of export and import; therefore it is a suitable indicator of change over time.
Why does this matter?
Through export, countries can expand their market, which is important in particular for countries with small domestic markets. Imports can increase competition on the domestic market and improve the choice of goods and services avail-able to consumers, at lower prices. A positive balance of exports and imports (trade surplus) contributes to GDP growth. A negative balance (trade deficit) lowers GDP.
How do the EU countries score?
As the crisis spread across the economies, people started to consume less and firms started to buy less intermediate goods. This led to a serious contraction in both, exports and imports of goods and services, worldwide.
In the EU, the Central and Eastern countries, suffered the highest drop in imports. The countries in the table saw their imports falling by a nearly a quarter in Bulgaria to nearly a third in Latvia, in just one year. Most of the countries that joined the EU after 2004 were enjoying a period of high eco-nomic growth fuelled by high investments and high con-sumption, before the crisis hit them. At the same time, imports grew significantly. The crisis brought this develop-ment to a halt during at least two years (2008-2010) before imports started to grow again.
The effect of the crisis on trade in the less developed MS was higher on imports, whereas the import of intermediate products, which will be transformed and exported again, is likely to increase apace with the exports. Imports of final consumption goods will only grow when disposable house-hold income starts to grow again.
The four of the five countries with a reduction in exports of 18 % or more (see table) have a GDP per head above the EU average. In general, the decline in trade was associated mainly with falling exports in the more developed MS, indi-cating that the consumption of final goods did not drop as quickly as in the less developed MS.
In general, imports fell faster than exports and took also longer to recover. By 2011 most of the EU countries reached or nearly reached their trade volumes from the pre-crisis period. However, the consequence of such abrupt fall in con-sumption and production, for their labour market will take much longer to recover.
This table shows the five countries with the highest reduction in the import volume index from 2008 to 2009, in %
Country
Imports, 2008-2009
Latvia -28.8
Lithuania -27.0
Romania -26.4
Estonia -25.1
Bulgaria -23.9
This table shows the five countries with the highest reduction in the export volume index from 2008 to 2009, in %
Country
Exports, 2008-2009
Finland -26.1
Sweden -19.6
Italy -18.8
Austria -18.4
Annexes
Change in volume index in %, 2008-2009
-30
-25
-20
-15
-10
-5
0
EU Malta Lux
embour g Belg
ium Nether lands
Ger man y Por
tugal Gr eec e
Franc e Slo vak ia
Austr ia
Cyprus ed K Unit ingdom Italy
Poland Ireland Denmar k
Cz ech R epublic
Slo venia
Sw eden Spain Hungar y Finland
Bulgar ia
Est onia
Romania Lithuania La tvia
Import
Export
C
h
ange
in
Imp
or
ts
a
nd
E
xp
or
ts
, 2
00
8-20
4. Foreign Direct Investments
Foreign direct investment is an investment made by a com-pany or entity based in one country, into a comcom-pany or entity based in another country in order to acquire a lasting interest (10 percent or more of voting stock). The difference in inward and outward FDI is called FDI balance. It is usually expressed with relation to a country’s GDP.
Why does this matter?
A negative FDI balance means that a country receives more investment from abroad than it sends abroad. As a result, a negative FDI balance leads to higher private investments. This will boost the economic activity in a country. In addi-tion, it can contribute to efficiency gains, transfer of innova-tive technologies and higher productivity.
How do EU countries score?
The table shows the countries with the where net inflows were much higher than net outflow as a share of GDP. Most of them are relatively small and open economies with skilled workforce. With the exception of Belgium, they are all Member States with GDP per head (well) below the EU average.
Joining the EU may have contributed to increase of FDI in sev-eral of the Central and Eastern Member States due to the access to the single market and the incorporation of the EU acquis into national legislation.
Foreign direct investment dropped rapidly in 2008 and 2009 as global credit conditions started to deteriorate. The fall was more substantial for inflows than outflows of FDI, which led to significantly lower investments in the main recipient of FDI in the EU.
Bulgaria experienced the biggest reduction in inward FDI as share of GDP (-12 pp). Nevertheless, it still is one of the main destinations for investors in the EU. This is also the case for Malta.
Among the ten Member States with the biggest drop in inward FDI, there are four Western MS. This is not so surprising for small, open economies such as Luxembourg, Denmark and the Netherlands, but it also includes the large economy of the UK, where it dropped by 4 pp.
In 2011, FDI flows showed strong signs of a recovery. Both flows from one EU country to another and from the outside the EU into the EU increased substantially compared to 2010.
This table shows the countries with the highest negative net FDI balance as a share of GDP in 2008-10,
i.e. the biggest net recipients of FDI
Country
Net FDI Balance, 2008-10
Bulgaria -9.7
Malta -9.1
Romania -3.8
Estonia -3.8
Belgium -3.6
Cyprus -2.8
Portugal -2.0
Latvia -1.7
Lithuania -1.6
Poland -1.6
This table shows the countries with biggest reduction of inward FDI as a share of GDP from 2005-07 to 2008-10, in pp
Country
Difference in inward FDI,
2005-07 to 2008-10
Bulgaria -11.9
Netherlands -6.9
Malta -6.7
Luxembourg -6.4
Estonia -6.3
Latvia -5.0
Slovakia -4.2
United Kingdom -3.9
Czech Republic -3.6
Annexes
Difference in outflow Difference in inflow
Outflow Inflow
Change in volume index in %, 2008-2009
Difference in % points average 2005-07 to 2008-2010
EU Denmar k
Italy Gr eec e Finland
Ger man y Slo
venia Nether
lands Por tugal
Franc e Austr ia Slo vak ia
La tvia Lithuania Hungar y
Spain ech R Cz epublic Poland Unit
ed K ingdom Sw eden
Romania Ireland Cyprus Est onia
Bulgar ia
Malta Belg ium Lux
embour g
20 15 10 5 0 -5 -10 -15
Fo
re
ig
n D
ir
ec
t In
ve
st
me
n
t, 2
00
5-20
5. Change in GDP and Employment,
2007-2010
These two indicators measure the average annual change in GDP and employment between 2007 and 2010, i.e. the average growth in 2008, 2009 and 2010.
Why does this matter?
Reductions in GDP lead to lower incomes and reduce gov-ernment revenues. Reductions in employment increase unemployment and demands for unemployment benefits.
How do the EU regions score?
Two out of three EU regions suffered a contraction of their GDP between 2007 and 2010.
The ten regions where GDP shrunk fastest include the three Baltic States and one of the two Irish regions. It does not include a Spanish region as they suffered more from employment than GDP losses.
For Greece no regional growth figures are available. The country’s GDP shrunk by -2.5 % a year over that period and the contraction of GDP was even harsher after 2010.
The growing regions are mainly located in Poland, Germany, Sweden, Slovakia and the Czech Republic.
More than one out of two regions suffered a reduction of employment between 2007 and 2010. Employment reductions were particularly high in Spain, Ireland and the Baltic States. In Greece, employment only shrunk by 0.7 % between 2007 and 2010 and lost far more employment in 2011 and 2012.
Bulgaria and Romania both have regions which saw big declines in employment. National level data shows that employment continued to decline in 2011, but Romania managed return to growth in 2012.
The regions with employment growth were mainly located in Poland, Germany, Austria, Belgium and Luxembourg.
This table shows the ten regions where GDP shrunk fastest between 2007 and 2010, in % average annual change
MS
Region
GDP growth 2007-2010, %
LV Latvija -6.2
EE Eesti -4.8
HU Észak-Magyarország -4.0
FI Etelä-Suomi -3.7
LT Lietuva -3.5
HU Közép-Dunántúl -2.8
IT Molise -2.0
DK Sjælland -1.7
BG Severozapaden -1.6
IE Border, Midland & Western -1.6
This table shows the ten regions where employment shrunk fastest between 2007 and 2010, in % average annual change
MS
Region
Employment growth
2007-2010, %
BG Severozapaden -6.2
LV Latvija -5.9
IE Border, Midland & Western -5.2
EE Eesti -5.0
ES Comunidad Valenciana -4.7
ES Cantabria -4.5
IE Southern & Eastern -4.3
LT Lietuva -4.2
ES Comunidad Foral de Navarra
-4.0
ES Ciudad Autónoma de Melilla
6. Unemployment, 2012
This indicator measures the number of people aged 15-74 who are without work but looking for work and available for work, divided by the number of people aged 15-74 and active in the labour market, i.e. those employed and unemployed.
Why does this matter?
High unemployment is a threat to social cohesion leading to poverty and social exclusion and it is one of the most important incentives for people to leave their regions.
How do the EU regions score?
Regional disparities in unemployment among the EU-27 regions remain high. More than one region in three has an unemployment rate above 10 %. The highest rates are reg-istered in Spain, Greece and in the overseas departments of France. In the top-30 regions in terms of unemployment, 29 are located in these three countries.
The regions recording unemployment rates above 15 % are almost one out of five (one out of ten in 2010). In contrast, about one region out of six registers unemployment rates below 5 % (a total of 45, an increase from the 41 regions in 2011). These regions are mainly located in Austria, Germany, Belgium and Netherlands.
It is possible to identify different trends for the period 2008-2012. Between 2008 and 2012 unemployment increased in four out of five regions. The crisis hit severely regions of Spain, Greece, Ireland and the Baltic States. Instead, unem-ployment dropped almost exclusively in German regions, especially in Eastern Landers (also due to labour mobility).
One in three regions saw increases until 2010 and have shown some resilience since then. These regions are located in particular in Belgium, Czech Republic, Slovakia, Austria, Sweden and the UK.
This table shows the ten regions the highest unemployment rates in 2012
MS
Region
GDP growth 2007-2010, %
ES Ciudad Autónoma de Ceuta 38.5
ES Andalucía 34.6
ES Extremadura 33.0
ES Canarias 33.0
EL Dytiki Makedonia 29.9
ES Melilla 28.6
FR Réunion 28.6
ES Castilla-La Mancha 28.5
ES Región de Murcia 27.9
EL Sterea Ellada 27.8
This table shows the ten regions with the biggest increase in unemployment rate in pp
MS
Region
Employment growth
2007-2010, %
ES Ceuta 21.2
EL Sterea Ellada 19.3
EL Attiki 18.9
ES Extremadura 17.8
EL Kentriki Makedonia 17.7
EL Dytiki Makedonia 17.4
ES Castilla-La Mancha 16.9
ES Andalucía 16.8
EL Voreio Aigaio 16.7
7. Youth Unemployment, 2012
This indicator divides the number of people aged 15-24 who are without work but looking for work and available for work, by the number of people aged 15-24 and active in the labour market, i.e. those employed and unemployed.
Why does this matter?
Unemployment at a young age can have a long-lasting neg-ative impact, a ‘scarring effect’. In addition to higher risks of future unemployment, lower wages, these young people are also at a higher risk of social exclusion, of poverty and of facing health problems. High unemployment is one of the main drivers for young people to leave their regions.
How do the EU regions score?
Regional disparities in youth unemployment rates among the EU-27 regions are pronounced – with differences up to 13 times between regions experiencing the highest and the lowest youth unemployment rates.
Two regions out of five have a youth unemployment rate above 25 %. The highest youth unemployment rates are reg-istered in Spain, Greece and Italy. In the top-30 regions in terms of youth unemployment, 29 are located in these three countries.
In contrast, only 15 % of the regions register youth unem-ployment rates below 10 %, mainly located in Austria, Germany and the Netherlands.
Between 2008 and 2012 youth unemployment increased in four out of five regions. The crisis hit severely regions of Greece, Spain (where the increase in youth unemployment was between 10 percentage points in Navarra and over 27 p.p. in Asturias), Bulgaria, and Lithuania and Latvia.
In contrast, youth unemployment rates dropped in regions, 35 of them located in Germany, 5 in Belgium and 4 in Austria.
This table shows the ten regions with the highest youth unemployment rate in 2010
MS
Region
Youth Unemployment
rate, 2012
EL Dytiki Makedonia 73
ES Ciudad Autónoma de Ceuta 71
ES Canarias 63
ES Andalucía 62
ES Extremadura 62
EL Peloponnisos 61
ES Ciudad Autónoma de Melilla
61
EL Ipeiros 60
EL Kentriki Makedonia 60
EL Sterea Ellada 59
This table shows the ten regions with the largest increase in youth unemployment rate, in pp
MS
Region
Youth Unemployment
rate, 2008-2012
EL Peloponnisos 40
EL Kentriki Makedonia 38
EL Attiki 37
EL Dytiki Makedonia 36
PT Região Autónoma da Madeira
34
ES Extremadura 32
ES Castilla-La Mancha 32
ES Ciudad Autónoma de Ceuta
31
ES Andalucía 31
8. People aged 15 to 24 not in Employment,
Education or Training (NEET), 2012
This indicator divides the number of people aged 15-24 that are not employed (both unemployed and inactive) and not involved in any education or training by the total number of people aged 15-24.
Why does this matter?
People not in employment, education or training age 15-24 are likely to be early school leavers and unlikely to have com-pleted tertiary education. Europe 2020 aims to reduce the share of early school leavers and increase the share of ter-tiary educated by 2020. In addition, a high share of NEETs can indicate increasing resignation among young people and lack of trust in state institutions, a major threat to social cohesion.
How do the EU regions score?
Regional disparities in NEET rates among the EU-27 regions are pronounced – with differences up to 12 times between regions experiencing the highest and the lowest NEET rates.
The regions with the highest rates – with more than 1 out of 5 young people not in employment, education and training – can be found in Bulgaria and Romania (for reasons of higher inactivity), as well as Italy, Spain, and Greece (for rea-sons of higher unemployment).
In contrast, only 6 % of the regions (16 out of the 268 regions for which data were available) register NEET rates below 5 %, mainly located in the Netherlands. Regions with the lowest NEETs rates are also located Austria, Germany and the Czech Republic (the city of Prague).
Between 2008 and 2012 NEET rates increased in four out of five regions. The increase in NEET rates was particularly sharp for regions in Greece, Romania and Bulgaria with regional increases of 10 pp or more.
In contrast, NEET rates dropped in 51 regions, most of these are located in Germany, Sweden, Finland and Austria.
This table shows the ten regions with the highest NEET rate in 2012, in % of population aged 15-24
MS
Region
NEET, 2012
BG Severozapaden 36
IT Sicilia 31
IT Campania 30
IT Calabria 30
FR Réunion 29
EL Peloponnisos 29
EL Anatoliki Makedonia, Thraki 28
BG Yugoiztochen 28
ES Ciudad Autónoma de Ceuta 28
EL Sterea Ellada 27
This table shows the ten regions with the largest increase NEET rate between 2008 and 2012, in pp
MS
Region
NEET rate,
2008-2012
EL Peloponnisos 14
IT Valle d’Aosta/Vallée d’Aoste 14
EL Anatoliki Makedonia, Thraki 13
BG Severozapaden 12
RO Centru 12
EL Ipeiros 11
UK East Yorkshire and Northern Lincolnshire
11
EL Dytiki Makedonia 10
UK Cumbria 10
9. Net migration
Net migration is the difference between inward migration and emigration per thousand inhabitants. It is calculated by subtracting natural population change from total popula-tion change.
Why does this matter?
Migration can help to reduce regional disparities. In the receiving regions, it can boost employment and economic growth in by reducing labour shortages. The sending regions may witness a reduction of unemployment and an increase in money sent home by migrants (remittances). Rapid changes in total population, however, can lead to sig-nificant adjustment costs to increase or decrease public services.
How do the EU regions score?
Net migration turned negative or slowed down in many parts of the EU as a result of the crisis. In the transition regions, net migration dropped from 8.5 to 4.8 per thousand inhabitants. Nevertheless, the transition regions still have the highest aver-age net migration rate. Regional Competitiveness and Employment (RCE) regions come close with a rate of 3.2 and the convergence regions trail behind with a rate of 0.4.
The regions with the highest net migration rates are a mixture of Eastern, Western and Southern regions, including three capital regions. In many Eastern Member States, the capital region has the highest net migration.
The crisis reduced migration in regions that experienced larg-est inflows of labour migrants in the pre-crisis period, such as in Spain and Ireland. Despite the large reductions of net migration, many Spanish regions still had some of the highest levels of net migration. In Greece, migration dropped or remained stable, but all Greek regions kept a positive net migration rate. As the crisis continues to unfold, the increas-ing differences in regional unemployment rates may still affect migration in the coming years.
In Lithuania and Latvia, the crisis sped up the outflow with net migration rate moving from -2 to -8 and from -0.5 to -1.8 respectively. In contrast, in Estonia, net migration remained close to zero in both periods.
This table shows the ten regions with the highest average net migration, in 2007-10, per thousand inhabitants
MS
Region
NEET, 2012
CZ Střední Čechy 16.3
LU Luxembourg 14.1
ES Illes Balears 13.2
ES Castilla-La Mancha 12.6
CZ Praha 12.6
BE Région de Bruxelles-Capitale / Brussels Hoofdstedelijk Gewest
12.5
IT Emilia-Romagna 12.4
IT Ciudad 11.5
ES Melilla 11.4
ES Región de Murcia 11.2
This table shows the ten regions where average net migration decreased the fastest, between 2004-07 and 2007-10, in pro mille points
MS
Region
NEET rate,
2008-2012
ES La Rioja -14.8
ES Comunidad Valenciana -14.2
ES Cataluña -13.6
IE Southern and Eastern -13.4
CY Κύπρος / Kypros -12.2
ES Illes Balears -11.4
IE Border, Midland & Western -10.7
ES Región de Murcia -10.2
ES Canarias -9.5
ES Comunidad de Madrid -8.0
Convergence
Transition
RCE
EU
Net migration, 2007-2010 per 1000 inhabitants 0.4 4.8 3.2 2.4