Theses Thesis/Dissertation Collections
10-1-2009
An Application of the Bass diffusion model to
border security and illegal immigration
Ayeh Ohene-Asah
Follow this and additional works at:http://scholarworks.rit.edu/theses
This Thesis is brought to you for free and open access by the Thesis/Dissertation Collections at RIT Scholar Works. It has been accepted for inclusion in Theses by an authorized administrator of RIT Scholar Works. For more information, please [email protected].
Recommended Citation
by Ayeh Ohene-Asah
Masters of Science
Science, Technology and Public Policy Thesis Submitted in Fulfillment of the
Graduation Requirements for the
College of Liberal Arts/Public Policy Program at ROCHESTER INSTITUTE OF TECHNOLOGY
Rochester, New York
October 2009
Submitted by:
Ayeh Ohene-Asah
Student Name Signature Date
Accepted by:
Dr. Franz Foltz
Thesis Advisor/Graduate Coordinator Signature Date
STS/Public Policy Department/College of Liberal Arts
Dr. Christine Kray
Committee Member Signature Date
Sociology/Anthropology Department/College of Liberal Arts
Dr. James Winebrake
Committee Member/Department Chair Signature Date
Abstract
This research’s objective was to apply the Bass Diffusion model to border security and
illegal immigration. The Potential Actual Illegal Immigration Population (PAIIP) model
was created using the Vensim software program to illustrate and simulate illegal border
crossings and assess the impact of detention, deportation, and amnesty on the
communication between potential and actual illegal immigrants. This systems modeling
approach combined with a secondary analysis method was used for data collection and
analysis. Results indicate that no single or combination of policies solves the problem of
illegal immigration. This study’s conclusions point out that the greater the quality of
information communicated between actual illegal immigrants that reside in the United
States and potential illegal immigrants that live outside of the United States increases the
probability of illegal crossings. Policymakers should ensure that institutions and agencies
work in unison at the local, state, and federal level to deter illegal immigration and
Table of Contents
I. Introduction ... 5
I.1 What is the Problem? ... 5
I.2 Why are Border Security and Illegal Immigration Public Policy Issues? ... 7
I.3 Why are Border Security and Illegal Immigration a Science and Technology Issue? ... 9
I.4. Roadmap ... 10
II. Literature Review ... 11
II.1 Border Security Strategy of the United States ... 11
II.2 Motivations, Consequences & Factors Behind Illegal Border Crossings ... 12
II.3 Human Smuggling... 15
II.4 The Three Policy Strategies of the PAIIP Model ... 16
II.4.1 Detention and Deportation ... 16
II.4.2 Amnesty ... 18
II.5 Border Security Spending vs Illegal Immigrant Apprehension: A Linear Regression Approach ... 21
II.6 Causal Loop Diagrams ... 25
III. Research Questions ... 30
IV. Methods ... 32
IV.1 Systems Modeling for Illegal Border Entry... 34
IV.1.1 Potential Actual Illegal Immigration Population (PAIIP) Model & Its Connection to Terrorism ... 34
IV.1.2 Dynamic Hypothesis ... 35
IV.2 Detention and Deportation (Base Case) Explanation ... 36
IV.3 Potential Actual Illegal Immigration Model (PAIIP) Building Block Model (BBM) ... 37
IV.3.1 Detention and Deportation Building Block Model (BBM) Description ... 37
Base Case #1: Detention and Deportation ... 44
IV.3.2 Detention and Deportation with Amnesty Building Block Model (BBM) Description ... 44
Case #2: Amnesty with Deportation ... 47
V. Findings ... 48
V.1 Expectations ... 48
V.2 PAIIP Model Validation ... 50
VI. Discussion ... 66
VI.1 Results... 66
VI.1.1 Detention and Deportation ... 66
VI.1.2 Detention and Deportation with Amnesty ... 77
VI.1.3 PAIIP Model Results vs Research Questions ... 89
VII. Policy Recommendations ... 92
VII.1. The United States Government Should Expand its Temporary Work Card Program Instead of Granting Amnesty. ... 92
IX. Appendix... 100
IX.1 A ... 100
IX.2 B ... 100
IX.3 C ... 124
I. Introduction
Using a systems modeling approach and the Vensim software program, the
Potential Actual Illegal Immigration Population (PAIIP) model was created to
theoretically illustrate and simulate illegal border crossings. The PAIIP model
hypothesizes that the content of communication, or border crossivity, between actual and
potential illegal immigrants stimulates illegal crossings. This study uses the PAIIP model
to illustrate the effectiveness of detention, deportation, and amnesty on the ability to
deter illegal immigration and terrorism. This research study also compares the amount of
border security spending with the apprehension of illegal immigrants. The results from
this study reveal that policies involving border protection and illegal immigration must
work in unison on a local, state, and federal level in order to prevent violation of
immigration law. Policies should explore the motivation and factors surrounding illegal
immigration to ensure a safe United States and encourage legal entry.
I.1 What is the problem?
At least 10 million illegal immigrants reside in the United States of America
(Hanson, 2007). Many of these are undocumented immigrants who overstay their visas.
The Department of Homeland Security (DHS) did a study and estimated the visa overstay
population in the United States to be at least 3.6 million out of an estimated 9 to 10
million illegal immigrants (Lipton, 2005). In 2004, Immigration and Customs
Enforcement (ICE) received 301,046 leads on possible visa violators, but out of the 4,164
who were formally investigated, there were only 671 apprehensions (Lipton, 2005). With
towards their apprehension, as well as the prevention of this type of abuse, raises serious
questions about the allocation of resources towards border patrol funding.
There are daily attempts to cross the northern and southern border of the United
States by thousands of illegal aliens from Mexico, Canada, and countries all across the
globe. After the tragic events of September 11, 2001, there is a fear that terrorists may
sneak into the United States using the same smuggling networks as illegal immigrants
from Mexico or Canada. In 2002 alone, a half million illegal immigrants entered the
United States (Hanson, 2007, p. 25). Although the number of entrants into the United
States does not add to the net growth rate of the illegal immigrant population since many
of them return home each year, such behavior and potential annual growth in the visa
overstay population and illegal alien population pose a major problem for the citizens and
government of the United States.
The responsibility of maintaining border security and reducing illegal
immigration is a huge financial endeavor that requires funding from the government. The
three key public policy strategies that the United States government has used to tackle
border security and illegal immigration are detention, deportation, and amnesty. The last
time amnesty was granted to illegal immigrants living in the United States was under
President Ronald Reagan’s administration through the Immigration Reform and Control
Act (IRCA) of 1986. Today there is a debate over whether or not amnesty should once
again be granted to illegal immigrants. Other policy strategies which work
simultaneously are surveillance on the border, e-verification, workplace raids,
With the election of President Barack Obama in 2008, a new administration has
entered the White House with its own policy agenda and philosophy towards immigration
reform. President Obama’s administration also incorporates the public policy strategies
of immigration raids, electronic technologies such as E-Verify, and an increase in border
surveillance to combat illegal border crossings. As a Senator for Illinois in 2005,
President Obama voted for the Secure Fence Act; the work on its construction is
continuing (Reese, 2009).
Unlike President George W. Bush, President Obama’s administration is
exercising more patience and caution with immigration raids and has placed several
delays on them by performing more analysis prior to raiding a worksite (Hsu, 2009). As
a result, ICE is shifting its focus from detaining illegal workers to prosecuting employers
who hire them and encouraging the use of E-Verify as a policy alternative (Hsu, 2009).
Run by the Department of Homeland Security (DHS) and the Social Security
Administration (SSA), E-Verify is a voluntary program that enables participating
employers to verify the residency and employment eligibility status of their potential
employees.
I.2 Why are Border Security and Illegal Immigration Public Policy Issues?
Any person who is not a citizen or national of the United States is an alien
(Immigration and Nationality Act, 2009). An illegal immigrant is a person who enters
the United States without official approval. Border security and illegal immigration are
public policy issues because they impact the lives of Americans and the United States
politically, economically, and socially. These three elements are not isolated; they are
Many of the decision makers and stakeholders in politics and immigration reform
are public policy officials throughout the executive, legislative, and judicial branches of
the government. The policies implemented and enforced by these various branches
provide national security to the United States. Legislation such as the Illegal
Immigration Reform and Immigrant Responsibility Act of 1996 directly and indirectly
affects citizens and immigrants who reside in America legally or unlawfully. The
ratification of this act increased the attention placed on deterrence, stronger fencing was
constructed in San Diego; the latest military technology was integrated for security;
punishment for smugglers, migrants without documentation, and people who overstayed
their visas became stricter; and finally, 1,000 new Border Patrol agent jobs were created
(Massey, 2005).
Enforcing immigration law and securing the borders of the United States cost
billions of dollars. Immigrants who cross the border illegally or overstay their visas find
employment and utilize some of the resources the United States economic system offers
such as education and healthcare. The economic relationship between America and
Mexico is also a factor in immigration policy making. Between 1986 and 2002, the
Immigration and Naturalization Service’s (INS) budget increased from $474 million to
$6.2 billion, and over the same time period the Border Patrol’s budget increased from
$151 million to $1.6 billion (Massey, 2005). As the number of Mexicans who entered the
United States with business visas increased from 128,000 a year in 1986, to 438,000 a
year in 2003, the total trade in goods and services between both nations increased over
the same time period to approximately $235 billion (Massey, 2005). Based on these
the government must address as they distribute funds to deter and prevent more growth in
the number of undocumented immigrants.
Socially, most immigrants live in families with a blend of legal statuses,
opportunities, and dreams (Gonzalez, 2009). In the event a family member faces
detention and deportation, the likelihood of long-term or permanent separation makes
policy making arduous, especially when there are children involved. Sometimes a child
may be a natural born citizen of the United States, and either one or both of their family
members are undocumented; such scenarios make policy solutions for border security
and illegal immigration complex.
I.3 Why are Border Security and Illegal Immigration a Science and
Technology Issue?
Border Security requires the latest scientific and technological innovations to
capture potential illegal immigrants. The use of Unmanned Aerial Vehicles (UAVs) and
Remotely Piloted Vehicles (RPVs) to deter illegal immigration and prevent terrorism is
supported by Congress. UAVs and RPVs increase the number of hours and the distance
border patrol can be enforced and can, therefore, improve the apprehension rate of illegal
crossers (Blazakis, 2004, p. 3). Although new technology can increase border patrol
efficiency, such advancements are costly. In 2008, President George W. Bush asked for
$13 billion to enhance border security and immigration enforcement; $1 billion from this
amount was proposed for fence construction and safety measures along Mexico’s border
(Hanson, 2007, p. 24).
Scientific and technological evaluation and risk assessment help to increase the
probability that technologies used are reliable and safe. Innovative technologies, such as
improved biometric data recognition and storage, UAVs, RPVs, and identification cards
with radio frequency identification chips, imply that public policy officials must be
cautious about the political, economic, and social ramifications of using scientific and
technological tools to secure the borders of the United States.
I.4. Roadmap
The next section is a literature review which provides a background on border
security and illegal immigration issues and policies such as chain migration, detention,
deportation, and amnesty. After that is a section that presents the major research
questions this study will attempt to answer. Next, there is a methodology section which
summarizes the analytical processes and tools that were used in this study. Moreover, the
methods section provides an explanation of the PAIIP model. Following that are the
results from running the PAIIP model, as well as other quantitative border security and
immigration data. Finally, the remaining chapters of this research study are the
Discussion, Policy Recommendations, and Conclusion sections, which respectively
II. Literature Review
The PAIIP model was designed using systems modeling to simulate illegal border
penetration by potential illegal immigrants. First, the literature review will outline the
current United States strategy towards providing border security and deterring illegal
immigration. Next, it will present some of the motivations, consequences, and factors
behind illicit border crossing. Because the PAIIP model provides a means towards policy
analysis on detention and deportation and amnesty, the strengths and weaknesses of each
of these policies will be discussed. Finally, border security spending will be compared to
illegal alien apprehensions using a linear regression approach. Therefore, the qualitative
and quantitative evidence presented in this literature review will provide the theory
behind the PAIIP model’s design.
II.1 Border Security Strategy of the United States
The present border security strategy of the United States encompasses the
combination of the Obama administration’s agenda as well as that of Immigration &
Customs Enforcement (ICE) and Customs and Border Protection (CBP). President
Obama has a five-point agenda for providing border security.
First, the Obama administration intends to provide additional support for the
employees, systems, and technological resources along the borders and ports of entry of
the United States. Second, Obama’s administration would like to augment the number of
legal immigrants to ensure that families stay together and, at the same time, fill the gap of
unfilled jobs employers provide. Third, President Obama hopes to eradicate the
documentation. Fourth, the administration seeks to create a system such that immigrants
without documentation but who are in good standing pay a penalty, learn the English
language, and eventually gain a pathway to citizenship. Finally, the Obama
administration would like to cooperate with Mexico by promoting fiscal development and
decreasing illegal immigration (The Agenda • Immigration, 2009).
Under the CBP, the Office of Field Operations (OFO) has the primary
responsibility of providing border security. Initiated in November 2005, the Secure
Border Initiative (SBI) is a key component of the cooperation between both of these
entities. SBI incorporates the use of the most advanced technological and tactical
resources to maintain border security (Secure Border Initiative (SBI) Programs, 2009).
ICE has an annual budget of $5 billion. Since 2007, ICE has implemented new
strategies towards deterring illegal immigration. These new strategies consist of
improved management, focusing and targeting the most troublesome illegal immigrants
as well as employers who violate immigration policies, and decreasing the amount of jobs
that attract illegal aliens in search of work (Office of Detention & Removal (DRO),
2009). These employment opportunities refer to the job magnet, or the strong pull of jobs
that cause immigrants to illegally cross the border (Kriikorian, 1999).
II.2 Motivations, Consequences & Factors Behind Illegal Border Crossings
In the United States, one in ten people are foreign born, and the largest groups are
from Mexico, China, the Philippines, and India (The SH RM Learning System, 2006).
Although the world’s population is decreasing in the developed world, it continues to
grow at a high rate in developing countries. The discrepancy in population growth is
new pressures for migration and immigration both within and between nations (The SH
RM Learning System, 2006).
There are many reasons why people immigrate to America. For instance, the
United States and Mexico’s economies play a huge role in whether or not there will be an
illegal border crossing. Many immigrants illegally cross the border or overstay their
visas because they can get higher paying jobs in the United States and thus make more
money (Abraham, Hamilton, Meissner, Fix, Meyers, & Papademetriou, 2006). In 2005,
over 50 percent of illegal migrants in the United States were of Mexican origin (Hanson,
2007). Moreover, when Mexico’s wages for its workers decrease, attempts at illegal
entry into the United States increase (Hanson, 2007). Therefore, an ailing economy or
financial hardship is one reason that may motivate a person to risk their life to illegally
enter the United States.
The strong desire to be with a friend, loved one, or family member also must not
be overlooked. Such sentiments and conviction help justify why the possibility of
detention and deportation do not prevent potential immigrants from illegal immigration.
Hence, chain migration is a consequence of illegal border crossings.
Chain migration refers to a pattern resulting from one person already in the
country helping a family member or friend enter the country. In turn, those same family
members and friends bring their relatives and peers to the same nation or country to join
them. In reference to both legal and illegal immigration, chain migration has a long
history in the United States. The ability for aliens to utilize chain migration encompasses
what quantitative studies call a “migrant stock variable” (Wegge, 1998, p. 959). The
or the total number of previous immigrants in a specific destination country. Typically it
“represents the flow information between [immigrants and potential immigrants], or the
family and friends effect” (Wegge, 1998, p. 959). In short, if the potential illegal
immigrant knows someone in or has relatives in the United States the probability of an
illegal border crossing is increased. Therefore, the greater and more reliable the flow of
information in a network is the more likely it is that a migrant in one country will use that
knowledge as a means towards moving to another unlawfully.
A factor that indirectly affects illegal border crossings is population growth. The
potential impact of Mexico’s population dynamics will be used as an example for
discussion. During the latter part of the 20th century, as Mexico’s overall population
grew faster than the country’s ability to provide jobs millions of illegal workers fled to
the United States. Mexico’s government began to encourage the use of and provide
access to birth control for Mexican families. In doing so, the average Mexican family has
decreased from seven children in 1960 to two in 2008 (Lange, 2009, p.1).
Despite the fact that over 11 million Mexicans left Mexico between 1970 and
2006 to come to America, some researchers believe that the flow of Mexican migration is
decreasing. For example, Lange reports that in 2001 the annual average number of
Mexicans who left Mexico reached a maximum of 600,000 but has been reduced to
440,000 in 2006. Such a decrease in the average amount of border crossings by Mexican
nationals not only demonstrates the power of population factors but raises questions
about border security spending such as extended fence construction. Nevertheless,
according to Lange the Mexican minimum wage is $4 a day compared to the United
migration of Mexicans, especially teenagers. Therefore, hundreds of thousands of
Mexicans may continue to cross the border for the foreseeable future (Lange, 2009, p. 3).
As population growth slows, however, this decreases the labor supply rendering labor
more valuable, hence wages will increase in Mexico and we should expect a further
slowing of out-migration as a consequence.
Economic motivations, chain migration, which is a consequence of illegal border
crossings, and population growth factors impact migration rates. Other influential
elements include political stability, the protection of civil rights, and other conditions that
contribute to quality of life such as education, health care, and infrastructure.
II.3 Human Smuggling
Since 9/11 the United States government has consistently increased its spending
on border security. However, since the southern and northern borders of America are not
permanently sealed, holes still exist for illegal immigrants to exploit and penetrate.
Border security and illegal immigration require examination of the means by
which an illegal immigrant may enter America. One method illegal immigrants may use
to enter the United States that is an issue of concern is human smuggling. The Federal
Bureau of Investigation (FBI) estimates human smuggling to be a multi-billion-dollar
revenue generating business. While the fee for undocumented Mexicans to be smuggled
across the border has risen from a couple hundred dollars to over a thousand dollars,
people other than Mexicans (OTMs) pay at least ten times more than the normal base rate
to be snuck into America. Some of the methods used by human smuggling networks
include the use of adjusted tractor trailers with concealed sections for migrant
businesses, companies, and agencies and producing high-quality counterfeit
documentation (Ewing, 2006, p. 6).
The policies regarding border security and illegal immigration have the potential
to impact the lives of Americans and the United States economy. Therefore, in order to
make prudent public policy decisions, the overall ability to reduce illegal border
crossings must be assessed.
II.4 The Three Policy Strategies of the PAIIP Model
The PAIIP model simulates individually and in various combinations the policies
of detention, deportation, and amnesty. The purpose of this section is to justify the
incorporation of each policy into the PAIIP model as well as the theory behind its design.
By discussing and comprehending the strengths and weakness of each policy better
analysis of the PAIIP model’s results will be achieved.
II.4.1 Detention and Deportation
The penalty for illegal entry into the United States is detention followed by
deportation. Various facilities in the United States hold illegal immigrants such as the
Corrections Corporation of America and the Geo Group. Although detention is a strong
deterrent for illegal border crossings, the cost of maintaining this policy raises questions
about its long-term effectiveness. The cost of a detention policy is very high. With
nearly 30,000 illegal immigrants held on a nightly basis for an average cost of $95 per
person the total yearly cost for detention is $1 billion. Instead of an increase in the
number of people illegally entering the United States more prison space is needed due to
apprehensions at the border (Kolodner, 2006). The United States government wants to
place more immigrants in detention as they wait for their hearings, particularly those who
are not from Mexico; the government no longer wants to discharge them “on their own
recognizance, [because they] intend to end [what was previously known as] the catch and
release era” (Kolodner, 2006).
The Office of Detention and Removal (DRO) has the primary responsibility of
deporting the illegal immigrants they identify and apprehend. Although deportation is a
strong and effective method for penalizing illegal immigrants, this policy has
weaknesses. Once Congress passed the Immigration and Nationality Act of 1952 there
has been a strong stream of illegal immigrants into the United States (Immigration
Control, 1989). Because the process of deportation encompasses a judicial process,
wherein a judge must decree the order of removal for an apprehended illegal immigrant,
one of the main weaknesses for the policy of deportation is time. For example, the
process of deporting an illegal immigrant may take five years or more. Since thousands
of immigrants are deported annually, this research study assumes that the average time it
takes to deport an illegal immigrant is one year. The reason for this time delay may be
attributed to the
coordination and liaison with foreign government officials and embassies to obtain travel documents and country clearances, coordinating complex logistical and transportation issues to repatriate the alien and, if required [the] DRO officers escort the alien to his or her foreign country (Office of Detention and Removal, 2009).
Despite the fact that deportation may be a time-consuming process its main
strength is that it deters immigrants from violating United States immigration law.
from the United States are ineligible to return for a minimum time period of five years;
the maximum penalty is life (Eschbach, Hagan, & Rodriguez, 2008).
II.4.2 Amnesty
The Department of Homeland Security, Immigration & Customs Enforcement
(ICE), and Customs and Border Protection (CBP) have been revamped with the purpose
of securing the United States’ borders, wherein the penalty for apprehension is detention
and deportation. However, another policy alternative that is presently in debate as a
deterrent for illegal immigration is amnesty.
When the government pardons illegal immigrants for violating immigration laws
that act is known as amnesty. The Immigration Reform and Control Act of 1986 (IRCA),
the first United States amnesty act, was passed with the goal of controlling and deterring
illegal immigration to the United States. It is estimated that under the IRCA of 1986,
three million aliens were granted amnesty, and the two groups of illegal immigrants who
were eligible for it were those considered residents of the United States before January 1,
1982 (Rytina, 2002, p. 2). Seasonal agricultural workers who were employed for at least
three months prior to May, 1986 were legalized as well (Rytina, 2002).
Massey (2005) asserts that the IRCA of 1986 had four goals. First, the IRCA
sanctioned employers who hired undocumented workers. Second, more resources were
allocated to the Border Patrol. Third, it granted legalization to undocumented
immigrants who could prove that they continuously resided in the United States for five
years, as well as migrant farm workers. Finally, the IRCA expanded the executive
authority of the President to declare an “immigration emergency” in the event of an
According to President Obama, “if the American people don't feel like you can
secure the borders, then it's hard to strike a deal that would get people out of the shadows
and on a pathway to citizenship who are already here” (Hsu, 2009). With illegal
immigration yet again being a controversial topic many policy analysts and scholars are
debating whether amnesty should be granted again. A key element in this debate is
whether or not the IRCA of 1986 actually deterred illegal border crossings in subsequent
years. The IRCA of 1986 impacted legal immigration because amnestied aliens, as long
as they possess permanent resident status or naturalized citizenship, have been fully
eligible to sponsor additional immigrants (Rytina, 2001, p. 5). Sponsorship is not open to
anyone; it is predicated on whether a person has been granted citizenship or permanent
legal residence, and the specific family member sought after to be legally brought over
into the United States. Hence, through subsequent chain migration, the policy of
amnesty enables legal migration.
Amnesty is a complex debate with many sides. There are several different ideas
being proposed. People support different legislation or ideas with various conditions.
There are proponents and opponents of different amnesty proposals. While the views of
proponents delineate the strength of an amnesty policy, the stance of its opponents
highlights the weaknesses of legalization as well. General amnesty supporters consist of
labor unions such as the AFL-CIO, religious institutions such as Christian coalition
groups and the Catholic Church, and Congress members such as Senator Richard Durbin.
Immigration lobbyists for amnesty also encompass business and human rights
One of the main reasons that there are amnesty advocates is that they believe it
would “save politically unacceptable mass deportations” (Hanson, 2007, p. 30). Other
arguments people make for amnesty is that it prevents the exploitation of illegal
immigrants who employers knowingly hire, and it keeps families together, especially
those with children. Families in this situation are referred to as mixed-status families
(Gonzalez, 2009). The Pew Hispanic Center reports that nearly four million children in
the United States have at least one parent who illegally entered and is not a citizen; 80
percent of these children live in two-parent family homes (Drash, 2009).
Amnesty opponents do not approve of rewarding violators of immigration law
with a pathway to citizenship (Hanson, 2007). Many opponents point towards the surge
in illegal immigration after the IRCA of 1986 was passed as proof that legalization does
not work (Hanson, 2007, p. 30). Opponents of legalization would like to see a shift
towards the creation of more jobs for American citizens. They are also weary of the cost
for legalization programs. Ten years (1987-1997) after the United States granted
amnesty to illegal immigrants the Center for Immigration Studies did a study and found
that the cost of legalization was approximately $78.7 billion (Simcox, 1997). Factoring
in the indirect and downstream costs the study revealed that the amnestied population
accounted for an estimated $102.1 billion in 20 federal, state, and local assistance
programs and services and that the $78 billion in paid total taxes resulted in a ten-year
fiscal deficit of $24 billion in the public assistance and services portion of the budget
(Simcox, 1997). Instead of this financial burden, amnesty opponents advocate that more
fiscal resources be allocated towards border security such as an increase in border patrol
Immigration policy reform is open to criticism no matter what the policy remedy.
In reference to amnesty, the ramifications of any type of legalization program must be
thoroughly assessed.
II.5 Border Security Spending vs Illegal Immigrant Apprehension: A Linear
Regression Approach
The purpose of this section is to ascertain whether or not spending more money
on border security results in a significant deterrence in illegal immigration.
Apprehension, detention and deportation, and Border Patrol require funding. For
example, “in 2006, with the already huge increases in spending, the flow of illegal
immigrants across the southern border (as measured by apprehensions) fell by 27
[image:22.612.95.524.399.638.2]percent” (Hanson, 2007, p. 25).
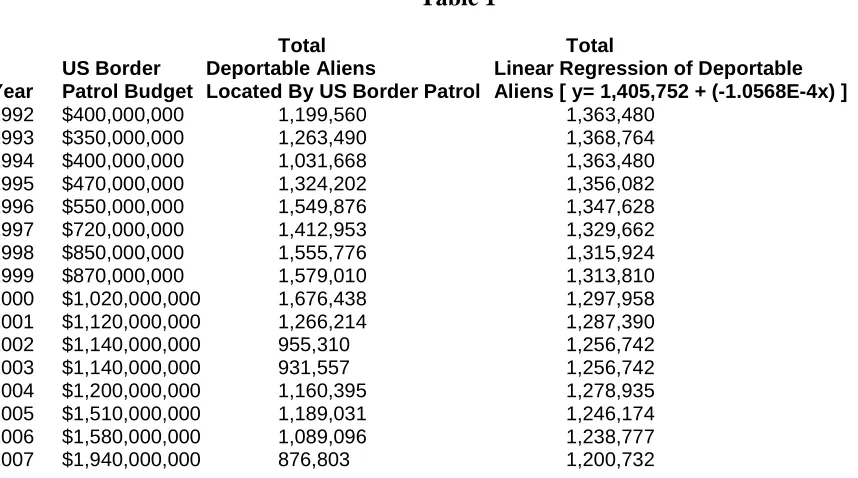
Table 1
Total Total
US Border Deportable Aliens Linear Regression of Deportable
Year Patrol Budget Located By US Border Patrol Aliens [ y= 1,405,752 + (-1.0568E-4x) ]
1992 $400,000,000 1,199,560 1,363,480
1993 $350,000,000 1,263,490 1,368,764
1994 $400,000,000 1,031,668 1,363,480
1995 $470,000,000 1,324,202 1,356,082
1996 $550,000,000 1,549,876 1,347,628
1997 $720,000,000 1,412,953 1,329,662
1998 $850,000,000 1,555,776 1,315,924
1999 $870,000,000 1,579,010 1,313,810
2000 $1,020,000,000 1,676,438 1,297,958
2001 $1,120,000,000 1,266,214 1,287,390
2002 $1,140,000,000 955,310 1,256,742
2003 $1,140,000,000 931,557 1,256,742
2004 $1,200,000,000 1,160,395 1,278,935
2005 $1,510,000,000 1,189,031 1,246,174
2006 $1,580,000,000 1,089,096 1,238,777
Chart 1
Border Security Sepding vs Illegal Immigrant Apprehension
0 200,000 400,000 600,000 800,000 1,000,000 1,200,000 1,400,000 1,600,000 1,800,000
$0 $500,000,000 $1,000,000,000 $1,500,000,000 $2,000,000,000 $2,500,000,000 United States Border Patrol Budget
D
e
p
o
rt
a
b
le
A
li
e
n
s
L
o
c
a
te
d
b
y
P
ro
g
ra
m
a
n
d
B
o
rd
e
r
P
a
tr
o
l
S
e
c
to
r
a
n
d
I
n
v
e
s
ti
g
a
ti
o
n
Deportable Aliens Located Linear Regression Data Points for Deportable Aliens Trendline for Linear Regression of Deportable Aliens
y = 1,405,752 + (-1.0568E-4x)
The Department of Homeland Security (DHS) provides statistics on deportable
aliens located by the border patrol sector each year. The border patrol is spread out
through numerous locations in the United States. In Appendix A, Table 3 indicates how
the Border Patrol breaks down its patrolling areas into two sectors, the southwest sector
and other sectors. The southwest sector consists of cities in the states of California,
Arizona, and Texas such as San Diego, Tucson, and El Paso, respectively. The other
sectors encompass different cities such as Buffalo, New York, Miami, Florida, and
Swanton, Vermont.
The exponential growth in the amount of money spent on border patrol raises the
question of whether the United States has been able to successfully deter immigrants
A linear regression T Test was used to assess cost effectiveness of border security
spending versus the number of deportable aliens located by the Border Patrol. The
equation of the linear regression line was plotted in the form y = B0 + B1x. All original
and projected data have been recorded in Table 1 and plotted in Chart 1 of this section.
The focus of the linear regression T Test is the slope, B1, of the regression line; it
is also referred to as the regression coefficient. The regression coefficient for this
statistical analysis is important because it provides insight into the relationship between
border patrol spending and the apprehension of illegal immigrants. A B1 greater than
zero denotes a positive and direct relationship between spending and deportable alien
apprehension; this implies that an increase in spending results in an increase of
apprehensions. A B1 lower than zero indicates a negative and inverse relationship
between spending and apprehension; thus an increase in spending results in a decrease of
deportable aliens apprehended. Finally a B1 equal to zero implies no relationship
between apprehension and spending.
The equation for the regression line is y = 1,405,752 + (-1.0568E-4x); it was
derived from the plotted data for the dependent variable, Deportable Aliens Located by
Program and Border Patrol Sector and Investigation, and the independent variable,
United States Border Patrol Budget, from 1992-2007. The linear regression equation is
also a cost function, Deportable Aliens Located = f($); inputting the border patrol budget
values into the cost function, Y = f(X1, X2,…Xn), provides the projected annual number
The results from the Linear Regression T Test show that B1 is equal to -1.056E-4,
and that the regression equation projects a downward slope for the plotted data. The
standard error for the regression equation, s, is 227,094. The standard error for the slope,
sb1, is 5.3778E-5. The test statistic, t, is -1.9651; the P-value, p is .0348; and the degrees
of freedom, df, is 14. The correlation coefficient (goodness of the fit) for the regression
line, r2, is .22, or 22%. The results from the Linear Regression T Test indicate that there
is an inverse relationship between border patrol spending and apprehension; the
exponential increase in border patrol spending does not correlate with an increase in
apprehensions.
According to Massey (2005), the cost for the apprehension of an illegal immigrant
by the Border Patrol has increased from $300 in 1992 to $1,700 in 2002. The increase in
border enforcement has pushed immigration rates to more remote locations; this has
resulted in a higher rate of death along the border, forced illegal immigrants to remain in
the United States longer, and caused a significant decline in apprehension rates (Massey,
2005).
The linear regression technique used in this section is a simple analytical tool
used for projection. The results from this method are merely theoretical. Since the type
of deportable alien located by the Border Patrol is not reported in the data set used the
policy analysis technique of a Linear Regression T Test is neither strong enough to help
understand the broader scope of illegal immigration nor provide viable policy
recommendations. However, this technique does form a foundation towards further
Consequently, another relevant policy analysis technique is systems modeling.
Therefore, the construction of causal loop diagrams was a crucial piece towards
developing the PAIIP model.
II.6 Causal Loop Diagrams
Causal Loop Diagram 1 (CLD 1) captures the main argument of this research
study and the driving force behind the PAIIP model. CLD 1 has a reinforcing loop. The
impact of one variable on another variable along a reinforcing loop may be uniformly
positive or negative, positive meaning that an increase in one variable causes the other to
increase, or negative implying that an increase in a variable causes the other to decrease.
CLD 1 asserts that an increase in border crossivity causes an increase in the entry
of unauthorized immigrants into the United States and that an increase in the entry of
unauthorized immigrants causes an increase in border crossivity. Border crossivity
represents communication between immigrants who reside in the United States and those
who live outside of America. More reliable and qualitative the content of the discussion
and information between actual illegal immigrants and potential illegal immigrants
stimulates illegal border crossings and contributes towards the undocumented population
in the United States. Edwards (2006) argues that both legal and illegal immigration are
inextricably related. He also asserts that chain migration connects legal and illegal
immigration; this implies that even though immigrants who either obtain citizenship or
come to America legally may bring over their relatives and friends there are still
instances in which legal and illegal immigrants contribute towards illegal border
Causal Loop Diagram 1
Entry of Unauthorized
Immigrant Population Border Crossivity
+
+
Reinforcing Loop I
Causal Loop Diagram 2 (CLD 2) is an expansion of CLD 1. CLD 2 has a
balancing loop. Variables along a balancing loop are neither uniformly positive nor
negative. The causal relationship between variables along a balancing loop is both
positive and negative. Thus, as one variable increases, it may cause the other to increase
Casual Loop Diagram 2
Entry of Unauthorized
Immigrant Population Border Crossivity +
+ Reinforcing Loop I
Border Patrol Budget
Deportable Aliens Locted By Border Patrol Sector Detention &
Deportation
+
+ +
-Balancing Loop 1
CLD 2 illustrates the relationship between border patrol spending and
apprehension. CLD 2 asserts that an increase in the entry of unauthorized immigrants
causes an increase in the Border Patrol’s budget. An increase in the Border Patrol’s
budget causes an increase in the deportable aliens located. An increase in the number of
deportable aliens located causes an increase in detention and deportation, and an increase
in detention and deportation causes a decrease in the entry of unauthorized immigrants.
Although an increase in spending should cause an increase in apprehensions this research
study argues that an increase in spending does not correlate with an increase in
Chart 1
Border Security Sepding vs Illegal Immigrant Apprehension
0 200,000 400,000 600,000 800,000 1,000,000 1,200,000 1,400,000 1,600,000 1,800,000
$0 $500,000,000 $1,000,000,000 $1,500,000,000 $2,000,000,000 $2,500,000,000 United States Border Patrol Budget
D
e
p
o
rt
a
b
le
A
li
e
n
s
L
o
c
a
te
d
b
y
P
ro
g
ra
m
a
n
d
B
o
rd
e
r
P
a
tr
o
l
S
e
c
to
r
a
n
d
I
n
v
e
s
ti
g
a
ti
o
n
Deportable Aliens Located Linear Regression Data Points for Deportable Aliens Trendline for Linear Regression of Deportable Aliens
y = 1,405,752 + (-1.0568E-4x)
Since 1965, American immigration laws encouraged the reunification of
families and thus provided a mechanism for migrants with family ties to legal aliens to
chain migration (Wegge, 1998). Yet, immigrants are still illegally crossing the border or
overstaying their visas making it very arduous for the government to adequately respond
with the necessary and proper legislation to deter this behavior in a timely fashion.
Balancing Loop 2 in Casual Loop Diagram 3, CLD 3, tries to capture the difficulties of
the government’s response to illegal border crossings.
CLD 3 is an expansion of CLD 2 and is the final causal loop diagram of this
section. With the third and final piece incorporated, CLD 3 argues that the entry of
unauthorized immigrants causes an increase in border security, and an increase in border
border security may stem from new legislation or mandates from the government, the
allocation of more money, or the strategic movement of funds to programs and initiatives
that work best. However, sometimes there tends to be a delay in legislation to fight
illegal immigration. One reason for the delay is attributed to the policy cycle and its
ability to respond to illegal immigration and border security measures in a timely fashion.
For example, the creation of the Department of Homeland Security after September 11,
2001, took time as various agencies were reorganized. Another reason for the delay may
be the current amnesty debate.
Causal Loop Diagram 3
Entry of Unauthorized
Immigrant Population Border Crossivity +
+ Reinforcing Loop I
Border Patrol Budget
Deportable Aliens Locted By Border Patrol Sector Detention &
Deportation
+
+ +
-Balancing Loop 1 Border Security
+
-Balancing Loop 2
Delay attributed to policy cycle in response to border security and illegal immigration, and the implemenation of legislation that comes from
Congress such as Amnesty Proposals.
With a single reinforcing loop and two balancing loops, the components of CLD 3
illustrate the political, economic, and social impact of illegal migration on border
security. Most importantly, CLD 3 provides a framework towards understanding the
PAIIP model and attempts to describe the causes and effects that stimulate the entry of
III. Research Questions
As we have seen, the United States government, although it relies on several
others as well, has focused on three policies – detention and deportation, and amnesty –
in its effort to reduce illegal migration. Since the United States government has increased
its spending on border security, it is important to know which policy or combination of
polices work best at reducing illegal border crossings. The PAIIP model will try to
illustrate the following:
1. Which policy or combination of policies has the best chance of limiting illegal migration?
The PAIIP model is an illustrative policy analysis tool that was developed to
primarily study the impact of detention and deportation and amnesty on the
communication between potential and actual illegal immigrants, as well as how these
policies affect illegal border crossings. The results from the PAIIP model’s cases will
provide an innovative way to examine the problem(s) behind border security and illegal
immigration.
2. What does the United States government, its organizations, and agencies that provide border security need to be successful at executing their agenda and goals?
The cost to apprehend, detain, and deport illegal immigrants continues to increase.
For instance, in 2001 the Immigration and Naturalization Service spent $4.2 billion on
border and interior enforcement which included the detention and removal of illegal
aliens. Such spending on detention and deportation factor into the debate on amnesty,
Furthermore, some opponents of legalization do not see the logic in spending taxpayer
money on border security and then rewarding non-citizens with a pathway to citizenship.
Therefore, in reference to border security spending, detention and deportation, and the
amnesty debate, the PAIIP model’s results will be interpreted to address the resources
IV. Methods
In order to understand the immigration problem it is important to understand what
causes illegal entry into the United States. Some of the reasons that cause illegal entry
are:
a. There exist three primary smuggling corridors along the southern border of the
United States: the South Texas, West Texas/New Mexico, and California/Arizona
corridors.
b. Illegal migration is motivated by the search for employment in the United States
and other factors such as education, healthcare, and political asylum.
c. Chain migration is a consequence of illegal crossings.
d. Population growth is a factor towards illegal migration.
e. Human smuggling is an annual billion dollar enterprise immigrants use to
illegally penetrate the United States’ borders.
Causal Loop Diagram 3 (CLD 3) delineates how communication between
potential and actual illegal immigrants stimulates the entry of illegal immigrants. CLD 3
also describes the impact of government legislation and border security spending on the
entry of unauthorized immigrants. However, a causal loop diagram is a limited means for
providing an explanation for the immigration problem because the dynamics of illegal
immigration are very complex. Therefore, using systems dynamic modeling helps
increase our understanding of the situation and will better assist policymakers, CBP, and
ICE towards dealing with the problem of illegal immigration and most importantly help
secure the United States’ borders. Using secondary data analysis, the purpose of the
illegal immigrant apprehension, and to simulate the effects of detention and deportation
and amnesty on the communication between potential and actual illegal immigrants, and
illegal border crossings. The steps are outlined below.
1. Immigration and border security data were collected from the United States’
Department of Homeland Security (DHS) website and the Data360 website.
2. The data from the DHS and Data360 website were plotted on a graph. The data
was used to perform a Hypothesis Test for the Slope of a Regression Line, also
referred to as a Linear Regression T Test.
3. The results from the Linear Regression T Test were plotted in the form
Y = B0 + B1X. B0 is a constant. B1 is the slope or regression coefficient. X,
border patrol spending, is the value of the independent variable. Y, deportable
aliens located, is the value of the dependent variable.
4. There were two hypotheses:
The null hypothesis H0: B1 = 0
The alternative hypothesis Ha: Β1 < 0
5. The null hypothesis, H0, was rejected, and the alternative hypothesis, Ha, was
accepted.
6. Causal loop diagrams were designed and developed to explain the theory behind
the PAIIP model and some of the political, economic, and social issues
surrounding border security and illegal immigration.
7. A systems model entitled the Potential Actual Illegal Immigration Population
(PAIIP) model was designed to simulate communication between potential and
8. The PAIIP model has two cases: Detention and Deportation and Detention and
Deportation with Amnesty
9. Discussion and analysis on the dynamics of the PAIIP model and its two cases.
IV.1 Systems Modeling for Illegal Border Entry
The PAIIP model was developed using systems modeling as a policy analysis tool
that may be applied towards understanding the dynamics of illegal border crossings.
First, the PAIIP model’s origins and its connection to terrorism are articulated. Next, this
section presents the dynamic hypothesis of the PAIIP model. Then, the mathematics
behind the base case’s design and ability to simulate illegal migration are presented.
Finally, the building block models for the PAIIP model’s cases are discussed.
IV.1.1 Potential Actual Illegal Immigration Population (PAIIP) Model &
Its Connection to Terrorism
The PAIIP model originated from the concept and design of Kermack and
McKendrick’s (1927) SIR model and the Bass Diffusion model. Sterman (2000) states
that in a systems model, stocks are accumulations that characterize the state of the system
and generate the information upon which decisions and actions are based and that flows
drive the rate at which stocks change. During a model simulation or run for policy
analysis, policy levers are tools that a policy actor/decision maker may adjust by either
increasing or decreasing to observe what the policy implications are for the chosen
The “SIR model, which stands for Susceptible population, S, the Infectious
population, I, and the Recovered Population, R, is a model for understanding the
dynamics of epidemic diseases” (Sterman, 2000, p. 303).
[The] Bass Diffusion model simulates the phenomena of rumor spreading and new ideas, the adoption of new technologies, and the growth of new products, because they too may be viewed as epidemics (Sterman, 2000, p. 323).
While the SIR model has three stocks, two flows, and four policy levers, the Bass
Diffusion model has two stocks and three policy levers.
Since policymakers are concerned that terrorists may use the same illicit methods
as illegal immigrants to enter the United States, the PAIIP model’s cases become
analytical tools that may help the government, ICE, and CBP deter or prevent terrorism.
For instance, in the PAIIP model base case the process of detention and deportation
delineates how an actual illegal immigrant or terrorist is apprehended, deported, and
returned into the potential illegal immigrant population. Yet, detention and deportation
are only two strategies towards deterring illegal immigration and the potential threat of
terrorism. The policy of amnesty is incorporated into the PAIIP model’s second case as
well.
IV.1.2 Dynamic Hypothesis
The key behind the PAIIP model’s dynamic hypothesis of communication
between potential and actual illegal immigrants lies within the fundamental assumption
of the Bass Diffusion model. The Bass Diffusion model, which has a Potential Adopters
stock and an Actual Adopters stock, is based on the assumption that the adoption of a
word of mouth. Moreover, “there are several channels of awareness that can stimulate
early adoption of new innovations besides word of mouth and related feedback effects
that depend on the size of the adopter population, such as adversting, media reports, and
direct sales efforts” (Sterman, 2000, p. 332).
The dynamic hypothesis of the PAIIP model is that:
The communication between illegal aliens in the United States and potential aliens outside the United States via word of mouth in all its forms, verbal, manual, or digital, stimulates illegal border entry and activity.
IV.2 Detention and Deportation (Base Case) Explanation
This section discusses and presents the mathematical formulas that enable the
calculation of the variables in the PAIIP model’s base case. The base case is important
because the second case is derived from it1.
PIIP = ∫ ( -BCR, N - AIIP0 - IIAP0 )
AIIP = ∫ ( BCR – AR, AIIP0 )
IIAP = ∫ ( AR, AIIP0 )
The communication between the AIIP and the PIIP is captured by the parameter
Illegal Immigration Contact Rate, iicr. This form of communication is analogous to word
of mouth via various modes of communication such as telephones, the Internet, and
written letters. Therefore, the PIIP generates: PIIP*iicr contacts per time period.
The time period for this model is the amount of people contacted over the course
of a year between the AIIP and the PIIP. Border crossivity, which is the probability of a
random encounter between a person from the AIIP and the PIIP, makes the PIIP
1
susceptible towards crossing the border. The probability of a random encounter is,
AIIP/N.
The IIAP is based on the percentage of AIIP caught at the border. To get the
actual value of the amount of time it takes to rid the country of illegal aliens, one needs to
know how long it takes for a person to be deported and sent back into the PIIP.
Therefore, the delay fixed function is used in the base case because it takes time to locate,
apprehend, and deport an illegal alien after he or she crosses the border.
IV.3 Potential Actual Illegal Immigration Model (PAIIP) Building Block Model
(BBM)
The Potential Actual Illegal Immigration (PAIIP) model has two distinct cases.
This section discusses the building block models for both of them. Building block
models are analogous to blueprints; they are descriptive outlines and maps that provide
both the systems modeler and policy actor with a detailed visual of a systems model. In
this section, the concept, diagram, and units of each case will be presented and will assist
in providing a stronger comprehension of the feedback mechanisms behind the function
and design of the PAIIP model.
IV.3.1 Detention and Deportation Building Block Model Description
(BBM)
The primary purpose behind the application of the Bass Diffusion model to border
security and illegal immigration is to examine the issue of communication and contact
between actual and potential illegal immigrants. Since CLD 1 asserts that an increase in
immigration contact rate (iicr) parameter was embedded into the Detention and
Deportation base case’s design. The border crossivity and iicr policy levers are both key
variables in the PAIIP model’s base case. They may be adjusted to illustrate how the
content of information and contact between actual and potential illegal immigrants
creates and impacts border crossings. Though the argument about the quality of
information and contact between actual and illegal immigrants is not measurable or
quantifiable, the role of the border crossivity and iicr policy levers in the PAIIP model is
to attempt to theoretically simulate the phenomena of information communicated
between actual and potential illegal immigrants.
The values for the border crossivity and iicr are inputted into the PAIIP model,
and they have units of percentage and population per year respectively. While border
crossivity is based on a scale from 0 to 100%, the iicr ranges from 0 to whatever number
a policy actor selects. A border crossivity or iicr value of 0 implies no communication
and results in no illegal activity. However, so long as the iicr is greater than zero, when
the border crossivity policy lever is increased, border crossings occur. The maximum
value of 100% for the border crossivity variable implies that the most reliable and best
information is being provided by the actual illegal immigrant to the potential one. Thus,
an increase in border crossivity represents an increase in the quality of information shared
between actual and potential illegal immigrants; the stronger the content of information is
Causal Loop Diagram 1
Entry of Unauthorized
Immigrant Population Border Crossivity
+
+
Reinforcing Loop I
CLD 2 encompasses the dynamic of apprehension and detention and deportation.
It also asserts the argument that an increase in these policies decreases the entry of illegal
immigrants. In the base case, the border crossivity and iicr variables affect, or are
impacted by, these factors incorporated into the model as stocks, flows, and other policy
levers. Moreover, these additional variables highlighted in CLD 2 provide a foundation
for analysis of the PAIIP model’s behavior and results. Hence, the base case has three
Casual Loop Diagram 2
Entry of Unauthorized
Immigrant Population Border Crossivity +
+ Reinforcing Loop I
Border Patrol Budget
Deportable Aliens Locted By Border Patrol Sector Detention &
Deportation
+
+ +
-Balancing Loop 1
The Potential Illegal Immigrant Population (PIIP), the Actual Illegal Immigrant
Population (AIIP), and the Illegal Immigrant Apprehension Population (IIAP) represent
the stocks of the Detention and Deportation base case. In the PAIIP model’s base case,
Potential Adopters was replaced with the PIIP stock, and Actual Adopters was replaced
with AIIP stock. Given that the SIR model is analogous to the Bass Diffusion model, the
PIIP and AIIP stocks in the PAIIP model’s base case also replace the Susceptible
Population and Infected Population stocks in the SIR model. The units for the PIIP,
AIIP, and IIAP stocks are population. Any value equal to or greater than 0 may be
inputted for them. Thus, the number of border crossings not only depends on border
crossivity and the iicr but also on the size of the AIIP and PIIP.
Each stock in the Detention and Deportation model is connected by a flow. There
Rate (AR), and the Deportation Rate (DR). The units of each flow, BCR, AR, and DR
are population per year. These flow variables are calculated by the PAIIP model. What
determines and affects their behavior are the various policy levers that can be adjusted
during a run or simulation of the model. The primary policy levers that directly affect the
BCR, which in turn is dependent on the size of the AIIP and PIIP, are the border
crossivity, iicr, and Total Population (N).
Like the SIR and Bass Diffusion models, the PAIIP model has a Total Population
policy lever. The Total Population’s value is inputted and adjusted by the user. If this
parameter is set to zero, no activity occurs. Given that the SIR model predicts the
infection rate, and the Bass Diffusion model projects an adoption rate, the power of the
bass model’s incorporation into the PAIIP model is that it enables the calculation,
simulation, and projection of the amount of illegal border crossings based on the total
population of illegal immigrants assumed to be communicating with each other. In
addition, the Bass Diffusion model helps simulate the probability that there will be
sufficient enough information for an attempt at illegal entry into the United States.
Therefore, the rate of illegal entry is captured by the border crossing rate flow variable.
The apprehension rate is a flow and the Illegal Immigrant Apprehension
Population (IIAP) is a stock because “the SIR model’s recovered population is often
termed ‘removals’ and the recovery rate is then called the removal rate” (Sterman, 2000,
p. 304). The apprehension rate has a unit of population per year and flows into the IIAP.
Out of the IIAP is a deportation rate flow because prior to removal or deportation an
illegal immigrant or terrorist must be apprehended and detained prior to deportation. The
may be possible terrorists who are caught, and the deportation rate, which has units of
population per year, has a deportation delay because sometimes it takes a year or more
for an illegal immigrant to be deported.
During a model simulation the apprehension percentage and deportation delay
serve as policy levers that may be adjusted to study the impact on the PAIIP model base
case’s stocks and flows. The Apprehension Rate, AR, has one policy lever, entitled
apprehension percentage. The Deportation Rate has one policy lever entitled deportation
delay. The unit of the deportation delay is year(s).
The driving mechanisms behind the PAIIP model’s cases are feedback loops. For
the Detention and Deportation base case the nature of the loops will be explained. There
are two balancing loops and one reinforcing loop. The first loop is a balancing loop
which is labeled on the model as Depletion of PIIP. As the PIIP increases, the BCR
increases; as the BCR increases, the PIIP decreases. The second loop is a reinforcing
loop entitled Increase in AIIP. As the AIIP increases, the BCR increases; as the BCR
increases the AIIP increases. The third loop is a reinforcing loop, entitled Depletion of
AIIP. As AIIP increases, AR increases. As AR increases, AIIP decreases. These three
loops are the driving force of the base and extended cases. Other notable feedback
elements in the Detention and Deportation model are the AR which feeds into DR, and
the IIAP which feeds back into PIIP via the deportation rate.
The feedback loops in the PAIIP model’s base case support the arguments stated
in CLD 1 and CLD 2. Based on the values inputted into the variables of the PAIIP
model’s cases, the results produced reveal how the content of information communicated
affected by public policies. Therefore, the slightest change in the value of one stock or
policy lever changes the dynamic and behavior of the stocks and rates of the PAIIP
model. For example, increasing or decreasing the apprehension percentage affects all of
the population stocks and rates. Thus, many simulations with various variable inputs
were run for the base case.
PAIIP Model
Base Case #1: Detention and Deportation
Variable Type Units
Potential Illegal Immigrant Population (PAIIP) Stock Population Actual Illegal Immigrant Population (AIIP) Stock Population Illegal Immigrant Apprehension Population (IIAP) Stock Population
Border Crossing Rate (BCR) Flow Population per year
Apprehension Rate (AR) Flow Population per year
Deportation Rate (DR) Flow Population per year
Illegal Immigration Contact Rate (iicr) Policy Lever Population per year
Total Population (N) Policy Lever Population
Border Crossivity (bc) Policy Lever Percentage
Apprehension Percentage Policy Lever Percentage
Base Case #1: Detention and Deportation
Potential Illegal Immigrant Population PIIP
Actual Illegal Immigrant Population AIIP Border Crossing
Rate BCR
Illegal Immigration Contact Rate iicr
Total Population N
Border Crossitivity bc +
Depletion of PIIP Increase in AIIP
+ Illegal Immigrant
Apprehension Population IIAP Apprehension
Rate AR + Depletion of AIIP deportation rate
apprehension percentage deportation delay
IV.3.2 Detention and Deportation with Amnesty Building Block Model
Description (BBM)
The second case is Detention and Deportation with Amnesty. Adding the policy
of amnesty in this case flows right into the argument expressed in CLD 3. The amnesty
rate flow variable, amnesty percentage policy lever, and Amnesty Population (AP) stock
were added to assess their impact on the content of communication between potential and
actual illegal immigrants as well as the border crossing rate. In addition, the border
concept behind the border crossivity due to AP parameter is that as the amnesty
population increases, the border crossivity variable should increase because word would
be spreading that the United States is granting amnesty to illegal immigrants. Likewise,
as the Amnesty Population decreases, the border crossivity parameter should decrease.
Causal Loop Diagram 3
Entry of Unauthorized
Immigrant Population Border Crossivity +
+ Reinforcing Loop I
Border Patrol Budget
Deportable Aliens Locted By Border Patrol Sector Detention &
Deportation
+
+ +
-Balancing Loop 1 Border Security
+
-Balancing Loop 2
Delay attributed to policy cycle in response to border security and illegal immigration, and the implemenation of legislation that comes from
Congress such as Amnesty Proposals.
The AP has units of population. Like the other three population stock variables,
the AP’s initial value may be set by the policy actor. Out of the AIIP stock is an
Amnesty rate flow variable which has units of population per year. The amnesty rate is
calculated by the PAIIP model, but it is directly influenced by the amnesty percentage
policy lever that it is connected to it. The amnesty percentage is inputted by the policy
actor between the values of 0 to 100%. The amnesty rate flows into the AP stock. The
border crossivity due to AP feeds back into the border crossivity variable which feeds