This is a repository copy of Sperimagnetism in Fe(78)Er(5)B(17) and Fe(64)Er(19)B(17) metallic glasses: II. Collinear components and ferrimagnetic compensation .
White Rose Research Online URL for this paper: http://eprints.whiterose.ac.uk/43685/
Article:
Cowlam, N. and Wildes, A.R. (2011) Sperimagnetism in Fe(78)Er(5)B(17) and Fe(64)Er(19)B(17) metallic glasses: II. Collinear components and ferrimagnetic compensation. Journal of Physics: Condensed Matter, 23 (49). Art no. 496005. ISSN 0953-8984
https://doi.org/10.1088/0953-8984/23/49/496005
[email protected] https://eprints.whiterose.ac.uk/
Reuse
Unless indicated otherwise, fulltext items are protected by copyright with all rights reserved. The copyright exception in section 29 of the Copyright, Designs and Patents Act 1988 allows the making of a single copy solely for the purpose of non-commercial research or private study within the limits of fair dealing. The publisher or other rights-holder may allow further reproduction and re-use of this version - refer to the White Rose Research Online record for this item. Where records identify the publisher as the copyright holder, users can verify any specific terms of use on the publisher’s website.
Takedown
If you consider content in White Rose Research Online to be in breach of UK law, please notify us by
promoting access to White Rose research papers
White Rose Research Online [email protected]
Universities of Leeds, Sheffield and York
http://eprints.whiterose.ac.uk/
This is an author produced version of a paper published in Journal of Physics: Condensed Matter.
White Rose Research Online URL for this paper:
Published paper
Cowlam, N., Wildes, A.R. (2011) Sperimagnetism in Fe(78)Er(5)B(17) and
Fe(64)Er(19)B(17) metallic glasses: II. Collinear components and ferrimagnetic compensation, Journal of Physics: Condensed Matter, 23 (49), Article no.
496005
1
Sperimagnetism in Fe
78Er
5B
17and Fe
64Er
19B
17metallic glasses.
II – Collinear components and ferrimagnetic compensation.
N Cowlama and A R Wildesb
a
Department of Physics and Astronomy, University of Sheffield, SHEFFIELD, S3 7RH, U.K,
b
Institut Laue-Langevin, BP 156, 6 rue jules Horowitz, 38042 GRENOBLE Cedex 9, France,
Abstract.
Magnetisation measurements on a Fe64Er19B17 glass and polarised beam neutron scattering
measurements on Fe78Er5B17 and Fe64Er19B17 were described in Part I. The finite spin-flip
neutron scattering cross-sections were calculated using a sperimagnetic structure based on
random cone arrangements of the magnetic moments. The temperature variation of the
cross-sections of Fe64Er19B17 suggested that a compensated sperimagnetic phase existed at Tcomp.
The analysis of the non spin-flip neutron scattering cross-sections is described here in Part
II. Two spin-dependent total structure factors S±±
( )
Q were defined from these cross-sections and despite the limited range of the data 0.5Å-1 < Q < 6.5Å-1, their Fourier transform gavereliable spin-dependent Radial Distribution Functions RDF±±
( )
r . These were interpreted interms of the atomic pair correlation functions ρAB±±
( )
r and their weighting factors ω±AB±. The data on Fe64Er19B17 at 1.5K showed for example, how the directions of the magneticsublattices can be defined uniquely. The analysis of the RDF±±
( )
r for Fe64Er19B17 at 112Kconfirmed that the mean collinear components of the magnetic moments ||
Er
µ , ||
Fe
µ are
zero on both sublattices in the compensated sperimagnetic structure at Tcomp. The pre-peak in
the spin-dependent total structure factors at 112K showed that it originated in the atomic
structure and it may involve Fe-Er-Fe “collineations” at a radial distance of ≈ 6.0Å. Finally,
the RDF±±
( )
r of Fe64Er19B17 at 180K and of Fe78Er5B17 at 2K, show that both glasses have2 1) Introduction
Our studies of the collinear and non-collinear magnetic structures in metallic glasses [1] were
described in Part I [2], where it was explained that the non spin-flip neutron scattering
cross-sections of (Fe,Tb)83B17 glasses had been simulated using a combination of known and
derived partial structure factors [3]. The related (Fe,Er)83B17 glass have been shown to be a
non-collinear ferrimagnets by a variety of different measurements [4, 5, 6, 7, 8], but our
preliminary neutron scattering measurements on a Fe64Er19B17 glass at 1.5K, 60K and 180K
proved to be difficult to interpret [9]. The finite spin-flip cross-sections confirmed the
presence of a non-collinear state and could be analysed using a sperimagnetic structure in
which the magnetic moments on the iron atoms point in a random cone that is
ferrimagnetically coupled to a random cone of erbium moments. However, the non spin-flip
cross-sections were quite different from those of the parental TM83met17 glasses and strongly
influenced by the 19% substitution of the large erbium ion with its large magnetic moment
[9]. They could not be simulated by the method applied to the collinear (Fe,Tb)83B17 glasses
[3].
The average components of the magnetic moments µ||,µ⊥, parallel and perpendicular to the
magnetic field are needed to describe the non spin-flip and spin-flip cross-sections
respectively [1], so the variation of the magnetic moments must be known as a function of
composition and temperature. In addition, there will be many different combinations of the
values of the total moments µFe , µEr and the semi-vertex angles Fe, Er of their random
cones in a non-collinear structure, which will lead to similar values of the µ|| and µ⊥
components. It is difficult therefore, to find the unique choice of the components of the
moments, even from a combination of different bulk measurements [4, 5, 6, 7, 8]. The aims
of Part I of the present work were first to obtain magnetic moment values from
magnetisation data on our own Fe64Er19B17 glass, which we could use more confidently in the
analysis of the neutron scattering. The neutron studies were also extended to include a second
series of measurements on a Fe78Er5B17 glass at 2K and on the Fe64Er19B17 glass at 100K,
112K, 125K and again at 180K, as a consistency check. Part II will give an account of the
ferrimagnetism in Fe78Er5B17 glass at low temperature and of the magnetic structural changes
that occur in Fe64Er19B17 glass as a function of temperature. Sections 2 and 3 will cover the
3
successful description of the atomic-scale structures in the two glasses, which works even
when the magnetic contributions to the neutron scattering are small, such as when
concentration of erbium is small (in Fe78Er5B17 at 2K) or at higher temperatures (in
Fe64Er19B17 at 180K). The analysis of the scattering cross-sections by a Fourier transform
involves no adjustable parameters, since the cross-sections were measured in absolute units
and it relies solely on the values of the magnetic moments obtained in Part I.
2.0) The non spin-flip cross-sections of the (Fe,Er)83B17 glasses.
The two non spin-flip cross-sections are given in the usual notation in Equation 1 where bi is
the average coherent scattering length of atom i and
Ω ∂ ∂σII
is the isotope incoherent
cross-section. Equation 1 may be compared with the spin-flip cross-sections given in Equation 6 in
Part I.
( )
(
)
(
j j( )
)
(
( )
i j)
ij i i NSI II r r iQ Q p b Q p b − + Ω ∂ ∂ + Ω ∂ ∂ = Ω ∂ ∂ ±±∑
. exp 31 || * ||*
σ σ
σ
. (1)
The non spin-flip cross-sections contain the collinear components p||
( )
Q of the magnetic scattering amplitude. They have a variation with scattering vector Q which is similar to thetotal structure factor S(Q) of the glass, since they depend on the Fourier transform of spatial
variation of either the sum
(
||( )
)
2Q p b FT + ∝ Ω ∂ ∂σ−−
or the difference
( )
(
||)
2Q p b FT − ∝ Ω ∂ ∂σ++
of the nuclear and magnetic scattering amplitudes.
Figure 1 shows the non spin-flip cross-sections in absolute units of barns steradian-1 atom-1
for the Fe78Er5B17 glass measured at 2K and for Fe64Er19B17 measured at 1.5K, 60K, [9] and
100K, 112K, 125K, 180K. Only the present measurement at 180K has been plotted, as in
. The red and the blue points define the
Ω ∂ ∂σ−−
and
Ω ∂ ∂σ++
cross-sections respectively.
Two spin-dependent total structure factors S−−
( )
Q and S++( )
Q will be defined from these cross-sections in Section 2.1, so the peak in the cross-sections at Q ≈ 3Å-1 will be called the4
follows the usual practice for the structure factors of metallic glasses. The large differences
between the
Ω ∂ ∂σ−−
and
Ω ∂ ∂σ++
[image:6.595.95.455.89.712.2]cross-sections in Figure 1 arise because the combined
Figure 1 The non spin-flip cross-sections for the Fe78Er5B17 glass at 2K are shown in 1a and
5 1g[9]. The red and blue points define the
Ω ∂ ∂σ−−
and
Ω ∂ ∂σ++
cross-sections and the open and
closed points are for incident wave vectors ki = 2.662 -1, ki = 4.1 -1. The incoherent
cross-section is shown by a dashed line.
scattering amplitudes have a very large range of both positive and negative values, depending
on how the scattering from the nucleus and from the magnetic electrons combine [10]. The
nuclear scattering amplitudes are
bFe = 9.45fm, bEr = 7.79fm and bB = 5.30 – 0.213i fm [11]
and substituting the moment values at 1.5K µFe|| =1.52µB and µEr|| =6.58µB into
( )
Q f( )
Qp|| =2.695µ|| fm, gives the magnetic scattering amplitudes of p||Fe
( )
0 =4.10fm and( )
0 17.73|| =
Er
p fm in the forward limit Q =0, so that,
( )
(
0)
13.55fm fm35 .
5 < bFe p||Fe < and −9.94fm<
(
bEr p||Er( )
0)
<25.52fm.In Figure 1, the difference in position of the first peak in the
Ω ∂ ∂σ−−
and
Ω ∂ ∂σ++
cross-sections of Fe64Er19B17 at 1.5K, 60K and 100K is large ≈ 0.5Å-1 and the pre-peak occurs in
Ω ∂ ∂σ++
. The shapes of these cross-sections and the positions and widths of their peaks remain
fairly constant and there is a reduction in the first peak in
Ω ∂ ∂σ−−
and the pre-peak with
increasing temperature. In contrast, the
Ω ∂ ∂σ−−
and
Ω ∂ ∂σ++
cross-sections have interchanged
at 125K and 180K, when compared with those at low temperatures and this is shown clearly
in the figure. The two first peaks in
Ω ∂ ∂σ−−
and
Ω ∂ ∂σ++
have also moved closer together; their
magnitudes have reduced and the first peak in
Ω ∂ ∂σ++
is the smallest. The pre-peak (in
Ω ∂ ∂σ−−
) is also smaller than the corresponding peak at T ≤ 100K. The interchange of cross-sections
shows that there is a complete inversion of the magnetic structure between 100K and 125K.
Comparison with the cross-sections of the (Fe,Tb)83B17 collinear ferrimagnets [3] suggests
that at high temperatures the iron sublattice points along the field direction and the erbium
sublattice is antiparallel to it ( Fe : Er ) and the inverted case ( Fe : Er ).
6
The constancy of shape of these cross-sections with temperature was monitored by
superimposing the
Ω ∂ ∂σ++
at 125K on to the
Ω ∂ ∂σ−−
at 100K and the
Ω ∂ ∂σ++
at 100K on to the
Ω ∂ ∂σ−−
at 125K. The mean fractional differences in the data points in the superimposed
cross-sections was less than ≈ 10%, - which is commensurate with the differences in the total
scattering levels and in the ωAB++ and ω−AB− weighting factors (see below) at the two
temperatures.
The
Ω ∂ ∂σ++
and
Ω ∂ ∂σ−−
cross-sections measured at 112K are quite different from the others
because they are virtually identical within the error bars, (except perhaps for four points near
the pre-peak). Their first peak reaches ≈ 1.8 barns steradian-1 atom-1 and is slightly smaller
than the first peak in the cross-sections measured at 100K and 125K. The pre-peak at Qpp ≈
1.3Å-1 occurs in both
Ω ∂ ∂σ++
,
Ω ∂ ∂σ−−
cross-sections with a height ≈ 0.75 barns steradian-1
atom-1 and the second peak has no shoulder. Equation 1 and Figure 5 of show that the
Ω ∂ ∂σ++
and
Ω ∂ ∂σ−−
cross-sections will be identical when the mean collinear components of
the magnetic scattering amplitude tend to zero,
( )
Qp|| 0, so that
(
bp||( )
Q)
2 → b2 .They will then contain information about the atomic structure of the glass, because they
depend on the nuclear neutron scattering alone.
The
Ω ∂ ∂σ++
and
Ω ∂ ∂σ−−
cross-sections for the Fe78Er5B17 glass measured at 2K are shown in
Figure 1a. They are similar to some of the first spin-dependent cross-sections which were
measured for metallic glasses, such as Co81P19 [12], Co81.5B18.5 [13] and Fe83B17 [14] and also
to the non spin-flip cross-sections of some of the (Fe,Tb)83B17 glasses [3]. The first peak in
Ω ∂ ∂σ−−
is much larger than that in
Ω ∂ ∂σ++
and there is a clear difference in their positions. The
Ω ∂ ∂σ−−
cross-section also includes a very small pre-peak. The form of these
Ω ∂ ∂σ−−
7
Ω ∂ ∂σ++
cross-sections suggests that the Fe78Er5B17 glass has the ( Fe : Er ) magnetic
structure at 2K.
2.1)
-Two spin-dependent total structure factors S−−
( )
Q and S++( )
Q can be defined from the non spin-flip cross-sections and their Fourier Transform will in principle, provide information onthe real space structures of the (Fe,Er)83B17 glasses. Initially, we did not believe it was
realistic to try this because of the limited range 0.5Å-1 < Q < 6.5Å-1 of the IN20 data. It is
smaller than the range 1Å-1 < Q < 12Å-1 used in the first polarised neutron scattering
determination of the PSFs of the Co81P19 alloy [12] and its maximum value is much smaller
than the Qmax ≈ 25Å-1 used in current studies of the structures of metallic glasses. An
alternative is to make a simulation of the non spin-flip cross-sections by using known partial
structure factors (PSF) and derived PSFs when the required ones are unavailable. This
worked well for (Fe,Tb)83B17 glasses and correctly predicted the difference in the positions of
the first peak in four pairs of non spin-flip cross-sections [3]. There are however, no PSFs
which can generate the pre-peak in the non spin-flip cross-sections of the Fe64Er19B17 glass,
even after scaling their Q axis [9]. It seemed worthwhile therefore, to try a Fourier transform
beginning with the non spin-flip cross-sections of the Fe64Er19B17 glass at 1.5K which have
the largest contribution from the magnetic scattering.
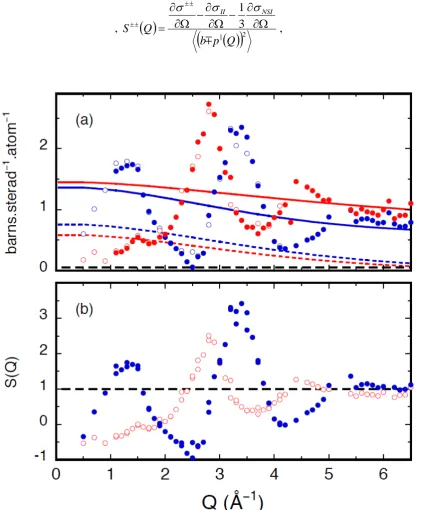
The derivation of the spin-dependent total structure factors is illustrated in Figure 2. The
calculated total scattering levels (per atom)
(
||( )
)
2Q p
b are superimposed on the measured
cross-sections in Figure 2a. The Q-dependence of the these levels is from the magnetic form
factors within the p||
( )
Q terms, described using the same seven parameter fits to the form factors of the Fe3+ and Er3+ ions [15] as in . Note that the two levels have similar valuesin the forward limit
(
||( )
)
20
p
b+ = 1.46 barns steradian-1 atom-1 :
(
||( )
)
20
p
b− = 1.41 barns
steradian-1 atom-1 and both decrease towards, b2 = 0.722 barns steradian-1 atom-1 at high
Q. The measured cross-sections are greater than the total scattering level at some values of Q
and less than it at others as expected. This Figure illustrates the crucial first step in the
derivation of the spin-dependent structure factors, because the superposition of the calculated
8
absolute units. There are no adjustable parameters in these calculations, because the values of
the b’s are tabulated [11] and the pFe
( )
Q||
[image:10.595.85.509.174.685.2], pEr||
( )
Q components have already been fixed inTable 1 of .
The two spin-dependent structure factors can be defined by
,
( )
( )
(
||)
23 1
Q p b Q
S
NSI II
Ω ∂ ∂ − Ω ∂ ∂ − Ω ∂ ∂ =
± ±
± ±
σ σ
σ
, (2)
Figure 2 The non spin-flip cross-sections of the Fe64Er19B17 glass at 1.5K are replotted in
9
spin-dependent total structure factors S−−
( )
Q and S++( )
Q derived from these cross-sections are shown in Figure 2b.but it is more convenient to normalise them on the coherent, rather than the total scattering,
( )
(
( )
)
(
( )
)
( )
(
||)
22 || 2 || 3 1 Q p b Q p b Q p b Q S NSI II − − Ω ∂ ∂ − Ω ∂ ∂ − Ω ∂ ∂ = ± ± ± ± σ σ σ
. (3)
The term in square brackets is the (Laue-type) disorder scattering which arises from the
presence of two (or more) different atoms in the sample, - which here also have different
values of magnetic moment. Subtracting the Laue-type scattering level, which is also shown
in Figure 2a, and using Equation 3, allows the Faber-Ziman PSFs SAB(Q) [16] to be used to
describe the atomic (AB) pair correlations in the glass,
( )
(
b p Q)
S( )
Q c c(
bA pA( )
Q(
bB pB( )
Q)
)
SAB( )
QAB B A || || 2 ||
±± =
∑
. (4)Here cA cB are the concentrations, so that,
S±±
( )
Q =ωFeFe±± SFeFe( )
Q +ωFeB±±SFeB( )
Q +ωBB±±SBB( )
Q +( )
Q S( )
Q S( )
QSFeEr ErB ErB ErEr ErEr FeEr ± ± ± ± ±
± +ω +ω
ω . (5)
The ω±AB± weighting factors are of the form,
( )
(
)
( )
2|| 2 || 2 Q p b Q p b cA A A
AA = ± ±
ω and,
( )
(
)
(
( )
)
( )
2|| || || 2 Q p b Q p b Q p b c
cA B A A B B
AB = ± ±
ω . (6)
Figure 2b shows the two spin-dependent total structure factors S−−
( )
Q and S++( )
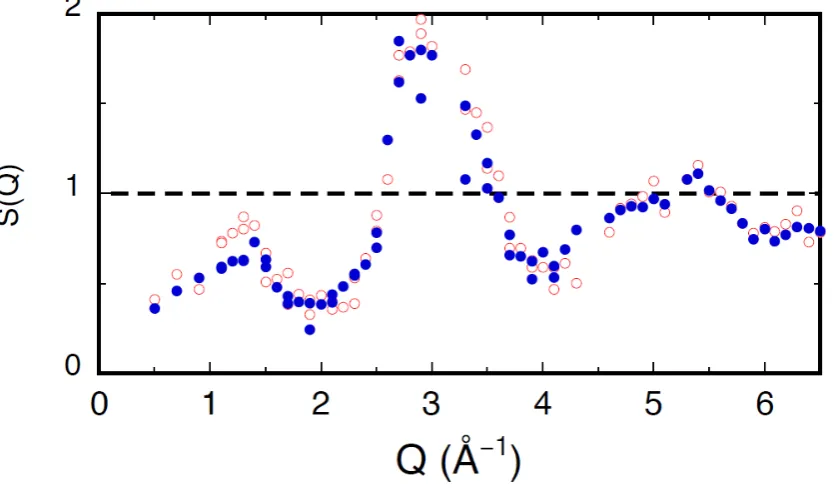
Q obtained by calculating the total and Laue-type scattering at the same Q values as the datapoints in the non spin-flip sections. They are shown with the same coding as the
cross-sections. The S−−
( )
Q structure factor is of conventional form, with a broad first peak at Q1 = [image:11.595.143.493.153.204.2]2.8Å-1 and (possibly) a second peak at Q2 ≈ 4.6Å-1. It is similar to the SFeFe(Q) shown in
Figure 3 of [9]. The S++
( )
Q structure factor has its pre-peak at Qpp = 1.3Å-1; a first peak atQ1 = 3.3Å-1 and possibly a second peak at Q2 ≈ 5.3Å-1. It resembles the SNiNi(Q) shown in
10
different, Q1 Qpp ≈1.60 for SNiNi(Q ) and Q1 Qpp ≈2.54 for S
( )
Q+ +
. This difference
confirms that it is not possible to simulate the non spin-flip cross-sections of the (Fe,Er)83B17
glasses even when using those PSFs from the earlyTM-lateTM glasses which contain
pre-peaks.
2.2) Spin-dependent Radial Distribution Functions
The Fourier transform of the S±±
( )
Q total structure factors gives (spin-dependent) reducedradial distribution functions G±±
( )
r( )
=∫
(
±±( )
−)
( )
± ±
max
0
sin 1 2
Q
dQ Q M Qr Q
S Q r
G
π , (7)
where M(Q) is a modification function, often of the form exp(-B Q2), which reduces the
effect of the finite value of Qmax in the Fourier transform. The corresponding Radial
Distribution Functions RDF±±
( )
r are,( )
( )
( )
02 2
4
4πr ρ r rG r πr ρ
r
RDF±± = ±± = ±± + , (8)
where 0 is the mean atomic number density. The Fourier transform was made with an
in-house program with summations over the 75 data points for 0 < Q < 6.5Å-1 and 80 points in
r with intervals of r = 0.1Å for 0 < r < 4Å and r = 0.3Å for 0 < r < 16Å, using M(Q) = exp(-0.05Q2). When a structure factor S(Q) has been defined 100% correctly, the resulting
G(r) will be linear at small values of r where ρ±±
( )
r =0 and follow −4πρ0r. This was found to be the case for the Fe64Er19B17 glass at 1.5K and 180K, with slightly less goodbehaviour for Fe64Er19B17 at 112K and Fe83Er5B17 at 2K. The so-called “termination ripples”
which appear in the G±±(r) at small r can be reduced by refining the levels S(Q) = 0 and S(Q) = 1 [17], but since no adjustable parameters had been introduced so far, this was not
attempted. In fact, all the Fourier Transforms give a sufficiently clear picture of the structures
of these glasses without the need for modification, as will be shown below.
3.0 B glass at 1.5K.
Figure 3 shows the two functions RDF++
( )
r and RDF−−( )
r and are plotted over 0 < r <11
− −
1
r = 3.11Å in RDF−−
( )
r . This difference is consistent with the positions of the first peaks in their respective structure factors.There is a large difference in the depth of the minimum after the first peak in the two RDFs,
which is a real effect, since the two structure factors have the same value of Qmax and their
RDFs have the same resolution in real space. The minimum in RDF++
( )
r actually goes slightly negative for just two points near r ≈ 3.3Å and this will be discussed below. The firstminimum in RDF−−
( )
r is so shallow that the half-width of the first peak cannot be measuredeasily, - although it is about twice the width of the first peak in RDF++
( )
r , ∆r1++ ≈ 0.9Å.This also makes the coordination number n1−− more difficult to obtain, except by measuring the area to the maximum of the first peak and doubling it, or by gradually removing the
modification function M(Q) from the Fourier transform to improve the resolution. These two
methods converge towards the values n1−− ≈ 12.0 and n1++ ≈ 10.5 and the first of these is consistent with dense packing in a metallic glass.
The expected first neighbour correlations in the (Fe,Er)83B17 glasses can be depicted by
superimposing the familiar “stick diagrams” on to the first peak in the RDFs. Six atomic pair
correlation functions ρAB±±
( )
r contribute to the RDF of the ternary (Fe,Er)83B17 glassesthrough a relation similar to Equation 5,
RDF±±
( )
r =4πr [ωFeFe±± ρFeFe( )
r +ωFeB±±ρFeB( )
r +ωBB±±ρBB( )
r +2
( )
r ErB ErB( )
r ErEr ErEr( )
r ]FeEr
FeErρ ω ρ ω ρ
ω±± + ±± + ±±
. (9)
12
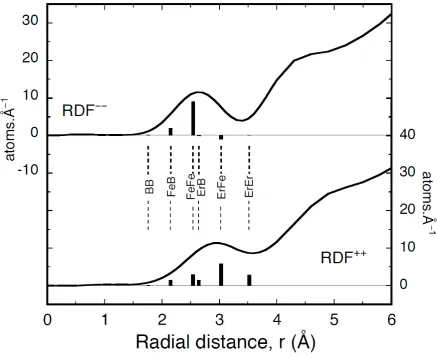
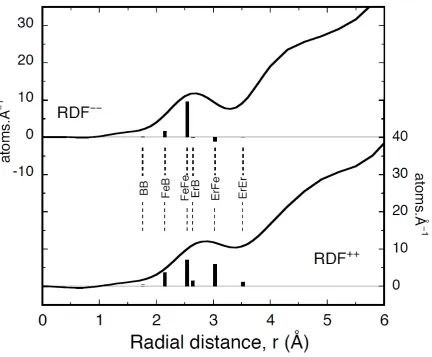
Figure 3 The spin-dependent radial distribution functions RDF−−
( )
r , RDF++( )
r of the Fe64Er19B17 glass at 1.5K are plotted over the range 0 < r < 6Å to illustrate the first neighbourpeak. The stick diagrams were drawn with the ωAB±± weighting factors from Table 1 corresponding to the ( Fe DOWN : Er UP) structure.
“sticks” were obtained from the Goldschmidt radii of iron and erbium and the tetrahedral
covalent radius of boron and are given in Table 1. The probability of finding an atom at a
given point is proportional to its concentration when the structure of a glass is random. The
± ±
AB
ω weighting factors contain the concentrations of the species and their scattering
amplitudes, so with a suitable multiplying factor, they can define the height of each stick in
the case of a disordered structure. The values of the ω±AB± are given in Table 1 for two
different configurations of the magnetic structure, with the iron sublattice pointing along the
magnetic field direction, ( Fe : Er ) and the inverted case ( Fe : Er ). The
magnetic scattering amplitude of erbium pEr||
( )
Q is so large that(
bEr−p||Er( )
Q)
and the ωErB and ωErFe weighting factors are negative, as discussed in Section 2.0. These positive and [image:14.595.82.519.82.441.2]13
and the shape of the first peak in the RDF++
( )
r and RDF−−( )
r . Table 1 shows that whenthe magnetic structure inverts and the pFe
( )
Q||
, pEr||
( )
Q both change sign, then the six ω+AB+ and− −
AB
ω factors just exchange their values.
± ±
AB
ω weighting factors for Fe64Er19B17 at 1.5K
Magnetic structure
FeDOWN ErUP
Magnetic structure
FeUP & ErDOWN
Pair correlatio
n
rAB
in Å for RDF
( )
r− −
(b+p) type
for RDF++
( )
r(b-p) type
for RDF−−
( )
r(b+p) type
for
( )
r RDF++(b-p) type
B-B 1.76 0.010 0.014 0.014 0.010
Fe-B 2.15 0.074 0.260 0.260 0.074
Fe-Fe 2.54 0.142 1.245 1.245 0.142
Er-B 2.64 0.103 -0.054 -0.054 0.103
Fe-Er 3.03 0.396 -0.519 -0.519 0.396
Er-Er 3.52 0.275 0.054 0.054 0.275
Table 1 The interatomic pair distances rAB are given in ascending order with the AB
weighting factors calculated for the Fe64Er19B17 at 1.5K, which are required to draw the “stick
diagrams” on the first neighbour peak in the RDF−−
( )
r and RDF++( )
r radial distribution functions. The two columns of the ω+AB+ and ωAB−− weighting factors interchange when the magnetic structure is inverted and pFe( )
Q||
, pEr||
( )
Q both change sign.The stick diagrams calculated with the “correct” magnetic structure at 1.5K, ( FeDOWN : Er
UP) superimposed on the appropriate RDF−−
( )
r , RDF++( )
r curves in Figure 3. The firstpeak of the RDF−−
( )
r provides a good envelope of the six first neighbour sticks and sincethey are all positive the coordination number (n1−− ≈ 12.0) derived from this peak should be correct. The dominant Fe-Er correlations at rFeEr = 3.03Å determine the first neighbour
distance r1−− = 3.11Å, while the strong Er-Er correlations at rErEr = 3.52Å lift the RDF−−
( )
rcurve in the region of its first minimum as observed. The dominant correlations in the
( )
rRDF++ curve are rFeFe at 2.54Å, which determine the first neighbour distance r1++ =
2.43Å. More significantly the negative ωErB++ and ωErFe++ create the deep first minimum in the
( )
rRDF++ at r ≈ 3.3Å which was described above. The Er-Er first neighbour correlations are
[image:15.595.69.528.157.387.2]14
region. These negative contributions from ωErB++ and ωErFe++ reduce the position of the first
neighbour peak r1++ ; its half-width and its coordination number n1++ as observed. Intuitively,
it seems unphysical that the RDF++
( )
r could be negative near the deep first minimum.However, Equation 9 shows that the two RDF±±
( )
r curves are a weighted sum of the sixatomic pair correlation functions ρAB±±
( )
r . If one of the ω±AB± weighting factors is very largeand negative, the RDF±±
( )
r can also be negative in the region of the associated rAB.It is necessary to imagine that the two sets of stick diagrams have been interchanged in Figure
3 (as the ω+AB+ are in Table 1) to show that the alternative magnetic structure ( Fe UP : Er
DOWN) is inappropriate for the Fe64Er19B17 glass at 1.5K. Interchanging the sticks means that
the maximum of the first peak in the RDF−−
( )
r curve would occur at the same radial distance as the strong negative Fe-Er correlations at rFeEr = 3.03Å. The overall peak shape would alsobe incompatible with the positive Fe-Fe correlations at rFeFe = 2.54Å and the shallow first
minimum would be inconsistent with the weak Er-Er correlations at rErEr = 3.52Å. Equally,
for the RDF++
( )
r curve, the strong positive Er-Er and Er-Er correlations would coincide with the deep first minimum and the weaker Fe-Fe and Er-B correlations would fail to describe themaximum of the first peak at the shorter distance of r1++ = 2.43Å.
Superimposing the stick diagrams of the “correct” magnetic structure on to the RDF−−
( )
r ,( )
rRDF++ functions gives an excellent description of the first neighbour peaks which suggests that the structure of the glass must be (to a first approximation) fairly random. These
calculations were extended to three more cases which will be presented in the Sections
below. Attempts were also made to improve the description of the first peak profile by
replacing the “sticks” with Gaussian functions. It proved difficult to select the half-widths of
the Gaussians to give a smooth first peak, without having to introduce a convolution to
imitate the instrumental resolution. It was also unclear whether the six (AB) atomic pair
correlation functions should have the same values of half-width or different ones. The
Gaussian functions appeared to offer no significant improvement over the stick diagrams and
involved substantially more work.
3.2 ||
Fe
µ ||
Er
15
Initially, the two spin-dependent total structure factors S±±
( )
Q were derived from the nonspin-flip cross-sections
Ω ∂ ∂σ±±
at 112K using the moment values µFe|| =1.13µB and
B Er µ
µ || =−3.79 which came from the calculations of the spin-flip cross-sections in Part I.
The two S±±
( )
Q were similar in form, except that the heights of the features were greater inthe S−−
( )
Q . The Fourier Transform of the two structure factors was made using the stepsdescribed in Section 2.2. The resulting RDF−−
( )
r , RDF++( )
r were obviously similar andboth had a well-defined first peak at r1 ≈ 2.7Å. The ωAB±± weighting factors calculated with
the µFe|| =1.13µB and µEr|| =−3.79µB moment values are given in Table 2. These created the
problem of having two different sets of stick-diagrams to describe the virtually identical first
peaks in the two RDF±±
( )
r . The mean values ω±AB± of the weighting factors for the ( FeUP: Er DOWN) and ( Fe DOWN : Er UP) configurations were therefore used to imitate a
magnetic structure which might consist of equal volumes of these two configurations at Tcomp.
They are also given in Table 2 and their “sticks” provided a much better representation of the
first peak in the two RDF±±
( )
r .It was explained in Section 3.2 of that the magnetic moment values which were used
to calculate the spin-flip cross-sections at 112K, were already different from those obtained
from the general variation of the magnetisation with temperature. Figure 5 of also
showed that the temperature variation of the
(
||( )
)
2Q p
b+ ,
(
||( )
)
2Q p
b− combined scattering
amplitudes could be interpreted by the conditions, µFe|| and pFe|| →0 and 0
||
|| →
Er Er p
µ at
± ±
AB
ω possible weighting factors for Fe64Er19B17 at 112K
The magnetic structure is
||
Fe
µ 1.13 B UP
||
Er
µ - 3.79 B DOWN
Mean values
± ±
AB
ω for
||
Fe
µ 1.13 B ||
Er
µ -3.79 B
No moment
||
Fe
µ = 0.0 B
||
Er
µ = 0.0 B ± ± AB ω identical Pair correlation rAB in Å
( )
r RDF−−(b+p) type
( )
r RDF++(b-p) type
B-B 1.76 0.011 0.011 0.011 0.011
Fe-B 2.15 0.202 0.104 0.153 0.153
Fe-Fe 2.54 0.896 0.235 0.566 0.515
Er-B 2.64 -0.011 0.087 0.038 0.038
16
Er-Er 3.52 0.003 0.164 0.084 0.031
Table 2 Three sets of the AB weighting factors which were used to draw the “stick
diagrams” on the first peak of the RDF−−
( )
r , RDF++( )
r functions of Fe64Er19B17 at 112Kare given. The first two sets are calculated with the moment values ||
Fe
µ = 1.13 B, µEr|| = -
3.79 B from Part I; the third set is their mean value and the fourth set with µFe|| =
||
Er
µ = 0.0 B is calculated from the b values alone.
112K which describe a compensated sperimagnetic phase at Tcomp. A second derivation of the
( )
QS±± structure factors was therefore made using the conditions from Section 3.2 of Part I,
B Fe µ
µ =1.65 , 2 Fe = 360º with µEr =7.2µB, 2 Er = 360º.
This was different from the example shown in Figure 2a, because there is no Q dependence
of the total scattering and Laue-type scattering levels which are horizontal lines at 0.722
barns steradian-1 atom-1 and 0.024 barns steradian-1 atom-1 respectively. The S±±
( )
Q structure factors from this derivation are shown in Figure 4 and have a pre-peak, an asymmetrical firstpeak and a second peak without a shoulder. Even though they contain information about the
atomic structure alone, they are not expected look like the S(Q) of the parental TM83met17
glasses at such high erbium concentration. Rather unexpectedly they resemble the structure
factor of the high boron glass 60Ni64B36 [18]
The pre-peak which occurs in both S±±
( )
Q structure factors must originate from the atomicstructure alone when the conditions pFe|| and pEr|| =0 apply. Using the relation
pp pp
Q
r 2π
4 5
=
17
Figure 4 The two spin-dependent total structure factors S±±
( )
Q derived from theΩ ∂ ∂σ±±
cross-sections of the Fe64Er19B17 glass at 112K, under the conditions pFe||
( )
Q and pEr||( )
Q =0are shown.
neighbour erbium atoms ≈ 1.7 × 3.54Å in a glassy structure. However, erbium -erbium
correlations will not be very visible because the ErEr weighting terms are small (see Table
2). “Collineations” of Fe-Er-Fe neighbours which will occur at a distance of 6.06Å are better
candidates. These “collineations” were first identified by Bernal in his DRPHS models [20]
and also discussed by Cargill [21]. Below Tcomp the pre-peak is large in S++
( )
Q and is absentfrom S−−
( )
Q , so it must be associated with atomic AB pair correlations for which ωAB++ islarge and ωAB−− is small. Table 1 shows that Fe-Fe correlations are good candidates which
could involve Fe-Er-Fe “collineations”.
The average RDF±±
( )
r derived from the two S±±( )
Q is shown Figure 5. Thestick-diagrams calculated under the conditions pFe|| and pEr|| =0 are superimposed onto the first
peak and the ωAB±± weighting factors are given in Table 2. They are similar to the ωAB±±
values except for ωFeEr and ωErEr. The six first neighbour sticks calculated with this
configuration are all positive and the first peak in the RDF±±
( )
r provides a satisfactory18
Figur e 5 The mean radial distribution function RDF±±
( )
r for the Fe64Er19B17 glass at112K is shown. The stick diagrams for the conditions µFe|| and pFe|| =0 ; and 0
||
|| =
Er Er p
µ
which describe a compensated sperimagnetic state at Tcomp are superimposed on the first peak.
The position of this first peak r1 = 2.75Å in the RDF±±
( )
r is determined by the dominantFe-Fe and Fe-Er correlations at 2.54Å and 3.03Å respectively. It is 5% greater than the
weighted mean first neighbour distance in Fe64Er19B17 at this temperature and similar to the
average (<r1> = 2.77Å) of the two values r1++ = 2.43Å, r1−− = 3.11Å measured at 1.5K. The
coordination number was obtained from the area up to the maximum of the first peak, since
the first minimum in the RDF±±
( )
r remains at about the half peak height. The value of n1 =12.3 is also consistent with n1−− = 12.0 at 1.5K. Unfortunately, this RDF±±
( )
r does notprovide any positive evidence of any “collineations” at r ≈ 6.0Å. When plotted on an
extended scale, the positions of its maxima are at 2.75Å, 4.9Å, 7.0Å and 9.4Å, so that r ≈
6.0Å lies between the second and third of these. This minimum is actually quite shallow and
this may be consistent with the fact that the pre-peak is sufficiently weak (S
( )
Qpp ≤1.0) at [image:20.595.85.513.89.308.2]19
3.2 B above T 5B
The two spin-dependent total structure factors S++
( )
Q , S−−( )
Q and their associated( )
rRDF++ , RDF−−
( )
r were also obtained from theΩ ∂ ∂σ++
,
Ω ∂ ∂σ−−
cross-sections of the
Fe64Er19B17 glass at 180K and of Fe78Er5B17 at 2K. The contributions from the magnetic
neutron scattering are smaller in these cross-sections, because of the higher temperature and
the reduced concentration of erbium respectively. It was of interest to see whether the
expected magnetic structure ( FeUP : ErDOWN), could be identified effectively in these two
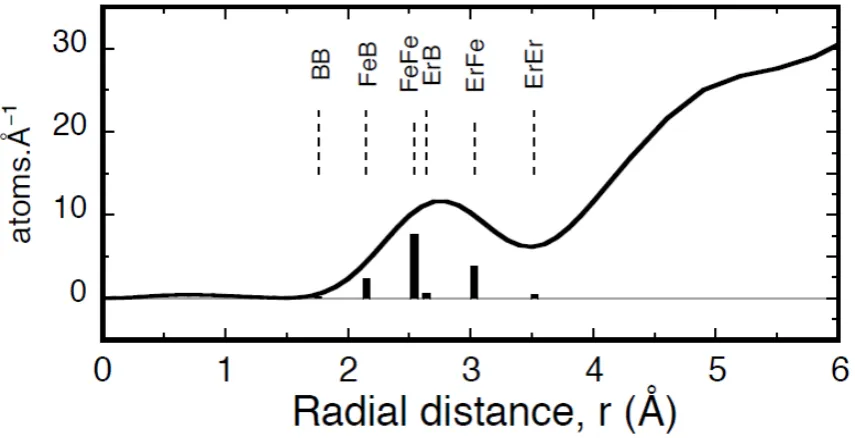
cases. Figure 6 shows the RDF−−
( )
r and RDF++( )
r for the Fe64Er19B17 glass at 180K,together with the stick diagrams calculated for the ( Fe UP : Er DOWN) magnetic structure
whose ω±AB± weighting factors are given in Table 3.
Figure 6 The RDF−−
( )
r and RDF++( )
r functions of the Fe64Er19B17 glass at 180K areshown. The stick diagrams were calculated with the ( Fe UP : Er DOWN) structure and the ±
±
AB
[image:21.595.80.518.344.700.2]20
Comparing Figures 3 and 6, shows that the derived RDF±±
( )
r and the stick diagrams haveinterchanged, because the magnetic structure has inverted. The first peak of RDF++
( )
r in Figure 6 again provides a good envelope of the six first neighbour sticks, which are allpositive. It has moved to a slightly smaller distance r1++ = 2.92Å compared with r1−− =
3.11Å in RDF−−
( )
r at 1.5K because of substantial changes in the ωFeFe and ωErErweighting factors between 1.5K and 180K. The first minimum in RDF++
( )
r at 180K has thesame depth as in RDF−−
( )
r at 1.5K. The first peak in the RDF−−( )
r is at r1−− = 2.62Å and the first minimum less deep because the negative ωErB and ωFeEr weighting factors are only≈ 19% of their values at 1.5K. The positions of the first peak in the two RDFs, r1++ = 2.92Å ;
− −
1
r = 2.62Å are much closer than they were at 1.5K, but their average <r1> = 2.77Å is the
same and close to the (single) value r1 = 2.75Å at 112K. The two coordination numbers, n1++
= 11.9 ; n1−− = 11.4 are also closer because the reduction in ωErB and ωFeEr produces less distortion in the shape of the first peak. The mean coordination number for the Fe64Er19B17
glass obtained from those RDFs at 1.5K, 112K and 180K which have a positive set of the six
AB was n1 = 12.1 ± 0.2.
± ±
AB
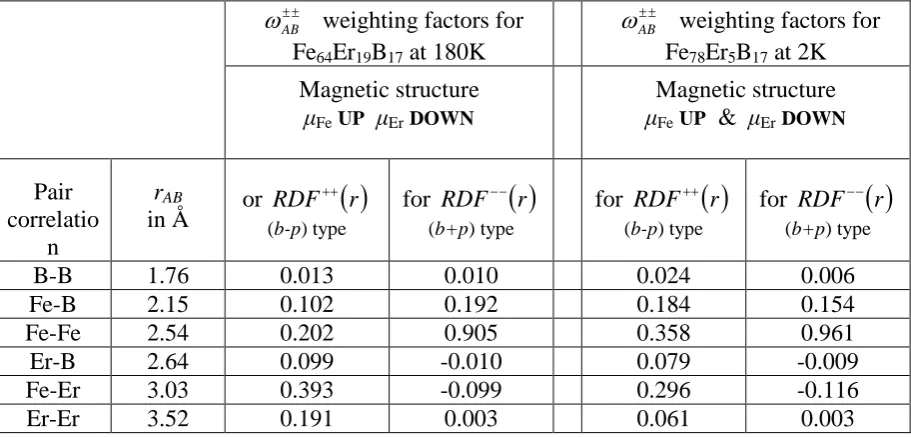
ω weighting factors for Fe64Er19B17 at 180K
± ±
AB
ω weighting factors for Fe78Er5B17 at 2K
Magnetic structure
FeUP ErDOWN
Magnetic structure
FeUP & ErDOWN
Pair correlatio
n
rAB
in Å or RDF
( )
r+ +
(b-p) type
for RDF−−
( )
r(b+p) type
for RDF++
( )
r(b-p) type
for RDF−−
( )
r(b+p) type
B-B 1.76 0.013 0.010 0.024 0.006
Fe-B 2.15 0.102 0.192 0.184 0.154
Fe-Fe 2.54 0.202 0.905 0.358 0.961
Er-B 2.64 0.099 -0.010 0.079 -0.009
Fe-Er 3.03 0.393 -0.099 0.296 -0.116
Er-Er 3.52 0.191 0.003 0.061 0.003
Table 3 The interatomic pair distances rAB are given in ascending order with the AB
weighting factors calculated for the Fe64Er19B17 at 180K and Fe78Er5B17 at 2K
It was explained in Section 2.0, that the non spin-flip cross-sections of the Fe78Er5B17 glass at
[image:22.595.71.527.454.673.2]21
[14]; Fe83B17 [15] and (Fe,Tb)83B0.17 [3] type glasses. They are quite different from those of
the Fe64Er19B17 glass at 1.5K described in Section 2.1, whose two total scattering levels had
similar values in the forward limit Q = 0 and both decreased with increasing Q. The total
scattering level
(
b+ p||( )
Q)
2 for Fe78Er5B17 at 2K has a forward limit(
( )
)
2 ||
0
p
b+ = 1.78
barns steradian-1 atom-1 and falls rapidly with Q, while
(
||( )
)
2Q p
b− has a much smaller
forward limit
(
||( )
)
20
p
b− = 0.631 barns steradian-1 atom-1 and actually increases with Q as
observed for the other glasses [12,13,14]. Because of these differences, the features in the
( )
QS++ , S−−
( )
Q structure factors of the Fe78Er5B17 glass turn out to be much less well [image:23.595.86.519.335.692.2]developed than those of the Fe64Er19B17 sample.
Figure 7 The RDF−−
( )
r and RDF++( )
r functions of the Fe78Er5B17 glass at 2K are shown.The stick diagrams were again calculated with the ( Fe UP : Er DOWN) structure with the ±
±
AB
22
Figure 7 shows the derived RDF−−
( )
r and RDF++( )
r for Fe78Er5B17 at 1.5K and the stickdiagrams show again that the ( Fe UP : Er DOWN) configuration is the correct magnetic
structure. Table 3 gives the corresponding ωAB±± weighting factors which are by coincidence,
rather similar to those of the Fe64Er19B17 glass at 180K. Even with this similarity, quite subtle
differences between the derived parameters such as r1++ = 2.86Å, r1−− = 2.62Å in Fe78Er5B17
at 2K compared with r1++ = 2.92Å, r1−− = 2.63Å in Fe64Er19B17 at 180K, can be explained
by the small differences in their ωAB±± weighting factors . The coordination number n1 = 12.6
for Fe78Er5B17 obtained from the RDF++
( )
r which has all the ω+AB+ positive, is slightly largerthan that of Fe64Er19B17, but the atomic packing in these ternary glasses is probably easier
when the concentration of the erbium is small. The chief difference between the RDFs of
these two glasses is that the features in those of Fe78Er5B17 are less well developed than in
Fe64Er19B17, - as illustrated by the depth of the first minimum in both RDF++
( )
r , RDF−−( )
r .This is partly because the features in S±±
( )
Q of the Fe78Er5B17 glass are less well developed,as already explained, but also because the atomic number density of Fe78Er5B17 is ≈ 23%
greater than that of Fe64Er19B17. The parabolic background 4πρ0r2 of its RDFs is ≈ 2.5 atoms
Å-1 greater by r ≈ 3.5Å, which is similar to the difference in depth of the first minimum in the
RDFs.
4) Conclusions
The two sets of polarised beam neutron scattering measurements we have made on the on
Fe78Er5B17 and Fe64Er19B17 glasses proved for a while, to be difficult to interpret. Part of this
was due to the complexity of their non-collinear ferrimagnetic structures. The inability to
simulate the non spin-flip neutron scattering cross-sections (especially those of the
Fe64Er19B17 glass), led to their analysis using a Fourier transform. Two spin-dependent total
structure factors S±±
( )
Q were first defined from the non spin-flip scattering cross-sectionsΩ ∂ ∂σ±±
. Their Fourier transform gave two spin-dependent Radial Distribution Functions
( )
rRDF±± which could be interpreted in terms of the (six) atomic pair correlation functions
( )
rAB
± ±
23
of the atomic-scale magnetic structures in the (Fe,Er)83B17 glasses, despite the limited range
of the scattering data in the Fourier transform.
The very large magnetic scattering amplitude of erbium, (e.g. p||Er
( )
0 =17.73fm at 1.5%K)has been the most significant parameter in determining the form of the neutron scattering
cross-sections. It has generated a wide range in the values of the combined scattering
amplitudes
(
bp||( )
Q)
and both positive and negative values of the ωAB±± weighting factors,which were the key to interpreting the position and shape of the first peak in the RDF±±
( )
r . An important feature of the Fourier transforms is that they have not involved any adjustableparameters, since the nuclear scattering amplitudes are tabulated and the ||
Fe
µ , µEr||
components of the magnetic moments (which define the magnetic scattering amplitudes)
came directly from the magnetisation data in Part I. In addition, the scattering cross-sections
had been derived in absolute units from the raw data using our own programs.
The main conclusions from Parts I and II of this work are as follows. First, the (bulk)
magnetisation measurements have confirmed that the ferromagnetic compensation in
Fe64Er19B17 glass is characterised by an equality of the magnetic sublattices. Second, the
interchange of the non spin-flip neutron scattering cross-sections
Ω ∂ ∂σ++
,
Ω ∂ ∂σ−−
between
100K and 125K which preserves their overall shape, confirms that there is a complete
reversal of the atomic-scale magnetic structure at Tcomp. Third, the convergence of the two
non spin-flip cross-sections
Ω ∂ ∂σ++
,
Ω ∂ ∂σ−−
at 112K illustrates that the collinear components
of the magnetic moments ||
Er
µ , ||
Fe
µ go to zero in a special, compensated sperimagnetic
phase which appears to exist at exactly Tcomp. Finally, the presence of the pre-peak at Qpp ≈
1.3Å-1 in the spin-dependent total structure factors S±±
( )
Q at 112K, shows that it must originate in the atomic structure and may probably involve Fe-Er-Fe “collineations” at aradial distance of about 6.0Å.
The neutron experiments were made within the EPSRC Neutron Beam programme and the
help of the staff at the Institut Laue-Langevin, particularly Drs J Kulda and M Enderle, is
24
the derivation of the spin-dependent Structure Factors and their Fourier transform with her
own, independent computer codes.
References
[1] Wildes A R and Cowlam N Recent Research Developments in Magnetism and Magnetic
Materials 2003 1 541-563.
[2] Wildes A R and Cowlam N 2011 Part I
[3] Cowlam N, Hanwell M D, Wildes A R and Jenner A G I 2005 J Phys : Condens Matter
17 3585-3596.
[4] Krishnan R, Lassri H and Teillet J 1991 JMMM 98 155-61.
[5] Benjelloun J, Baran M, Lassri H, Oukris H, Krishnan R, Omri M and Ayadi M 1999
JMMM 204 68-72.
[6] García L M, Pizzini S, Rueff J P, Vogel J, Galér, Fontaine A, Kappler J P, Krill G and
Goedkoop J B 1996 J Appl Phys 79 6497-99.
[7] Pizzini S, García L M, Fontaine A, Rueff J P, Vogel J, Galéra R M Goedkoop J B,
Brookes N B, Krill G and Kappler J P 1997 J of Elec Spect 86 165-73
[8] Szyma ski K, Kalska B, Satuła D, Dobrzy ski L, Brodderfalk A, Wäppling R, and
Nordblad P 2002 JMMM 251 271-82.
[9] Cowlam N, Wildes A R, Hanwell M D, Dearing N and Jenner A G I J Phys : Condens
Matter 2010 22 296003
[10] Halpern O and Johnson M N 1939 Phys Rev 55 898-923
[11] http://www.ncnr.nist.gov/resources/n-lengths
[12] Blétry J and Sadoc J F 1975 J Phys F : Metal Phys 5 L111-7.
[13] Dubois J M, Chieux P, Le Caer G, Schweitzer J and Blétry J 1982 J de Physique C9
23-9
[14] Guoan Wu, Cowlam N, Davies H A, Cowley R A, Paul D McK and Stirling W G,
1982 J de Physique 12 C71-76
[15] Brown P J 1995 International Tables for Crystallography
ed Wilson A J C (Dordrech : Kluwer) Vol C 391.
[16] Faber T E and Ziman J JM 1965 Phil Mag 11 153-73
[17] Lorch E 1969 J Phys C : Solid St 2 229-37
25
[19] Klug H P and Alexander L E 1974 X-ray diffraction procedures (John Wiley : New
York)
[20] Bernal J D 1964 Proc. Roy Soc A280 299
![Figure 1 The non spin-flip cross-sections for the Fefor the Fe78Er5B17 glass at 2K are shown in 1a and 64Er19B17 glass at 180K in 1b, 125K 1c, 112K 1d, 100K 1e, 60K 1f[9] and 1.5K](https://thumb-us.123doks.com/thumbv2/123dok_us/7995009.206893/6.595.95.455.89.712/figure-spin-cross-sections-fefor-glass-shown-glass.webp)
![Figure 3 of [9] - except that the relative positions of the first peak and pre-peak are quite](https://thumb-us.123doks.com/thumbv2/123dok_us/7995009.206893/11.595.143.493.153.204/figure-relative-positions-peak-pre-peak-quite.webp)