This is a repository copy of Computational analysis of a heat transfer device integrated wind tower system for hot climate.
White Rose Research Online URL for this paper: http://eprints.whiterose.ac.uk/81762/
Version: Accepted Version
Proceedings Paper:
Calautit, JKS and Hughes, BR (2012) Computational analysis of a heat transfer device integrated wind tower system for hot climate. In: Ban, M, Duić, N, Guzović, Z, Klemeš, JJ, Markovska, N, Schneider, DR and Varbanov, P, (eds.) 7th Conference of Sustainable Development of Energy, Water and Environment Systems. Sustainable Development of Energy, Water and Environment Systems (SDEWES), 2-7 July 2012, Ohrid, Macedonia. Faculty of Mechanical Engineering and Naval Architecture, Zagreb .
[email protected] https://eprints.whiterose.ac.uk/ Reuse
Unless indicated otherwise, fulltext items are protected by copyright with all rights reserved. The copyright exception in section 29 of the Copyright, Designs and Patents Act 1988 allows the making of a single copy solely for the purpose of non-commercial research or private study within the limits of fair dealing. The publisher or other rights-holder may allow further reproduction and re-use of this version - refer to the White Rose Research Online record for this item. Where records identify the publisher as the copyright holder, users can verify any specific terms of use on the publisher’s website.
Takedown
If you consider content in White Rose Research Online to be in breach of UK law, please notify us by
COMPUTATIONAL ANALYSIS OF A HEAT
TRANSFER DEVICE INTEGRATED WIND TOWER
SYSTEM FOR HOT AND HUMID CLIMATE
John Kaiser Calautit1, Ben Richard Hughes1, Saud Abdul Ghani2
1
School of Civil Engineering, University of Leeds, Leeds, LS2 9JT, United Kingdom 2
School of Mechanical Engineering, Qatar University, Doha, Qatar
ABSTRACT
Increasing focus on reducing energy consumption has raised public awareness of renewable energy resources, particularly the integration of natural ventilation devices in buildings such as wind towers. The purpose of this study is to integrate heat transfer devices in a wind tower to meet the internal comfort criteria in extreme external condtions. Computational Fluid Dynamics (CFD) was used to develop a numerical model of a wind tower system and simulate the air flow pattern around and through the device to the test room. Results have indicated that the average internal airflow rate was reduced following the integration of the vertical and horizontal heat transfer device configuration, reductions of 4.11% and 8.21% was obtained respectively. The work also compared the thermal performance of the passive ventilation device incorporating traditional evaporative cooling and heat transfer devices. The proposed cooling system was capable of reducing the air temperatures by 12-15K.
KEYWORDS
Wind tower, natural ventilation, evaporative cooling, CFD, heat transfer device
INTRODUCTION
In hot and arid regions such as the Middle East, there is a large dependence on electricity to run mechanical systems for providing ventilation and thermal comfort. During the summer months more than 50% of the electrical demand comes from HVAC loads [1]. As stated by WBCSD, commercial and residential buildings accounts for almost 40% of the world energy usage and are responsible for almost 40-50% of the world’s carbon emissions [2]. The resulting carbon emissions are substantially more than those in the transportation sector. This represents a significant opportunity for reducing the buildings energy consumption and green house gas emissions. Natural ventilative methods such as wind towers are increasingly being employed in new buildings to reduce the energy consumption and carbon foot print.
Wind towers have been in existence in various forms for centuries as a non mechanical means of providing indoor ventilation, energy prices and climate change agendas have refocused engineers and researchers on the low carbon credentials of modern equivalents. Conventional and modern wind towers architecture can be integrated into the designs of new buildings, to provide thermal comfort without the use of electrical energy.
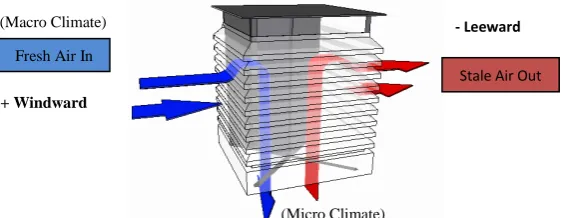
the micro and macro climate creates different pressures and result in air currents. Experimental and numerical studies [3, 4] have shown that wind driven force is the primary driving force for the wind tower device, providing 76% more indoor ventilation than buoyancy driven forces.
Figure 1 A flow diagram representing ventilation through a multi-direction wind tower.
The cooling capabilities of wind towers which depend mainly on the structure design itself are inadequate. Therefore it is essential to cool the air in order to reduce the building heat load and improve the thermal comfort of its occupants during the summer months. Traditional wind tower systems were integrated with evaporative cooling devices to increase its thermal performance. The induced warm air is passed through cooling tubes or moist surfaces, which allows for the cooling of the air stream before entering the living spaces. However, the addition of these cooling devices may reduce the air flow rate inside the channel and reduce the overall efficiency of the wind tower. Another disadvantage of this configuration is the requirement of taller towers to have sufficient contact time between the air flow and cooling surfaces.
A wind tower system incorporating heat transfer devices was designed to meet the internal comfort criteria in hot and humid condtions. Heat transfer devices were installed inside the passive terminal of the wind tower unit, highlighting the potential to achieve minimal restriction in the external air flow stream while ensuring maximum contact time, thus optimsing the cooling duty of the device. The study compared the ventilation and thermal performance of the passive ventilation device integrated with traditional evaporative cooling and heat transfer devices. The second part of the work incorporated the proposed wind tower system to a test room (ventilated space) in order to analyze the effect of varying external wind speeds (1-5 m/s) on the internal conditions. Furthermore, a standard roof-mounted wind tower was used as a benchmark for the comparison of the two different heat transfer device orientations; horizontal and vertical arrangements. The numerical analysis was carried out using Computational Fluid Dynamics (CFD) software. The CFD commercial code used for the modelling of the wind tower is ANSYS Fluent. A geometrical representation of the wind tower configuration, micro climate and macro-climate was created using Solid Edge ST.
PREVIOUS RELATED WORK
Hughes et al. [5] highlighted the different cooling techniques integrated with wind tower systems to improve its thermal performance. Key parameters including the ventilation rates and temperature were evaluated in order to determine the viability of implementing the devices for their respective use. The results showed that the highest temperature reductions were achieved from incorporating evaporative cooling techniques into the wind tower such as wetted column (clay conduits) and wetted surface (cooling pads). The temperature reduction
was found to be in the range of 12 –15K. The study also highlighted the effect of the addition
Stale Air Out
Fresh Air In
- Leeward
+ Windward (Macro Climate)
of the cooling devices inside the device which reduces the air flow rates and reduces the overall efficiency of the wind tower.
Kalantar [6] assessed the ventilation and thermal performance of a traditional wind tower located in the hot and arid region of Yazd. The work developed a numerical CFD model to simulate and analyze the airflow pattern inside the wind tower in three-dimensional and steady state conditions. The study also presents a numerical technique to simulate the effect of integrating evaporative cooling systems to the wind towers performance. The result yielded a good correlation between the numerical simulations and experimental data obtained from literature. It was found that the Badgir wind tower was able to reduce the air temperatures by 10 to 15K
Bouchahm et al. [7] evaluated the ventilation and thermal performance of a similar wind tower system incorporated to a building using experimental and theoretical methods of analysis. Clay conduits were mounted inside the shaft of the unidirectional tower to improve the mass and heat transfer and a water pool is situated at the bottom of the device to increase the humidification process. The results confirmed that the airflow induced by the 0.75 x 0.70
m2 tower has a direct effect on the reduction of internal temperature. It was found that small
sized partitions (by increasing the number of conduits) better efficiency is achieved than with a higher wetted column of the cooling tower. The cooling tower integrated with wetted interior surfaces was able to reduce the indoor air temperature by up to 17.6K.
Badran [8] investigated the performance of an evaporative cooling and multi-directional wind tower system. A mathematical model was developed to analyze the condition of air passing through the evaporative cooling column of the tower for different external conditions. Similarly, clay conduits were installed inside the tower’s channel to cool the passing airflow before inducing it inside the structure. During the night, the ambient air coolness is stored in the conduits mass to let it function during the day. The results showed that the evaporative
cooling tower with a vertical height of 4m can generate an airflow of 0.3m3/s and reduce the
internal temperature by 11K. The author suggested that reducing the height of the wind tower which generally reaches up to 15 m can decrease the construction cost without having a
noticeable decrease in performance.
Safari and Hosseinnia [9] used analytical and numerical CFD modelling to investigate the thermal performance of new designs of wind towers under different structural parameters and external conditions. The novel wind tower design is equipped with wetted curtains suspended inside the column of the cooling device, which are formed as surfaces that inject droplets of water at extremely low speeds. The achieved numerical results showed that the wetted columns with the height of 10 meters were able to reduce the internal air temperature by 12K and increase the relative humidity of air by 22%.
This study evaluates the performance of the proposed model by simulating and analyzing the air movement and temperature in the structure using CFD, highlighting the potential to achieve minimal restriction in the external air flow stream while ensuring maximum contact time. The numerical solutions are validated against experimental and computational data obtained from literature [4, 6]. The level of performance of the design is assessed based on the results of the internal air velocity, pressure and temperatures.
CFD SET-UP
[image:5.595.213.398.312.439.2]The CFD analysis was carried out using the ANSYS 12.1 Fluent software. The CAD model was imported to Workbench: Model Designer to generate a computational model. The geometrical model of a wind tower channel with a height of 10 m and 1.5 x 1.5 m2 cross-sections is used to compare the performance of a passive system incorporating evaporative cooling and heat transfer devices. A water injection system for the cooling of the air stream is located at the top of the wind tower channel (h = 9m). Furthermore, horizontal cylindrical heat transfer device configuration is incorporated within the control domain of the channel. Figure 2 shows a three-dimensional drawing of the computational model and the location of the measurement points inside wind tower channel along with their dimensions.
Figure 2 Schematic of the wind tower channel and positioning of the sample points (Stage 1)
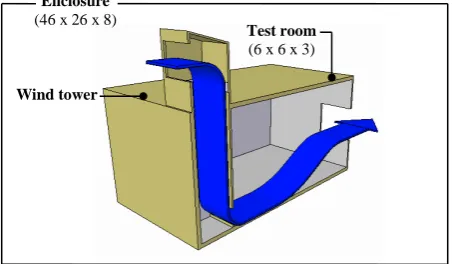
[image:5.595.188.416.611.743.2]Furthermore, the proposed wind tower system with the heat transfer devices is incorporated to a test room (micro climate) with the height, width, and length of 3, 6, and 6 m. An enclosure was created to represent the external wind environment (macro climate). The enclosure with a height, width, and length of 8, 26, and 46 m creates a direct interface through the geometry. The air streamline had a constant velocity of 3 m/s through the enclosure to simulate the actual wind environment. The enclosure (the flow domain) was set at a distance from the geometry to avoid reversed flow in the region [10]. A flow domain representation of the physical geometry of the wind tower design under investigation and location of set boundary conditions are shown in Figure 3.
Figure 3 Schematic of a wind tower system mounted on the test room (Stage 2) Enclosure
(46 x 26 x 8)
Test room (6 x 6 x 3)
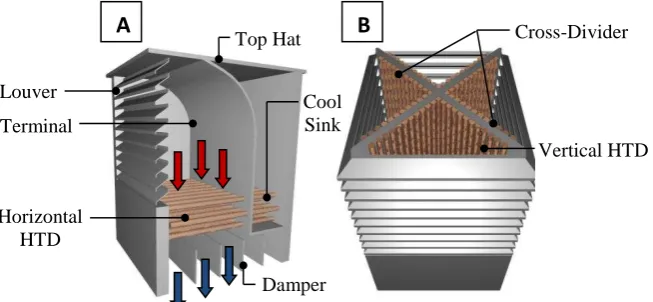
A four-sided square wind tower with an internal diameter of 1 m and height of 1.5 m is used for the numerical analysis. The vertical HTD arrangement is identical to the standard wind tower model, the heat transfer devices are closely arranged in an x-shaped vertical pattern positioned next to the cross-dividers inside the passive terminal. A one-sided circular wind tower is used for the analysis of the horizontal heat pipe configuration, while retaining the physical parameter and standard components of the benchmark model. Figure 4 displays the proposed configurations.
[image:6.595.150.477.174.325.2]
Figure 4 Wind tower systems incorporating (a) horizontal HTD arrangement (b) vertical HTD arrangement
[image:6.595.155.441.427.535.2]Table 1 displays the design specification of the heat transfer devices employed in the wind tower system.
Table 1 Design Specification of HTD arrangements
Specification Vertical Horizontal
Number of Heat Transfer Device 70 70
Spacing (m) 100 100
Pitch Spacing (m) 100 100
Outer Diameter (m) 20 20
Inner Diameter (m) 15 15
Length (m) 900 900
[image:6.595.92.505.587.666.2]Table 2 summarizes the conditions of the test configurations.
Table 2 Summary of the wind tower test configurations
Test Wind Direction Wind Speed Wind Tower Cooling Device
1 0° 0-5 m/s One-sided Evaporative
2 0° 0-5 m/s Four-sided N/A
3 0° 0-5 m/s Four-sided Vertical HTD
4 0° 0-5 m/s One-sided Horizontal HTD
Mesh generation
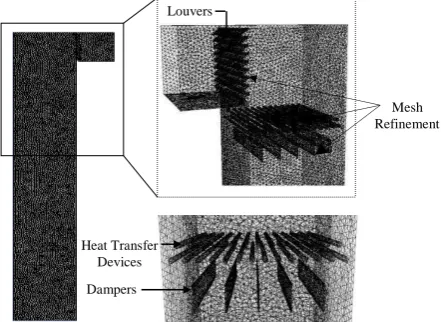
The quality of the mesh has important implication on the convergence and the level of accuracy of the achieved results [11]. The size of the mesh element was extended smoothly to resolve the sections with high gradient mesh and to improve the accuracy of the results of the temperature fields. Inflation parameters are set for the complex geometry face elements (louvers and heat transfer devices) to generate a finely resolved mesh normal to the wall and
Louver
Top Hat
Horizontal HTD Terminal
Cross-Divider
Vertical HTD
B A
coarse parallel to it, as shown in Figure 5. The two-dimensional faces elements at the selected wall or boundaries are inflated into 3d prism elements which resolve boundary layer properly at relatively less computational cost.
[image:7.595.229.450.122.283.2]
Figure 5 Schematic diagram representing the wind tower channel with grid sections.
A non-uniform mesh was applied to the volumes of the computational model. The mesh
arrangement consisted of 344,643tetrahedral non-uniform mesh elements with 70,435nodes,
[image:7.595.188.424.372.524.2]as shown in Figure 6.
Figure 6 Flow domain (macro-microclimate) representation of the physical geometry of the wind tower and test room under investigation and location of set boundary conditions. The domain consists of a velocity inlet at the left hand side, and a pressure outlet on the right.
Boundary conditions
The k-epsilon(2eqn) viscous model with standard wall functions was used for the numerical simulation as it is the most appropriate viscous model for an inlet wind velocity of 4 m/s and lower [11]. The obtained CFD results of the wind tower system incorporating evaporative cooling methods will be validated against research carried out by Kalantar [6] on a wind tower channel by using both analytical and CFD analysis. A similar geometrical structure, boundary conditions and CFD codes were applied. Figure 7 displays the computational domain of the traditional and modern design of a wind tower system integrated with cooling devices. Evaporative cooling devices sit at the top of a wind tower. Hot air is passed through the traditional wind tower channel and cooled by the water evaporation. Cool moist air is denser than ambient air and sinks down the tower and into the enclosed space [12].
Heat Transfer Devices
Dampers
Mesh Refinement
1 2
Louvers
Flow Face In Enclosure – Fluid
(Macro Climate)
Flow Face Through Indoor- Fluid (Micro Climate)
Flow Face Out Enclosure – Fluid
Computational model of the wind tower channel incorporating cooling devices with boundary conditions are summarized in Figure 7.
[image:8.595.148.478.99.300.2]
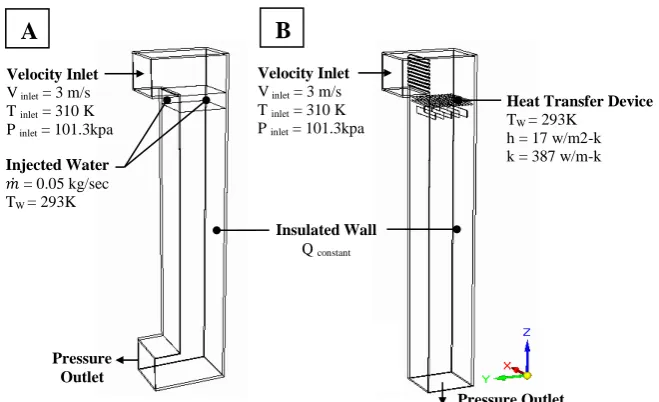
Figure 7 Computational domain with boundary conditions: (a) traditional evaporative cooling (b) HTD
[image:8.595.81.463.471.598.2]The geometry (micro climate) was modelled as an open structure with openings on the windward and leeward side which allows the incoming air to pass through it, in order to simulate and analyse the air flow pattern inside the structure. The geometry faces were set as solid walls with a thickness of 0.2 and 0.02m to create a boundary between the interior and exterior. The enclosure (macroclimate) was created to simulate the external wind velocity. The enclosure consists of a velocity inlet (operating velocity) at the left hand side of the enclosure, and a pressure outlet (atmospheric pressure) on the opposing boundary wall of the enclosure as shown in Figure 8.
Figure 8 CFD flow domain representation of the micro and macro climate environment (Stage 2).
The base of the structure is set as ground (wall) and the remaining faces were set as symmetry to alleviate any return velocities which could affect the precision of the results. The boundary conditions for the CFD model are shown in Table 3.
Table 3 CFD Model Boundary Conditions
Geometry Solid
Micro-Macro Climate Fluid (air)
Velocity inlet (m/s) 5, 4, 3, 2, 1
Pressure outlet Atmospheric
Velocity Inlet V inlet = 3 m/s
T inlet = 310 K
P inlet = 101.3kpa
Velocity Inlet V inlet = 3 m/s
T inlet = 310 K
P inlet = 101.3kpa
Insulated Wall Q constant
Pressure Outlet
Pressure Outlet Injected Water
= 0.05 kg/sec TW = 293K
Heat Transfer Device TW = 293K
h = 17 w/m2-k k = 387 w/m-k
A B
Macro climate
[image:8.595.98.501.700.762.2]Time Steady State
Gravity -9.81 (Z-Axis)
Test Room wall Thickness(m) 0.2
Wind Tower Wall Material Concrete (Trad), Sheet Metal (Modern)
Wind Tower Wall Thickness(m) 0.02
External Temperature (K) 310
Grid adaption
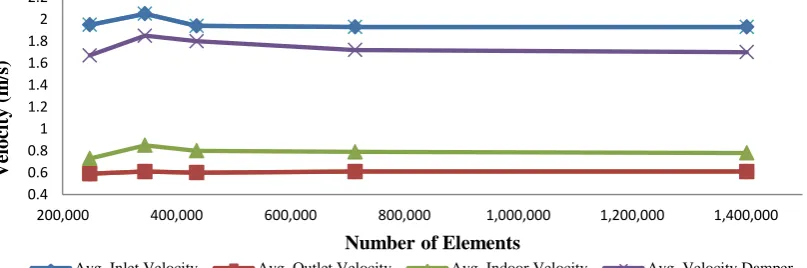
[image:9.595.94.498.71.158.2]Grid adaptation was used to validate the programming and computational operation of the computational model. The numerical grid was refined and locally enriched using the hp-method grid adaptation technique [13]. This procedure of evaluation requires the use of different mesh sizes or higher order approximations by the use of a posterior error estimates. The posteriori error estimate used in the theoretical model is the average weighted velocity taken from the inlet and outlet of the tower and interior (micro climate) of the test room. Also, due to the complexity of the geometry the mesh was generated using tetrahedral elements with patch conforming algorithm. The grid adaptation procedure increases the number of nodes and elements of the numerical model. The grid was evaluated and refined until the posterior estimate error becomes insignificant between the number of nodes and elements, computational iterations and the posterior error indicator. The applied boundary conditions were remained fixed throughout the simulation process to ascertain precise comparison of the posterior error estimate. Figure 9 shows that at 1,400,000 elements the percentage error between the grid refinements was at its lowest in the last two steps. An acceptable compromise was reached between the accuracy of results and computational iterations.
Figure 9 Comparison of solutions from various grid adaptation methods. The variables are the average velocity at the inlet and outlet of the wind towers and interior of the test room
RESULTS
Figure 10a displays the velocity contour of the cross-sectional plane inside the evaporative cooling tower test channel. The increase in velocity is due to absorption of water by the air and it is in a heavier state (denser). Figure 10b shows that the velocity is accelerated as it moves across the 35 ° louvers, reaching a maximum velocity of 3.5 m/s. It is also observed that the velocity increases in the upper turns of the wind tower as the cross-section of the air flow decreases due to the vortex formation [14, 15]. As it can be seen from Figure 11, the CFD results in this study [6] are comparable (range 0-11 % error)
0.4 0.6 0.8 1 1.2 1.4 1.6 1.8 2 2.2
200,000 400,000 600,000 800,000 1,000,000 1,200,000 1,400,000
Velo
city
(
m
/s
)
Number of Elements
[image:9.595.93.497.415.549.2][image:10.595.139.463.395.517.2]
Figure 10 Velocity contour lines of a cross sectional plane in the test channel: (a) traditional evaporative cooling (b) HTD
Figure 11 Comparison of the airflow velocity variation from wind tower inlet to outlet
obtained from the CFD data from the two studies (Traditional evaporative cooling tower).
Figure 12a shows the contours of static temperatures inside the modified test channel. From the illustration it is seen that the there is a sufficient decrease in air temperature. This is due to the absorption of heat in the evaporative cooling. The water is sprayed at the top section of the channel (h = 9 m), temperature decrease very fast and slightly increases due to the walls of the wind tower. From Figure 12b, the temperature reduction is greater on the left side of the contour plot where the air velocity is lower (see Figure 10b). This is due to the increase in contact time between the HTD and air. As can be seen from Figure 13, the CFD results in this study [6] are comparable (range 0-0.5 % error).
2.8 3.3 3.8 4.3 4.8 5.3 5.8 6.3 6.8
0 2 4 6 8 10
Ve
lo
cit
y
M
agn
it
u
d
e
(m
/s
)
Position (m)
Kalantar
Calautit
See Detail A 3
1 3.6
2.6
2.6
5.2
0.8
1.7 3.1
3m/s
5 m/s
3.5
1.8
Circulation Region
3
[image:11.595.171.431.402.527.2]
Figure 12 Temperature contour lines of a cross sectional plane in the test channel: (a) evaporative cooling (b) HTD
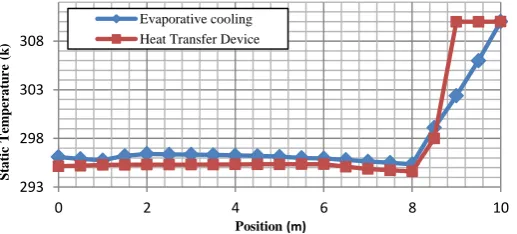
Figure 13 Comparison of the airflow temperature variation from inlet to outlet obtained from the CFD results from the two studies.
Figure 14 compares the thermal performance of a wind tower system incorporated with evaporative cooling and HTD.
Figure 14 Comparison of the variation of temperature of airflow from entering to exiting. 294 296 298 300 302 304 306 308 310 312
0 2 4 6 8 10
S tat ic T em p er at u re ( K) Position (m) Kalantar Calautit 293 298 303 308
0 2 4 6 8 10
S tat ic T em p er at u re ( k )
Position (m) Evaporative cooling Heat Transfer Device T inlet = 310K
T inject = 293K
T7m= 296K
T outlet = 296K
T4m= 295K
T2m= 295K
T inlet = 310K
T outlet = 295K
T HTD = 293K
T7m= 295K
T4m= 295K
T2m= 295K
A B
310K
[image:11.595.170.429.611.728.2]Figure 15 displays the effect of the vertical wind tower height on the thermal performance. It can be observed that the traditional system is greatly dependent on the height of the tower.
Figure 15 Effect of the wind tower height on the temperature at exit.
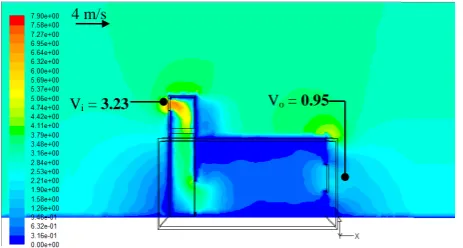
Figure 16 display the velocity contour of the cross-sectional plane in the test room model. From the illustration it is observed that the air flow entering the opening of the uni-directional wind tower is directed down to the enclosed space through the floor diffuser. The airflow is accelerated as it shears across the walls and floor of the structure, reaching a maximum velocity of 3 m/s.
[image:12.595.184.416.351.475.2]Figure 16 Velocity contour lines of a cross sectional plane in the test room with an inlet velocity of 4 m/s (Evaporative cooling)
Figure 17 shows the contours of static temperatures inside the test room. From the illustration it is seen that the there is a sufficient decrease in air temperature, reductions of 13 K is obtained respectively.
Figure 17 Temperature distributions within the test room with external wind speeds of 4 m/s (Evaporative cooling)
Tables 4 summarize the CFD results for the simulated velocity and pressure regions for the traditional tower.
294 295 296 297 298 299 300 301
4 5 6 7 8 9 10
Ave
rage
T
em
p
er
at
e
at
E
x
it
(
K)
Wind Tower Height (m)
Evaporative Cooling Heat Transfer Device
TIndoor = 297.4 K
Tw 293 K
Ti = 310 K T
O = 302 K
Vo = 0.95
Vi = 3.23
4 m/s
[image:12.595.186.411.565.679.2]Table 4 Numerical CFD results (Traditional evaporative cooling)
External wind (m/s) V indoor (m/s) Vi (m/s) Vo (m/s) Pi (Pa) Po (Pa)
1 0.29 0.92 0.35 0.99 -0.42
2 0.47 1.58 0.58 3.72 -3.19
3 0.68 2.39 0.86 5.56 -5.09
4 0.86 3.23 0.95 8.24 -7.84
5 1.01 3.71 1.21 10.21 -8.78
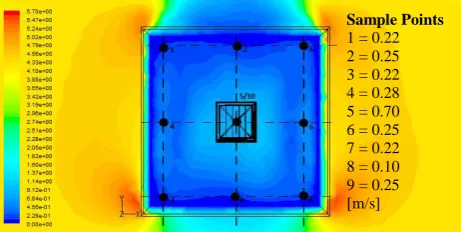
[image:13.595.183.414.256.372.2]The modern wind tower was located centrally within the micro climate. The position of the measuring points inside the test room is shown in Figure 18. The center of the wind tower was located directly above sample point 5. The vertical distance at which the sample points were taken was 1.5 m with the additional point taken at 2.75 m (diffuser level).
[image:13.595.183.414.487.601.2]Figure 18 Contour plot of internal velocity at external velocity of 4 m/s showing the location of sample points within the microclimate (Modern wind tower).
Figure 19 shows the pressure distribution at a cross-sectional plane passing through the centre of the ventilation device. From the illustration, it is observed that the areas of high pressure are observed at the wind ward side of the tower. While low pressure areas are seen inside the microclimate and at the outlet of the wind tower
Figure 19 Static pressure contour plot of a cross sectional plane in the test room with an inlet velocity of 4 m/s (Modern wind tower)
Tables 5, 6 and 7 summarize the CFD calculated results for the simulated velocity (1, 2, 3, 4 and 5 m/s) and pressure regions for the benchmark model, vertical heat pipe configuration, and horizontal heat pipe configuration. Results have indicated that the internal airflow rate was slightly reduced following the integration of the vertical and heat pipe configuration, reductions of 4.11 % and 8.21 % was obtained from the achieved computational model.
4 m/s
po = -5.9 pi = 6.14
Pindoor =0.43
Table 5 Numerical CFD results (Modern wind tower )
External wind (m/s) V indoor (m/s) Vi (m/s) Vo (m/s) V d (m/s) Pi (Pa) Po (Pa)
1 0.17 0.47 0.15 0.47 0.54 -0.32
2 0.39 0.96 0.28 0.94 1.89 -1.19
3 0.55 1.45 0.44 1.29 3.73 -3.07
4 0.73 1.95 0.59 1.67 6.14 -5.88
5 0.85 2.25 0.64 1.82 7.84 -6.71
Table 6 Numerical CFD results (Vertical HTD Arrangement)
External wind (m/s) V indoor (m/s) Vi (m/s) Vo (m/s) V d (m/s) Pi (Pa) Po (Pa)
1 0.16 0.34 0.20 0.45 0.53 -0.19
2 0.36 0.73 0.37 0.89 1.80 -0.79
3 0.53 1.13 0.49 1.29 3.55 -1.83
4 0.70 1.52 0.60 1.67 5.55 -3.39
5 0.82 1.67 0.72 1.91 6.57 -4.78
Table 7 Numerical CFD results (Horizontal HTD Arrangement)
External wind (m/s) V indoor (m/s) Vi (m/s) Vo (m/s) V d (m/s) Pi (Pa) Po (Pa)
1 0.14 0.45 0.23 0.41 0.64 -0.55
2 0.37 0.91 0.57 0.77 2.04 -2.12
3 0.52 1.35 0.81 1.12 3.96 -4.39
4 0.67 1.79 1.08 1.47 6.43 -7.57
5 0.75 1.89 1.15 1.67 7.41 -9.21
Figure 20 illustrates temperature distribution inside the test room integrated with a modern wind tower device. It is observed that the temperature is reduced as it approaches the cross-dividers with the vertical HTD arrangement. The average temperatures inside the microclimate are 296.2 K and 295.8 K with the macro climate temperature set at 310 K.
[image:14.595.65.522.89.163.2]Figure 20 Temperature distributions inside the test room with a modern wind tower incorporating the vertical HTD arrangement
Figure 21 illustrates temperature distribution inside the test room integrated with a one-sided wind tower device with horizontal HTD arrangement.
Figure 21 Temperature distributions inside the test room with a modern wind tower incorporating the horizontal HTD arrangement
TIndoor = 296.2 K
Td= 293.6 K
Ti = 310 K
To = 305 K
4 m/s
TIndoor = 295.8 K
4 m/s
Ti = 310 K
Td= 294.8 K
[image:14.595.176.419.417.536.2] [image:14.595.178.416.611.736.2]DISCUSSION
Figure 10 shows the velocity contours inside the terminal of the tower with evaporative cooling and HTD. Sample points are created to measure the variation of air flow velocity and temperature from the inlet to the outlet. The result also highlighted the existence of separation zones and wake regions near the lower edge of the opening causes the variation of pressure coefficient at the tower’s entrance. As a result, the wind tower could not achieve its maximum efficiency.
With reference to Figure 10a, computational air velocity of 5 m/s is obtained at the outlet of the geometry, which is 67 % higher than the set inlet speed. This is due to the increased negative buoyancy force. Figure 10b, shows the effect of the wind tower components (louvers, dampers and HTD) on the ventilation performance of the device, an average on 2.52 m/s is obtained at the tower outlet.
The CFD results (Figure 11 and 13) of the wind tower system incorporating evaporative cooling methods have been compared against research carried out by Kalantar [6] on a wind catcher by using both analytical and CFD analysis. A similar geometrical structure, boundary conditions and CFD codes were applied. Figure 11 shows the comparison between the CFD results and data obtained from the literature. Good correlation between the different methods of analysis was observed.
Figure 12a displays the contours of static temperatures inside the traditional wind tower. An average temperature of 296K is obtained at the outlet of the device, with the inlet temperature set at 310 K. While the outlet temperature of the wind tower with HTD (Figure 12b) was reduced by up to 15 K.
Figure 13 shows the comparison between the airflow temperature CFD results and data obtained from the literature. Good correlation between the different methods of analysis was observed (average of 0.05 % error).
The CFD study highlighted the effect of the wind tower vertical height on the thermal performance of the two wind tower cooling system. Figure 14 displays the variation of temperature of airflow from inlet to outlet. It is observed that the temperate is reduced by 13-15 K.
Figure 15 compares the effect of varying wind tower height on the exit air temperature. It can be seen that the traditional system is greatly dependent on the height of the tower, exit temperature increased up to 3.8K after reducing the tower height by 8m. Hence, heat transfer devices will be more effective when incorporated with roof-mounted wind tower systems.
Figure 16 is based on the front view of the geometry displaying the velocity contour plot. The velocity contour of the cross sectional planes in the test room model represents the air flow distribution within the structure. As seen from the illustration, the air is accelerated as it enters the opening of the one-sided wind tower. The air stream is circulated inside the structure and exits the opening located on the other end.
Figure 18 illustrates the measurement points at 1.5 m height. Uneven airflow distribution is observed inside the structure, air flow velocity (point 5) of 0.7 m/s is obtained directly below the wind tower diffuser, which is twice the air stream velocity near the side walls. This is due to the dampers of the system set to 0° (fully open).
As depicted in Figure 19, the dynamic pressure contours for the standard row housing model is obtained with an average micro-climate pressure of 0.43 Pa. As seen from the diagram, the dynamic pressure inside the structure is significantly lower compared to the inlet conditions.
Figure 20 and 21 displays the contour of static temperatures inside the test room with a wind tower incorporating the vertical and horizontal HTD arrangement. Air temperature reduction is observed inside the microclimate, average temperature of 296.2 K and 295.8 are obtained inside the models for external wind speed of 4 m/s, which is 11-12 % lower, compared to the wind tower employing evaporative cooling devices.
CONCLUSION
A wind tower system involving heat transfer devices was designed to meet the internal comfort criteria in extreme condtions. Heat transfer devices were installed inside the passive terminal of the wind tower unit, highlighting the potential to achieve minimal restriction in the external air flow stream while ensuring maximum contact time, thus optimsing the cooling duty of the device. A numerical analysis was carried out using CFD software to simulate and analyze the air flow pattern, pressure coefficient and temperature distribution around and through the wind tower to the test room. The CFD results of the traditional wind tower system incorporating evaporative cooling methods have been compared against data obtained from the literature. Good correlation between the different methods of analysis was observed. The work highlighted the effect of evaporative cooling and heat transfer devices on the thermal performance of the passive ventilation device. The proposed cooling system was capable of reducing the air temperatures by 12-15 K, depending on the configuration and operating conditions. Furthermore, a standard four-sided wind tower system is utilized as a simulation benchmark model for the analysis and comparison of the ventilation and thermal performance of the proposed wind tower configurations. Results have indicated that the internal airflow rate was slightly reduced following the integration of the vertical and heat pipe configuration, reductions of 4.11 % and 8.21 % were obtained from the achieved computational model.
NOMENCLATURE
Abbreviation
CFD Computational Fluid Dynamics
HTD Heat Transfer Device
HVAC Heating, Ventilation and Air-conditioning
WBCSD World Business Council for Sustainable Development
Symbols
v Velocity [m/s]
p Static pressure [Pa]
T Temperature [K]
Mass flow rate [kg/s]
g Gravitational acceleration [m/s2]
Subscript
i inlet
o outlet
d diffuser
REFERENCES
1. Enery Efficiency in Buildings: Transforming the Market [Online], available from:
www.wbcsd.org, 2011
2. Hughes B.R., Calautit J.K. and Chaudhry H.N. Advancement of Natural Ventilation
Technologies for Sustainable Development. The ESE2012 Symposium, pp 71-84, 2012.
3. Hughes B.R. and Cheuk-Ming M. A Study of Wind and Buoyancy Driven Flows Through
Commercial Wind Towers. Building and Environment, Vol. 43, pp 1784-1791, 2011. 4. Jones B. and Kirby R. Quantifying the performance of a top–down natural ventilation
Windcatcher™. Building and Environment, Vol. 44, pp 1925-1934, 2008.
5. Hughes B.R., Calautit J.K., Ghani S.A. The Development of Commercial Wind Towers
for Natural Ventilation: a review. Applied Energy, Vol. 92, pp 606-627, 2012.
6. Kalantar V. Numerical simulation of cooling performance of wind tower (Baud-Geer) in
hot and arid region. Renewable Energy, Vol. 34, pp 246–254, 2009.
7. Bouchahm Y., Bourbia F. and Belhamri A. Performance analysis and improvement of the
use of wind tower in hot dry climate. Renewable Energy, Vol. 36, pp 898-906, 2011.
8. Badran A. Performance of cool towers under various climates in Jordan. Energy and
Buildings, Vol. 35, pp 1031–1035, 2003.
9. Saffari H. and Hosseinnia S. Two-phase Euler-Lagrange CFD simulation of evaporative
cooling in a Wind Tower. Energy and Buildings, Vol. 41, pp 991–1000, 2009.
10.Mehta U. Some aspects of uncertainty in computational fluid dynamics results. Journal of
Fluids Engineering, Vol. 113, pp 539–543, 1991.
11.Chung T. Computational fluid dynamics. Cambridge University Press, 1, pp. 15-21, 2002
12.Calautit J.K., Hughes B.R. and Ghani S.A. A Numerical Investigation into the Feasibility
of Integrating Green Building Technologies into Row Houses in the Middle East. Architectural Science Review, Vol. 56, pp 279-296, 2013.
13.Calautit J.K., Hughes B.R. and Ghani S.A. Numerical Investigation of the Integration of
Heat Transfer Devices into Wind Towers, Chemical Engineering Transactions, Vol. 34, pp 43-48, 2013.
14.Calautit J.K., Chaudhry H.N., Hughes B.R. and Ghani S.A. Comparison between
evaporative cooling and a heat pipe assisted thermal loop for a commercial wind tower in hot and dry climatic conditions. Applied Energy, Vol. 101, pp 740-755, 2013.
15.Calautit J.K., Hughes B.R., Chaudhry H.N., and Ghani S.A. CFD analysis of a heat