promoting access to White Rose research papers
White Rose Research Online
[email protected]
Universities of Leeds, Sheffield and York
http://eprints.whiterose.ac.uk/
This is the author’s version of an article published in
Soft Matter
White Rose Research Online URL for this paper:
http://eprints.whiterose.ac.uk/id/eprint/75509
Published article:
Cheetham, MR, Bramble, JP, McMillan, DGG, Olmsted, PD, Jeuken, LJC, Evans,
SD and Bushby, RJ (2012)
Manipulation and sorting of membrane proteins using
patterned diffusion-aided ratchets with AC fields in supported lipid bilayers.
Soft
Matter, 8 (20). 5459 - 5465 . ISSN 1744-683X
Manipulation and sorting of membrane proteins using patterned
diffusion-aided ratchets with AC fields in supported lipid bilayers
†
Matthew R. Cheetham,
aJonathan P. Bramble,
aDuncan G. G. McMillan,
abRichard J. Bushby,
bPeter D. Olmsted,
aLars J. C. Jeuken
aband Stephen D. Evans
*
aReceived 28th February 2012, Accepted 27th March 2012
DOI: 10.1039/c2sm25473e
We present ratchets capable of directing the movement of charged components within supported bilayer lipid membranes. These ratchets make use of asymmetrically patterned features and AC electric fields, and have been demonstrated to transport charged species such as lipids and transmembrane proteins between two reservoirs. Proteins were present in both orientations in the membrane, with only those with their extra-membranous domain orientated away from the glass substrate being mobile. Proteins in the mobile orientation were transported using these ratchets, thereby sorting the two orientations from one another, and creating an area of the membrane containing five times more protein in one orientation than the other.
Introduction
Membrane proteins are essential components for the functioning and survival of cells and have thus attracted a great deal of interest. They constitute!30% of the proteins encoded for in the human genome,1 are responsible for maintaining ionic concen-tration gradients in cells, transferring metabolites and nutrients as well as for inter-cellular messages, and are therefore the target of many drugs.2At present, there is an inherent problem with the study of such proteins, due to their instability outside of their membranous environment. Further, reconstituting membrane proteins at high concentration in liposomes or supported bilayers has proved difficult. Methods permitting the manipulation of such proteins could therefore play a significant role for their in-membrane purification, concentration and functional studies. Here we present ‘‘pumping’’ systems for membrane components, such as charged lipids or proteins, based on driven Brownian ratchets implemented in patterned supported lipid bilayers. Asymmetric sawtooth patterns, combined with an AC electric field applied in the plane of the membrane, allowed for the manipulation of charged membrane components.
The example presented shows charged lipids and proteins being ‘‘pumped’’ between two reservoirs. One advantage of this approach is that the AC field is applied orthogonal to the direction of charge movement, making it possible to move
material over relatively large distances, whilst keeping the applied potential low. Unlike movement using DC fields where the potential required increases linearly with distance, using AC fields in the configuration developed here allows the movement over any distance to be achieved, at a fixed potential. This makes the system ideal for use in lab-on-chip devices. Many membrane proteins carry a net charge, and can therefore be manipulated using external electric fields. Previous work has focused on the use of DC fields to induce the migration of charged proteins within cells3 and phospholipids within supported bilayer lipid membranes.4–9This method has also been used to demonstrate the movement of proteins attached to supported lipid bila-yers10–12and also attached vesicles,13due to a combination of electrophoretic and electro-osmotic effects. Recently Liu et al. used the opposing effects of electrophoresis and electro-osmosis to separate membrane-bound proteins into tight bands based on their charge-to-size ratio.14Previously, we have demonstrated the use of ‘‘nested trap’’ patterns in conjunction with AC fields to concentrate transmembrane proteins to significantly greater levels than can be incorporated into solid supported bilayersvia the vesicle fusion route.15
In this paper, we show that it is possible to transfer charged membrane species from one location to another using an AC electric field applied in the plane of an asymmetrically patterned supported bilayer lipid membrane (sBLM). We demonstrate that such patterns act as a ‘‘ratchet’’ to rectify diffusive processes and create net movement in a given direction.16–18 These patterns have been combined and interconnected with other patterns to create a simple system that is able to pump charged membrane components, including lipids and membrane proteins, from one reservoir to another. The bilayers containing the membrane protein CymA were formedviavesicle fusion leading to proteins of both orientations being presented. However, proteins with the aSchool of Physics and Astronomy, University of Leeds, Woodhouse Lane,
Leeds, UK. E-mail: [email protected]; Tel: +44 113 343 3852
bCentre for Molecular and Nanoscale Science, University of Leeds, Leeds,
UK
† Electronic supplementary information (ESI) available: SDS-PAGE analysis of labelled, unlabelled, and reconstituted CymA, a model of CymA, and a video showing the pumping of CymA. See DOI: 10.1039/c2sm25473e
Dynamic Article Links
C
<
Soft Matter
Cite this:
Soft Matter
, 2012,
8
, 5459
www.rsc.org/softmatter
PAPER
Downloaded by University of Leeds on 18 May 2012
extra membranous portion oriented towards the glass substrate were immobile, presumably due to electrostatic interaction with the support. Conversely, those oriented in the opposite direction were mobile. Thus, the manipulation of these proteins leads to a sorting of the proteins to obtain those of predominantly one orientation. Such sorting is expected to be useful for future structure-function studies of membrane proteins.
Experimental
Preparation of lipids
For the experiments presented in Fig. 1 and 2, small quantities of L-a-phosphatidylcholine (EggPC) lipids (Avanti Polar Lipids Inc., Alabaster, AL) were placed in aliquots from a 50 : 50 chloroform/methanol mixture. A small quantity of Texas Red-1,2-Dihexadecanoyl-sn-glycero-3-phosphoethanolamine (TR-DHPE) (Invitrogen Ltd., Paisley, UK) was then added, and the resulting mixture was dried under a stream of nitrogen. The film of dried lipids was re-suspended in Phosphate Buffered Saline (PBS) solution by vortexing until no remaining film could be seen in the vial. The resulting suspension of multilamellar vesicles was then placed in a tip-sonicator (Branson Sonifier 750, Branson Ultrasonics Corp., Danbury, CT) and held at a constant 4 "C until the suspension turned clear. This indicated the formation of small unilamellar vesicles (SUVs). The SUV suspension was then placed in a centrifuge for 1 min at 14500gin order to separate any undesirable titanium particles that had been left by the tip. The supernatant was diluted with PBS down to a lipid concentration of around 0.25 mg ml#1. This was kept refrigerated at 4"C and used within 5 days.
Micro-contact printing of protein
Silicon masters were photolithographically produced from a photomask (Deltamask NL, Netherlands) using SU8-2002 photoresist (Microchem Corp., Newton, MA). Poly-dimethylsiloxane (PDMS) microstamps were created from a mixture of 10 : 1 Sylgard 184 elastomer and curing agent (Dow Corning Corp., Midland, MI). This was poured over the silicon masters and cured in an oven at 60"C for around 18 h. The moulded stamp was then carefully removed from the master, and incubated with a solution containing Fibronectin (Invitrogen Ltd., Paisley, UK) at 0.25 mg ml#1in PBS for 15–20 min. The
incubated stamp was rinsed carefully with MilliQ water, then dried with nitrogen and quickly placed in conformal contact with a piranha-cleaned glass coverslip (Chance Glass Ltd., Malvern Link, UK). The stamp was peeled from the substrate after approximately 5 min, and the substrate was placed in a flow-cell ready for the next stage.
Formation of lipid bilayers
SUVs in PBS at a concentration of 0.25 mg ml#1, produced as
described above, were incubated at room temperature with a substrate, patterned as above, for approximately 60 min. This resulted in the formation of a continuous supported bilayer lipid membrane (sBLM) due to the spontaneous rupture of SUVs at the hydrophilic surface. No bilayer formation occurred in the protein printed regions, resulting in a sBLM with a pattern that was the inverse of the Fibronectin printed pattern on the substrate. Excess SUVs in solution were then rinsed out with MilliQ water, which also removed any vesicles that were adsor-bed to the sBLM,viaosmotic shock.
Fluorescence microscopy
Components of supported membranes that exhibited fluores-cence were imaged using an epifluoresfluores-cence microscope (Nikon Instruments Europe B.V., Kingston, UK). A Texas Red filter block was used for viewing both the Texas Red and ATTO565 fluorophores (Nikon). Digital images were taken with a 12-bit greyscale camera (Hamamatsu Photonics UK Ltd., Welwyn Garden City, UK). Details of the image analysis process can be found online in the Supporting Information.†
Electrophoresis
Sinusoidal electric fields were generated using an arbitrary waveform generator (Thurlby Thandar Instruments Ltd., Hun-tingdon, UK), and were applied in the plane of the membrane in MilliQ water using a home-built flow cell. This consisted of a sample holder with a straight channel beneath, connecting two reservoirs, each with platinum electrodes immersed in the MilliQ water. The electric field strength in the channel was calculated from Gauss’ Law using Finite Element Analysis (FEA). Oxida-tion and reducOxida-tion at the two electrodes was necessary to prevent the build-up of an electric double-layer. This gave rise to currents of 10–100 mA throughout the experiments, which were moni-tored using a Keithley Picoammeter (Keithley Instruments Ltd., Theale, UK).
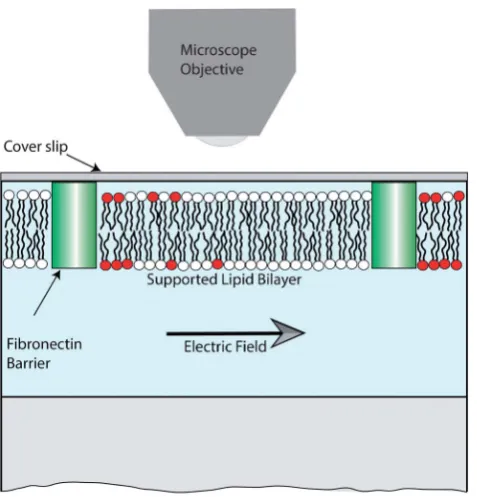
Fig. 1 Schematic of the experimental setup. The patterned sBLM was present on the lower surface of a glass coverslip, sealed inside a Perspex flow-cell. A small number of lipids were fluorescently labelled (shown red), allowing for imaging using fluorescence microscopy. The figure is not to scale.
Downloaded by University of Leeds on 18 May 2012
Published on 12 April 2012 on http://pubs.rsc.org | doi:10.1039/C2SM25473E
[image:3.595.49.288.420.669.2]Computer modelling
COMSOL Multiphysics was used together with the Chemical Engineering module (COMSOL Ltd., Hatfield, UK) for the finite element analysis (FEA) calculations and post-processing. The equation system was solved using a triangular mesh with a typical element size of 5mm. The element size was allowed to
vary depending on the size of local features in the pattern geometry. The number of TR-DHPE molecules within the pattern was assumed to be conserved, such that the time-dependent behaviour of the concentration profile, C, of TR-DHPE could be modelled using the Nernst-Planck equation,
vtC(r,t)¼V$(#DVC(r,t) +zemC(r,t)VV(r,t)), (1)
where V(r,t) is the spatially and temporally varying electric potential, and NA is Avogadro’s number. The electrophoretic mobilitymis related to the diffusivityD viathe Einstein relation, m¼aD/RT, whereRis the ideal gas constant,Tis the absolute temperature, andais a reduction factor due to electro-osmotic drag reported previously.4,5Diffusivity values for the patterned sBLMs were found to be around 1.5mm2s#1for TR-DHPE in
EggPC at 22 "C, via Fluorescence Recovery After Photo-bleaching (FRAP).19,20 This diffusivity value was used in the modelling, along withz¼ #1 andT¼295 K. Further details of the model can be found in the Supporting Information.†
Protein labelling
CymA was purified from an over-expressing strain ofShewanella oneidensisMR-1 essentially as described by Fieldet al.21Protein concentration was determined using a bicinchoninic acid (BCA) protein assay kit (Sigma) using bovine serum albumin at various concentrations as standards. Prior to labelling, CymA in 20mM
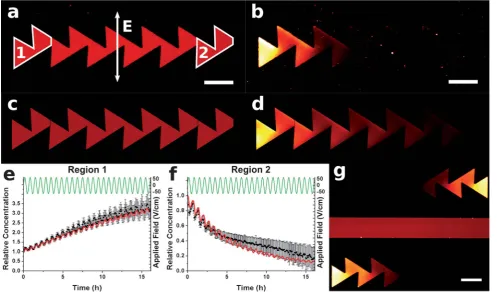
Fig. 2 Fluorescence micrographs showing TR-DHPE in the patterned sBLM (a) before and (b) after application of an AC electric field for 16 h. FEA calculated images are shown in (c) and (d) for comparison, respectively. The relative average concentration of TR-DHPE (C/C0) is shown in (e) and (f) for the regions labelled 1 and 2, respectively. Red lines represent theory, black squares experiment, and the green lines show the applied electric field. Panel (g) is a fluorescence micrograph showing two patterns of opposing direction, to ensure the motion was due to the ratchet effect, and not due to stray electric fields. The initial concentration,C0, was 0.2 mol%. Scale bar 100mm.
Fig. 3 Plot showing the distancey1moved by charged species towards the upper set of teeth, during the second half cycle, in the time taken for the diffusion length to reachw¼70mm. The plot shows four distinct operating regimes.
Downloaded by University of Leeds on 18 May 2012
[image:4.595.52.550.54.346.2] [image:4.595.48.283.424.586.2]HEPES, 0.05% dodecyl maltoside (DDM) was concentrated to 3.71 mg ml#1using a vivaspin 2 (Sartorius Stedim Biotech S.A.,
France) size exclusion chromatography spin column with 50 kDa cut-off. The concentrated protein was examined with a UV-2 UV/Vis spectrophotometer (Unicam) and had the spectrum typical of oxidised CymA with a Soret absorption peak at 410 nm,21 indicating that concentration had not disrupted the protein structure. CymA samples were labelled with ATTO565 fluorescent dye functionalized with N-hydroxysuccinimide (NHS) active ester group (ATTO-TEC GmbH, Siegen, Ger-many). The labelling reaction was carried out at pH 8.3 for 1 h at room temperature to allow the nucleophilic attack of deproto-nated primary amine groups (coming from the N-terminus of the protein) and surface exposed lysine residues of pKa< 8.3 (on the
NHS-ester of the ATTO565 dye). The protein was labelled using 5-fold molar excess of dye to protein and purified with Centri-10 size exclusion chromatography spin columns with a 5 kDa cut-off (Princeton Separations). Labelling of the CymA with ATTO565 was confirmed by electrophoretic analysis on 15% polyacrylamide gels in the presence of 0.1% sodium dodecyl sulphate (SDS) using the buffer system of Laemmli.22 Poly-peptide bands were visualized initially pre-staining and then using Simply Blue! Safe Stain (Invitrogen) as illustrated in
Supplementary Figure 1.† Unlabelled CymA appeared red in the pre-stained gel due to the covalently bound hemes. Labelled CymA appeared pink due to the properties of ATTO565.
Protein reconstitution
On the day of reconstitution, POPC lipid vesicles (Avanti Polar Lipids Inc., Alabaster, AL) were prepared in 20 mM HEPES, 10 mM NaCl (pH 7.4; buffer A) to a concentration of 20 mg ml#1by
extrusion through a 200 nm track-etch polycarbonate membrane using a mini-extruder (Avanti). ATTO-labelled CymA was introduced into POPC liposomes by the method based on that of Carter et al.23Lipid vesicles, octylglucoside (OG) and CymA-ATTO565 were mixed by inversion to final concentrations of 16.4 mg ml#1lipid, 45 mM OG and 55mg ml#1labelled protein/
lipid respectively. After 15 min incubation on ice, the lipid/ protein mixture was rapidly diluted 200 fold with buffer A, pre-cooled to 4"C, and centrifuged at 142,000gfor 1 h to pellet the proteoliposomes. The proteoliposomes were re-suspended in the same volume of fresh cold buffer A and centrifuged at 142,000g for 1 h to pellet the proteoliposomes. Proteoliposomes were re-suspended in 1 ml cold buffer A and extruded through a 200 nm track-etch polycarbonate membrane using a mini-extruder
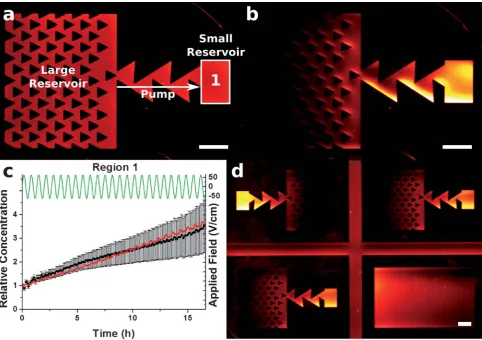
Fig. 4 Fluorescence micrographs showing TR-DHPE being pumped between two reservoirs. Panel (a) shows the pattern before, and (b) shows the pattern after the application of an AC electric field for 16.5 h. The relative average charge concentration (C/C0) is plotted in (c) for the region labelled 1, with the red line representing theory, black squares experiment, and green line the applied electric field. Panel (d) is a fluorescence micrograph showing patterns in opposing directions, and a blank channel, to ensure motion was primarily due to the ratchet effect. The initial concentration,C0, was 0.5 mol %. Scale bar 100mm.
Downloaded by University of Leeds on 18 May 2012
Published on 12 April 2012 on http://pubs.rsc.org | doi:10.1039/C2SM25473E
[image:5.595.57.540.52.392.2](Avanti) to ensure uni-lamellar homogeneous vesicles. The homology model of CymA based on the D. vulgaris NrfH24 crystal structure (found in Supplementary Fig. 2 in the Sup-porting Information†) was created using SWISS-MODEL.25
Results
Patterned sBLMs were formed by incubating a PBS solution containing SUVs, with clean glass coverslips that had been micro-contact printed with Fibronectin using previously repor-ted protocols.15,26,27Incubation induces spontaneous rupture of SUVs at the hydrophilic glass surface, forming a continuous bilayer in regions where no printed Fibronectin is present. The sBLM was allowed to form for around 60 min after which it was rinsed with MilliQ water. Migration of the TR-DHPE was induced by applying an AC electric field in the plane of the membrane, as illustrated in Fig. 1.
Double sawtooth ratchet
The first pattern investigated consisted of a double sawtooth, as shown in Fig. 2. Following bilayer formation, the TR-DHPE was uniformly distributed within the bilayer, as shown (red) in Fig. 2(a). A sine-wave electric potential was then applied in the plane of the sBLM in the direction indicated, causing the TR-DHPE to migrate. During the first and second quarters of an AC cycle, the charged TR-DHPE was driven into the gullets of the lower set of teeth. Upon reversal of the field direction, in the third quarter of the cycle, this material was driven electrophoretically from the gullets of the lower teeth towards the upper set of teeth.
Once it had risen above the tips of the lower teeth, it was able to diffuse over those to the left. The offset in the alignment between the lower and upper teeth was such that the material transferred to the next upper tooth to the left but not undergo the significant diffusion that would be required in order to transfer it to the next tooth to the right. Then during the fourth quarter of the cycle, the charge was driven against the slanted barriers of the upper set of teeth, creating a significant movement to the left. Because the net flux was greater to the left than the right, most of the material was transferred in this direction during each cycle. Repeated cycling thus caused a net motion of all charged components to the left.
The distribution of the charged lipid after the AC field was applied for 24 cycles (16 h) is shown in Fig. 2(b). A clear build-up of TR-DHPE can be seen in region 1, while very little remained in region 2.
For optimal operation the charged species must be driven, by the external field, at least the distancea(schematic, Fig. 3) in the time taken for diffusion to equal the distance w (in this case, 70mm). The timet1taken for the charge to diffuse this distance is
approximately 13.6 min (assumingw¼pffiffiffiffiffiffiffiffiffiffi4Dt1). The distancey1
that the charge will move out of the lower set of teeth in this time can then be found by integrating the drift velocity.
y1¼
ð
s=2þt1
s=2
azeD kBT
E0sin
#
2pt
s
$
dt¼ azeDE2pk 0
BT
s
#
1#cos
#
2pt1 s
$$
;
(2)
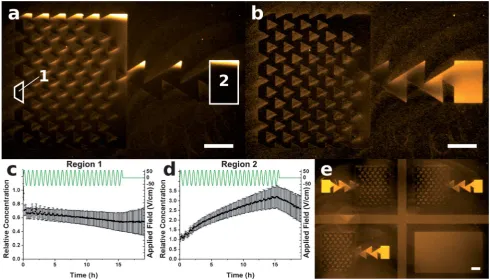
wherezandeare the valence (#1 for TR-DHPE) and elementary charge, respectively;E0is the AC field amplitude,sis the AC Fig. 5 Fluorescence micrographs showing the pumping of ATTO565-CymA between reservoirs. Panels (a) and (b) show the pattern before and after applying an AC field for 16.5 h, respectively. Integral plots (c) and (d) show the relative average concentration,C/C0, in the regions labelled 1 and 2, respectively (black squares). The green lines represent the applied electric field. Panel (e) shows back-to-back devices, and a blank channel, to ensure the ratchet effect was the primary source of movement. The initial concentration,C0, was 0.25% (w/w). Scale bar 100mm.
Downloaded by University of Leeds on 18 May 2012
[image:6.595.52.543.53.332.2]period, kB is Boltzmann’s constant, and T is the absolute
temperature. The parameteraaccounts for electro-osmotic drag effects, and is discussed later.
A plot of the distancey1that the lipid has been driven by the
field, as a function of AC time period s is shown in Fig. 3, assuming that the electric field amplitude was fixed at 62 V cm#1.
In the first half period the charged species were driven into the gullets of the lower teeth. In the second half period several different operating regimes can occur depending on the time period chosen (see Fig. 3). In Regime 1, the distancey1migrated
by the charge is less thanaand therefore in the next half-cycle the species would be driven back to their original starting point. For Regime 2 wherea<y1<hthen some diffusion to the left would
occur leading to a small net movement in that direction, though the majority of the charged species would still return to their original position. In Regime 3 where h< y1< h+ g, greater
diffusion could occur to the left. In this case a net motion to the left would be created during the next half-cycle. Finally for Regime 4,y1>h+g, and there would be a driving force from the
upper tooth in addition to diffusion, causing significant motion of the charged species to the left. This is the ideal regime to be working in, whereby both diffusion and the driving force are working together as a ‘‘diffusion-aided’’ ratchet. From such considerations the AC period was initially estimated to be around 35 min, for singly charged components with a diffusivity of 1.5 mm2 s#1 (i.e. for a typical phospholipid probe), at
a temperature of 295 K. FEA modelling was used to determine the optimal AC period, which was found to be 40 min for the structures shown. FEA images corresponding to the experi-mental fluorescence micrographs are shown in Fig. 2(c) and 2(d). Fig. 2(e) and 2(f) show the time variation of the average TR-DHPE concentration in regions 1 and 2, determined experi-mentally (black squares) and by FEA modelling (red lines). The data shows a 3-fold concentration increase for region 1. Fig. 2(g) shows adjacent patterns oriented in opposing directions, after the application of the field. It is evident that the TR-DHPE migrates in opposite directions along the opposing patterns, demon-strating that the motion is due to the ‘‘ratchet’’ effect, and not to stray components of the applied field. For TR-DHPE, previous work has shown the need to include an electro-osmotic drag factora¼0.64,5into eqn (1) and (2). Here however, the best fit obtained between theory and experiment was found whena¼ 0.27, significantly lower than expected. This effect could be explained by having a reduced mobility in the TR-DHPE. We have previously observed a reduced mobility, in high TR-DHPE containing regions, for different patterns.15 Further, a recent computational study by Skauget al.suggests that the presence of TR-DHPE reduces the diffusivity within a lipid membrane due to binding with unlabelled lipids.28TR-DHPE however also self-quenches at high concentration leading to unexpected properties, for example directed towards a patterned barrier by a DC field, the steady-state profile appears to follow a sigmoidal shape, rather than the exponential shape found for other fluorophores.10
Charge pumps
In the second set of devices (shown in Fig. 4), the double-sawtooth pattern was combined with large and small reservoirs, to demonstrate the possibility of ‘‘pumping’’ charged species
from one to the other. The array of small triangular structures in the large reservoir was present to increase the rate of migration of charge towards the double-sawtooth ‘‘pump’’ region. The fluorescence micrographs in Fig. 4(a) and 4(b) show the patterned sBLM before and after application of an AC electric field for 25 cycles (16.5 h), respectively. The amplitude was 62 V cm#1, and the time period 40 min. The pump
trans-ferred the charged species into the smaller reservoir over a number of AC cycles. Fig. 4(c) shows plots of the relative average concentration in region 1, and 4(d) shows a fluorescence image of the final state of four adjacent patterns on the sample. The fact that build-up was seen in the small reservoir of opposing direction patterns demonstrates that the pumping is the primary mechanism of movement. The blank channel in the lower-right part shows that there was a small net motion to the left, presumably due to stray fields in the device. However, the pumps appeared to be unaffected by this and could effec-tively pump against this gradient. The best fit of the FEA data for this experiment was obtained whena¼0.36, giving a 3.5-fold concentration increase in region 1. The reservoir and pump sizes presented in Fig. 4 were chosen only for imaging purposes, and can be as large as desired, or indeed even open-ended.
Pumping transmembrane proteins
Using this approach it was also possible to pump transmembrane proteins between the two reservoirs. This was achieved by forming a patterned sBLM from proteoliposomes containing 0.25% (w/w) ATTO565-labelled CymA. CymA is a c-type tet-raheme with a size of 20 kDa, and contains a putative membrane-spanninga-helix.21This protein is well suited for electrophoresis experiments in a sBLM, because it only has a large extra-membrane domain on one side. Upon formation of a sBLM from such proteoliposomes, one would expect that the CymA would be present in both orientations,i.e.with approximately 50% of proteins oriented such that the extra-membrane domains protrude towards the surface and 50% towards the bulk solution. Initially, the ATTO565-CymA was uniformly distributed at a concentration of approximately 0.25% (w/w) within the patterned sBLM, as shown in the fluorescence micrograph in Fig. 5(a). After an AC field is applied for 25 cycles (16.5 h), the majority of this protein was pumped into region 2, as shown in Fig. 5(b). Panels (c) and (d) show plots of the normalised average protein concentration of regions 1 and 2, respectively. It can be seen from the plots that the CymA concentration in region 1 does not drop below around 50% of the initial concentration, implying that a 50 : 50 mixture of CymA in the upper and lower leaflets was present, and that the CymA in the lower leaflet was not mobile. The concentration plot for region 2 shows that a 3-fold concentration increase is achieved, which, given the initial 50 : 50 mixture of CymA orientations just noted, would correspond to a!5-fold increase in the concentration of protein oriented such that its extra-membranous portion was away from the substrate, with no change in the lower. This selective sorting of proteins of one orientation shows that this approach can be used not only to locally enhance the concentration of species, but provides the ability to control asymmetry in the composition. It is also interesting to note that any immobile components present in a membrane are known to impede diffusion of the fluid
Downloaded by University of Leeds on 18 May 2012
Published on 12 April 2012 on http://pubs.rsc.org | doi:10.1039/C2SM25473E
components.29The concentration of immobile CymA in this case however, is considerably lower than that required for impeded diffusion to become significant.
The electric field was switched off at 16.5 h, and the CymA allowed to freely diffuse. Due to diffusion being restricted by the pattern, around 75% of the CymA that was pumped into region 2 still remained there several hours after the field was removed. Fig. 5(e) again shows adjacent patterns in opposing directions, demonstrating that the movement of CymA is due to the ratchet effect.
Conclusions
We have shown a novel method for the manipulation of charged membrane components (lipids and proteins), whilst maintaining them within their lipid environment. In particular, we have demonstrated a simple ‘‘pumping’’ device that can be used to move charged species in a given direction between well-defined regions. The patterned geometries have great potential for expansion, and with tuning of their feature dimensions could be used to create arrays of different sizes of ratchets each of which would pump only those membrane components with transport properties close to those for which the ratchet has been tuned. We also note that with slight modification it is possible to use this method to separate species according to their charge polarity. Whilst the reservoirs used here were kept close together and relatively small for visualisation and analysis purposes, this is not a limitation of the approach. Indeed the use of narrow sawtooth channels and AC fields allows materials to be pumped over relatively large distances whilst keeping the applied potential required essentially constant. Finally, due to the fact that the field moved only proteins of one orientation we have been able to demonstrate the selective sorting of membrane proteins.
Notes and references
1 A. Krogh, B. Larsson, G. von Heijne and E. L. Sonnhammer,J. Mol. Biol., 2001,305, 567.
2 J. P. Overington, A. Bissan and A. L. Hopkins,Nat. Rev. Drug Discovery, 2006,5, 993.
3 M. Poo and K. R. Robinson,Nature, 1977,265, 602.
4 M. Stelzle, R. Miehlich and E. Sackmann,Biophys. J., 1992,63, 1346. 5 J. T. Groves and S. G. Boxer,Biophys. J., 1995,69, 1972.
6 J. T. Groves, N. Ulman and S. G. Boxer,Science, 1997,275, 651. 7 J. T. Groves, S. G. Boxer and H. M. McConnell,Proc. Natl. Acad.
Sci. U. S. A., 1997,94, 13390.
8 S. Daniel, A. J. Diaz, K. M. Martinez, B. J. Bench, F. Albertorio and P. S. Cremer,J. Am. Chem. Soc., 2007,129, 8072.
9 P. S. Cremer, J. T. Groves, L. A. Kung and S. G. Boxer,Langmuir, 1999,15, 3893.
10 J. T. Groves, C. W€ulfing and S. G. Boxer,Biophys. J., 1996,71, 2716. 11 M. Tanaka, J. Hermann, I. Haase, M. Fischer and S. G. Boxer,
Langmuir, 2007,23, 5638.
12 X. Han, M. R. Cheetham, K. Sheikh, P. D. Olmsted, R. J. Bushby and S. D. Evans,Integr. Biol., 2009,1, 205.
13 C. Yoshina-Ishii and S. G. Boxer,Langmuir, 2006,22, 2384. 14 C. Liu, C. F. Monson, T. Yang, H. Pace and P. S. Cremer,Anal.
Chem., 2011,83, 7876.
15 M. R. Cheetham, J. P. Bramble, D. G. G. McMillan, L. Krzeminski, X. Han, B. R. G. Johnson, R. J. Bushby, P. D. Olmsted, L. J. C. Jeuken, S. J. Marritt, J. N. Butt and S. D. Evans,J. Am. Chem. Soc., 2011,133, 6521.
16 A. Van Oudenaarden and S. G. Boxer,Science, 1999,285, 1046. 17 R. D. Astumian,Science, 1997,276, 917.
18 J. S. Bader, R. W. Hammond, S. A. Henck, M. W. Deem, G. A. McDermott, J. M. Bustillo, J. W. Simpson, G. T. Mulhern and J. M. Rothberg,Proc. Natl. Acad. Sci. U. S. A., 1999,96, 13165. 19 D. Axelrod, D. E. Koppel, J. Schlessinger, E. Elson and W. W. Webb,
Biophys. J., 1976,16, 1055.
20 S. Seiffert and W. Oppermann,J. Microsc., 2005,220, 20.
21 S. J. Field, P. S. Dobbin, M. R. Cheesman, N. J. Watmough, A. J. Thomson and D. J. Richardson,J. Biol. Chem., 2000,275, 8515. 22 U. K. Laemmli,Nature, 1970,227, 680.
23 K. Carter and R. B. Gennis,J. Biol. Chem., 1985,260, 10986. 24 M. L. Rodrigues, T. F. Oliveira, I. A. C. Pereira and M. Archer,
EMBO J., 2006,25, 5951.
25 K. Arnold, L. Bordoli, J. Kopp and T. Schwede,Bioinformatics, 2005,
22, 195.
26 A. Bernard, J. P. Renault, B. Michel, H. R. Bosshard and E. Delamarche,Adv. Mater., 2000,12, 1067.
27 L. A. Kung, L. Kam, J. S. Hovis and S. G. Boxer,Langmuir, 2000,16, 6773.
28 M. J. Skaug, M. L. Longo and R. Faller,J. Phys. Chem. B, 2011,115, 8500.
29 P. C. Ke and C. A. Naumann,Langmuir, 2001,17, 5076.
Downloaded by University of Leeds on 18 May 2012
Soft Matter
Supporting Information
This journal is © The Royal Society of Chemistry [year] [journal], [year], [vol], 00–00 | 1
Membrane Pumps for the Manipulation and Sorting of Proteins using
AC Electric Fields
Matthew R. Cheetham, Jonathan P. Bramble, Duncan G. G. McMillan, Richard J. Bushby, Peter D.
Olmsted, Lars J. C. Jeuken and Stephen D. Evans
Fluorescence Image Analysis
5
Background images were taken prior to an experiment, and were subtracted from the fluorescence data to allow for the fluorescence and concentration to be directly related. The fluorescence images were analysed to give the relative average charge concentration, C /C0, in chosen regions, via the equation 10
C sub(t) C0
=
I(r,t)d2r
sub d2r
sub
−B I(r,t)d2r
ref
d2r
ref
−B
−1
, (1)
Where I(r,t) represents the fluorescence intensity data at time t,
I(r,0) represents the fluorescence intensity data in the image
15
taken at the start of the experiment, and B is the background noise (obtained from an image taken of the same system with no fluorescent components). The suffix sub refers to a fluid and connected region in the pattern, whilst the suffix ref refers to a reference region. The reference region for the pattern in Figure 2
20
was the entire enclosed fluid pattern (on the pretence that the total amount of fluorescent material in the whole pattern remains constant). For the pattern in Figures 3 and 4, it was impractical to do this, so the reference region was a patch of Fibronectin that had a small quantity of non-specifically bound fluorescent
25
components (the same components that were present in the sBLM). These fluorescent molecules were immobile, but
photobleached at the same rate as the molecules in the sBLM, and as such a patch of the Fibronectin pattern was suitable as a reference region. This accounted for both background noise, and
30
for the photobleaching effect that occurred every time an image was taken, allowing for the increase of charge concentration to be quantified, for direct comparison with theoretical predictions.
Finite Element Model Setup and Analysis
The Nernst-Planck equation was solved in 2D for the patterns
35
shown in Figures 2, 4 and 5, with the electric potential being input as a time-dependent linear gradient across the pattern. The exterior boundary conditions were all set to the symmetry condition n⋅J=0, where J is the flux of the concentration C. The oscillating sine-wave electric field had an amplitude of 62
40
V/cm. The solutions to these equations were used to obtain the average charge concentration in regions of interest. The relative average charge concentration
0
/C
C for a given subdomain is
defined by the equation
45
=
sub sub
sub t C C t d r C d r
C 2
0 2 0 ( ,) )
( r , (2)
where C is the concentration of charge and C0 is the initial
concentration of charge. The suffix sub refers to any arbitrary region for which there exists values of C throughout.
50 Electronic Supplementary Material (ESI) for Soft Matter
2 | Journal Name, [year], [vol], 00–00 This journal is © The Royal Society of Chemistry [year]
Supplementary Figure 1: SDS-PAGE analysis of the reconstituted and ATTO565 labeled CymA by SDS-PAGE. Samples were resolved on 15% polyacrylamide gel and photographed under white light (Panel A) before staining with Simply Blue Safe Stain (Panel B). Lane 1, High-Range Rainbow molecular weight ladder (GE); Lane 2, 10 µg of concentrated CymA; Lane 3, 2 µg of CymA proteoliposomes; Lane 4, 2 µg of CymA-ATTO565 Lane 5, 0.5 µg of CymA-ATTO565 proteoliposomes.
5
Supplementary Figure 2: Electrostatic surface model of CymA (Panel A). The red and blue regions show negative and positive charged areas respectively, whilst the yellow and orange CPK atomic models show the heme prosthetic groups and bound quinone respectively. For clarity, the cartoon model of CymA is shown in the same orientation as the surface model (Panel B). The electrostatic surface model is displayed using Pymol (Delano Scientific) and the cartoon model using Accelrys DS Visualiser 1.7 (Discovery Studio).
10