Int. J. Electrochem. Sci., 4 (2009) 1167 - 1177
International Journal of
ELECTROCHEMICAL
SCIENCE
www.electrochemsci.org
Electrochemical Sensor for Voltammetric Determination of
Catechol Based on Screen Printed Graphite Electrode
Gaber A. M. Mersal*
Chemistry Department, Faculty of Science, South Valley University, Qena, Egypt
*E-mail: [email protected]
Received: 17 July 2009 / Accepted: 12 August 2009 / Published: 25 August 2009
A simple, rapid and a highly selective method for the direct electrochemical determination of catechol based on the electrochemical oxidation at the screen printed graphite electrode was discussed. The electrochemical behavior of catechol was studied by cyclic voltammetric techniques at the screen printed graphite electrode. Catechol showed one anodic peak (Epa) and one cathodic peak (Epc) at 204
and 145 mV (vs. SCE), respectively, in phosphate buffer (pH 6). Square wave voltammetry was used for the direct electrochemical determination of catechol. The effect of different experimental and instrumental parameters such as; type of supporting electrolytes, solution pH, applied potential, and scan rate were examined. The oxidation peak currents showed a linear range from 1x10⁻⁶ to 1x10⁻⁴ M with a 0.999 correlation coefficient. A 2.9x10⁻⁷ M lower detection limit was obtained. The effect of ascorbic acid as the most interfering substances on the peak height of catechol was examined. Using square wave voltammetry, catechol and ascorbic acid showed a well defined two separated oxidation peaks. The proposed method has been applied for the determination of catechol in the absence and presence of ascorbic acid in a water sample.
Keywords: Screen printed graphite electrode, Catechol, Cyclic voltammetry, Square wave
voltammetry
1. INTRODUCTION
The electrochemistry of several organic and inorganic compounds has been investigated [1, 5-10] at the surface of screen printed electrodes. Due to the importance and involvement of phenolic compounds in different fields- such as environmental, medical, food industry, their electrochemical behavior were examined using different types of sensors and biosensors [11-13].
Catechol (1,2- dihydroxybenzene) is one of the most important phenolic compounds which occurs naturally in fruits and vegetables and can be released to the environment during its manufacture and use. It is also detected at low levels in, groundwater, drinking-water, soil samples and in wastewaters from coal conversion. Catechol has a great importance in both biological and environmental analysis fields and this due to its excellent electrochemical activity and can be used for the characterization of different analytical methods. Different analytical methods were used for the determination of catechol such as spectrophotometry [14, 15] and high-performance liquid chromatography [16]. The electrochemical determination of catechol was also studied using enzymatic [17-23] or non enzymatic electrodes [24-32]. The enzymatic method for the determination of catechol suffers from some disadvantages such as high cost due to the enzyme used, low stability and limited binding of the enzyme to solid surfaces [24]. The non enzymatic electrodes used for studying the direct electrochemistry of catechol was also examined using different types of electrodes such as mesoporous platinum [25-26] and gold electrode [27]. The direct electrochemical determination of catechol based on the oxidation of catechol at the electrode surface to o-quinone. Different kinds of electrodes were used for the electrochemical determination of catechol such as Born-Doped Diamond electrode [28], chemically modified electrodes such as carbon nanotube (CNT) [29], multiwall carbon nanotubes (MWNT) [28,30-31], modified glassy carbon electrodes (GCE) [32].
Modification of the electrodes increased the selectivity of detection but have a high cost due to the modifiers used. Using carbon nanotubes increased also the cost of the used electrodes. From the literature survey no screen printed electrodes were used for the electrochemical determination of catechol. The aim of this work is to study the electrochemical behavior and the direct electrochemical determination of catechol by incorporating both the advantages of graphite screen printed electrodes and the advantages of electrochemical techniques which lead to a low cost, more simplicity and increasing the sensitivity, selectivity and reproducibility of the method.
2. EXPERIMENTAL PART
2.1. Electrode and electrochemical instruments
conductivity of the graphite. The graphite paste was Electrodag 421SS (Acheson Colloids, Plymouth, UK) and the gold paste was No. 5715, and the AgPd-paste used for connecting lines was No. 7474 (DuPont, Bad Homburg, Germany). The isolation of connecting lines was achieved by printing isolating pastes, which were insulation 240-SB (ESL Europe, Munich, Germany). The ceramic substrates were obtained from LaserTec Services (Nürnberg, Germany). Printing was carried out using the half-automatic printing machine Microtronic II (EKRA, Kirchheim, Germany). All metal-based pastes and the glass passivation were fired for 60 min with a peak temperature of 850˚C (10 min) in a Firing oven BTU 7354-M (BTU, Farnborough, UK) according to the paste manufacturers recommendations. SCE was used as a reference electrode and platinum wire was used as a counter electrode. The supporting electrolyte was filled in the electrochemical cell (10 mL) and catechol added to the cell to get the desired concentration. The pH values were measured using a Metrohom pH-meter with a combined glass electrode
2.2. Reagents
All chemicals used were of analytical grade and used without any further purification. Catechol and ascorbic acid were obtained from Sigma-Aldrich. Phosphate buffer solution was prepared by mixing suitable amounts of 0.1 M Na2HPO4 and NaH2PO4. H3BO3, NaOH, KCl, H3PO4, CH3COOH
were of obtained from Merck. Stock solutions of catechol were freshly prepared daily. Double distilled water was used for the preparation of solutions.
3. RESULTS AND DISCUSSION
3.1. Electrochemical behavior of catechol
The electrochemical behavior of catechol was examined using cyclic voltammetry at a graphite screen printed electrode. Catechol gave two redox peak potentials, one anodic peak potential (Epa) and
one cathodic peak potential (Epc) at 204 and 145 mV, respectively. The difference between the
oxidation and reduction peaks (∆Ep) for catechol at screen printed graphite electrode was 58 mV. This
indicates that the oxidation of catechol is a reversible behavior and 1-electron transfer step. The general scheme for the electrochemical oxidation of catechol indicated by 2-electron transfer step. For screen printed graphite electrode 2- electron transfer step was indicated. This can be expressed by the lack of stability due to the polymerization of the products, which may result from 1-electron transfer reactions coupled to the formation of radicals which then polymerize. The effect of number of cycles was examined from 1 to 10, and no remarkable effect was obtained in the number of cycles examined. 3.2. Effect of supporting electrolyte and pH
catechol gave the highest oxidation peak current in 0.1 M phosphate buffer, therefore phosphate buffer was selected for further studies.
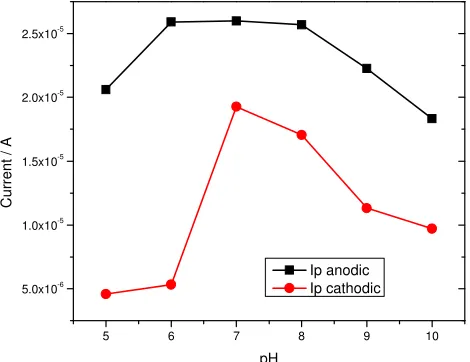
The effect of pH on the peak current and peak potential of the anodic and cathodic peaks of catechol were examined in the range from 5 to 10 using 0.1 M phosphate buffer. Figure 1a showed the obtained results for 1.0 mM catechol.
Figure 1a
.
The effect of pH on (a) the peak current response (b) peak potential of 1mMCatechol 0.1 M phosphate buffer pH 6, using screen printed graphite Electrode. Scan rate 10 mVs-1.
Figure 1b
.
The effect of pH on (a) the peak current response (b) peak potential of 1mMcatechol. Other conditions are the same as Fig. 1a
This Fig. showed the dependence of the oxidation and reduction peaks on the pH of the supporting electrolyte. The oxidation peak for catechol increased up to pH 6 and still stable from pH 6 to pH 8 and at higher pH values the oxidation peak decreased. Also the reduction peak current of catechol increased from pH 5 to pH 7 and at higher pH values the peak current response deceased. From Figure
5 6 7 8 9 10
5.0x10⁻⁶ 1.0x10⁻⁵ 1.5x10⁻⁵ 2.0x10⁻⁵ 2.5x10⁻⁵
C
u
rr
e
n
t
/
A
pH
Ip anodic Ip cathodic
5 6 7 8 9 10
-0.05 0.00 0.05 0.10 0.15 0.20 0.25 0.30
E
(
V
)
pH
[image:4.612.196.431.153.334.2] [image:4.612.181.444.389.597.2]
1a it was clearly that the oxidation peak response is higher than the reduction peak current response, so the oxidation peak was selected for the analytical determination of catechol for further investigations at pH 6.
The effect of pH on the peak potentials of catechol was examined from pH 5 to pH 10, by increasing the pH of supporting electrolyte the peak potential for anodic and cathodic peaks shifted to more negative values (Figure 1b).
The effect of ionic strength for the phosphate buffer on the anodic peak current of 1.0 mM catechol was studied using 0.05, 0.1, 0.15, 0.2 M phosphate buffer at pH = 6. By increasing the ionic strength of the supporting electrolyte, the peak current increased, so 0.2 mM phosphate buffer pH = 6 was chosen for further studies.
3.3. Effect of the applied potential
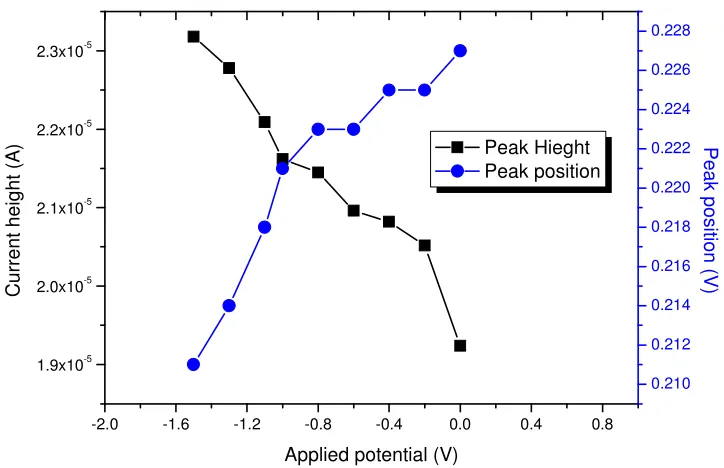
[image:5.612.126.488.411.645.2]The effect of applied potential on the anodic and cathodic peak currents was investigated using a wide range from -1.6 V to 0.0 V. For anodic and cathodic peak currents, by shifting the applied potential to more positive values the peak currents decreased (Figure 2). The effect of applied potential on the anodic and cathodic peak position was also examined. By shifting the potential to more positive value, no remarkable effect on the cathodic peak potential was observed, but for anodic peak, a little shift towards more positive values was observed (Figure 2).
Figure 2. The effect of applied potential on the anodic peak current and anodic peak potential for 0.1
mM catechol in 0.1 M phosphate buffer pH 6, using screen printed graphite Electrode. Scan rate 10 mVs-1
-2.0 -1.6 -1.2 -0.8 -0.4 0.0 0.4 0.8 1.9x10⁻⁵
2.0x10⁻⁵ 2.1x10⁻⁵ 2.2x10⁻⁵ 2.3x10⁻⁵
Peak Hieght Peak position
Applied potential (V)
C
u
rr
e
n
t
h
e
ig
h
t
(A
)
0.210 0.212 0.214 0.216 0.218 0.220 0.222 0.224 0.226 0.228
P
e
a
k
p
o
s
itio
n
(V
3.4. Effect of scan rate
The effect of scan rate (ν) on the cyclic voltammetric response was investigated, results
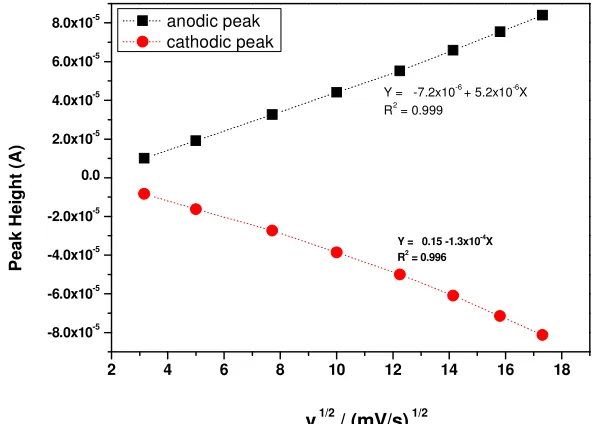
obtained are depicted in Figure 3a. It can be seen that by increasing the scan rate, the anodic and cathodic peak currents increased, and both anodic and cathodic peak potentials moved. The anodic peak potential shifted to more positive potential values, while that of cathodic peaks shifted to more negative values. From the plotting the relation between the square root of scan rate (ν1/2) versus the
[image:6.612.177.445.216.420.2] [image:6.612.139.438.468.680.2]peak current, it was found that the peak current proportional to the square root of scan rate in the range from 10 to 300 mVs-1 for anodic and cathodic peaks (Figure 3b).
Figure 3(a) Cyclic voltammograms for 1 mM catechol at different scan rates: a) 10, b) 25, c) 50, d)
100, e) 150, f) 200 and g) 250 mV/s.
Figure 3(b) Effect of scan rate on the peak current response of 1.0 mM catechol in 0.2 M phosphate
buffer pH 6, scan rate 50 mV s-1.
2 4 6 8 10 12 14 16 18
-8.0x10⁻⁵
-6.0x10⁻⁵
-4.0x10⁻⁵
-2.0x10⁻⁵
0.0
2.0x10⁻⁵
4.0x10⁻⁵
6.0x10⁻⁵
8.0x10⁻⁵
Y = 0.15 -1.3x10⁻⁴
X R2
= 0.996
Y = -7.2x10⁻⁶ + 5.2x10⁻⁶
X R2 = 0.999
P
e
a
k
H
e
ig
h
t
(A
)
v 1/2 / (mV/s) 1/2
3.5. Calibration curve and Detection limit
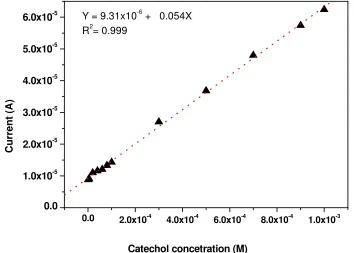
Square wave voltammetry was used for the direct determination of catechol. Catechol showed a well defined anodic peak using the following optimum conditions: screen printed graphite electrode as a working electrode, square wave voltammetry with 0.05 V step time, 0.02 V amplitude in 0.2 M phosphate buffer (pH = 6). Catechol showed a linear range from 1x10⁻⁶ to 1x10⁻⁴ M (Figure 4) with a correlation coefficient of 0.9997 and a standard deviation of 7.677 x10⁻⁷. The detection limit for catechol was calculated based on a three signal to noise ration and it was found of 2.9x10⁻⁷ M
Figure 4. Relationship between the response current and catechol concentration using square wave
voltammetry. Parameters are reported in the text. 3. 6. Reproducibility
The reproducibility of the results was examined by successive ten measurements of 1x10⁻⁴ M catechol using the optimum conditions mentioned above. The relative standard deviation (RSD) was calculated and it was found to be 3.9%. Also the reproducibility of the screen printed graphite electrode response was examined by the determination of 1X10⁻⁴ M Catechol using ten screen printed electrodes and the RSD was found with 2.4% which indicated that this method give a good reproducibility for the obtained results.
3.7. Effect of Interferences
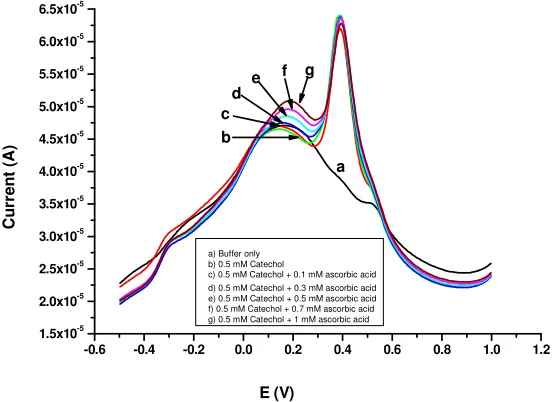
The effect of ascorbic acid, as a one of the most interfering substances in the electrochemical determination of some organic compounds was examined on the response of catechol. Figure (5a) showed the effect of different concentrations of ascorbic acid on the peak height of 0.5 mM
0.0 2.0x10⁻⁴
4.0x10⁻⁴ 6.0x10⁻⁴ 8.0x10⁻⁴ 1.0x10⁻³
0.0 1.0x10⁻⁵ 2.0x10⁻⁵ 3.0x10⁻⁵ 4.0x10⁻⁵ 5.0x10⁻⁵
6.0x10⁻⁵ Y = 9.31x10⁻⁶ + 0.054X R2= 0.999
C
u
rr
e
n
t
(A
)
[image:7.612.125.479.198.451.2][image:8.612.152.431.199.400.2]
catechol and Table 1. summarizes the collected data. From Table 1, the addition of ascorbic acid has a little effect on the peak height of catechol, but by increasing the ascorbic acid concentrations the percentage of error increased to 8%. Also the effect of different concentrations of catechol on the peak height of 1.0 mM ascorbic acid was also examined (Figure 5b). No marked effect was observed for the ascorbic acid response. So catechol can be detected in the presence of ascorbic acid and it is also possible to detect ascorbic acid under the same conditions for the determination of catechol without any interferences.
Figure 5. (a) Effect of ascorbic acid addition on the peak height of 5x10⁻⁴ M catechol.
Figure 5. (b) Effect of catechol acid addition on the peak height of 5x10⁻⁴ M ascorbic acid.
-1.0 -0.5 0.0 0.5 1.0 1.5
2.0x10⁻⁵ 3.0x10⁻⁵ 4.0x10⁻⁵ 5.0x10⁻⁵ 6.0x10⁻⁵ 7.0x10⁻⁵ 8.0x10⁻⁵ C u rr e n t (A ) E (V)
a) 0.0 mM ascorbic acid b) 0.5 mMascorbic acid
c) 0.5 mM ascorbic acid + 0.1 mM Catechol d) 0.5 mM ascorbic acid + 0.3 mM Catechol f) 0.5 mM ascorbic acid + 0.5 mM Catechol g) 0.5 mM ascorbic acid + 0.7 mM Catechol h) 0.5 mM ascorbic acid + 0.9 mM Catechol i) 0.5 mM ascorbic acid + 1.0 mM Catechol
a b c d e f gi
-0.6 -0.4 -0.2 0.0 0.2 0.4 0.6 0.8 1.0 1.2
1.5x10⁻⁵ 2.0x10⁻⁵ 2.5x10⁻⁵ 3.0x10⁻⁵ 3.5x10⁻⁵ 4.0x10⁻⁵ 4.5x10⁻⁵ 5.0x10⁻⁵ 5.5x10⁻⁵ 6.0x10⁻⁵ 6.5x10⁻⁵ C u rr e n t (A ) E (V)
a) Buffer only b) 0.5 mM Catechol
c) 0.5 mM Catechol + 0.1 mM ascorbic acid d) 0.5 mM Catechol + 0.3 mM ascorbic acid e) 0.5 mM Catechol + 0.5 mM ascorbic acid f) 0.5 mM Catechol + 0.7 mM ascorbic acid g) 0.5 mM Catechol + 1 mM ascorbic acid
Table 1. The percentage of errors obtained by the addition of different ascorbic acid concentrations on
1mM catechol using square wave voltammetry. Other parameters as mentioned in the text.
3.8- Analytical Applications:
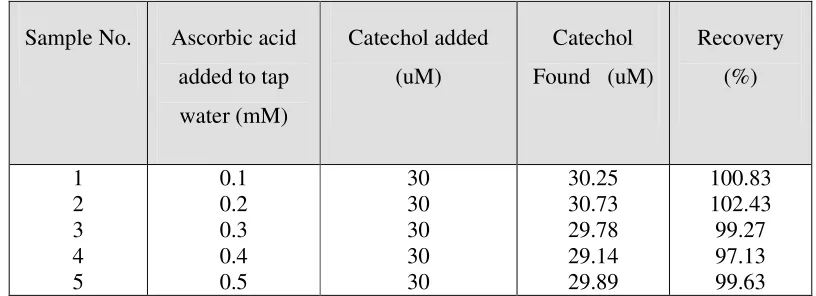
This method was applied for the determination of catechol in synthetic samples containing catechol in tap water in the absence and presence of ascorbic acid. The obtained results are listed in Table 2. In the absence of ascorbic acid a known amount of catechol was added to the water sample, the quantitative recoveries of 98.6% - 100.3% were obtained (Table 2), while in the presence of different ascorbic acid concentrations, quantitative recoveries of 97.13% – 102.43% were obtained (Table 3). So the determination of catechol using screen printed electrodes is reliable and effective method for the determination catechol.
Table 2. Determination of catechol in tap water in the absence of ascorbic acid
[image:9.612.101.509.559.707.2]Sample No. Catechol added (uM) Catechol Found (uM) Recovery (%) 1 2 3 4 5 10 20 30 40 50 9.86 19.78 29.77 40.12 49.88 98.6 98.9 99.23 100.3 99.76
Table 3. Simultaneous determination of catechol in tap water in the presence of ascorbic acid
Sample No. Ascorbic acid added to tap water (mM)
Catechol added (uM)
Catechol Found (uM)
Recovery (%) 1 2 3 4 5 0.1 0.2 0.3 0.4 0.5 30 30 30 30 30 30.25 30.73 29.78 29.14 29.89 100.83 102.43 99.27 97.13 99.63 Ascorbic acid concentration
(mM)
Percentage of error (%)
0.1 1.88
0.3 1.42
0.5 0.94
0.7 2.82
4. CONCLUSIONS
The electrochemical behavior of catechol was examined at the screen printed graphite electrode. The result showed that catechol gave one anodic oxidation peak in the forward scan and another cathodic reduction peak in the reverse scan at the surface of screen printed graphite electrode. The main task for this work was to find a rapid and more sensitive method for the direct electrochemical determination of catechol by the oxidation at the surface of screen printed graphite electrode. The respective electrode showed a good sensitivity and selectivity for the electrochemical determination of catechol in the presence of ascorbic acid
ACKNOWLEDGEMENTS
I would like to thank Prof. U. Bilitewski for supporting the screen printed graphite electrode used in this work.
References
1. D. Renedo, M.A. Alonso-Lomillo, M.J. Arcos Martinez, Talanta 73 (2007) 202. 2. M. Alvarez-Icaza, U. Bilitewski, Anal. Chem. 65 (1993) 525A
3. J.P Hart, S.A. Wring, Electroanalysis 6 (1994) 617
4. C.A. Galan-Vidal, J.Munoz, C. Dominguez, S. Alegret, Anal. Chem. 14 (1995) 225. 5. G.A.M. Mersal, M. Khodari , U. Bilitewski, Biosens. and Bioelectron. 20 (2004) 305. 6. Y.J. Teng, S.H. Zuo, M.B. Lan, Biosensors and Bioelectronics 24, (2009) 1353.
7. S. Carrara, V. Shumyantseva, A.I. Archakov, B. Samori, Biosens. and Bioelectron. 24 (2008) 148. 8. R. Güell, G. Aragay, C. Fontas, E. Antico, A. Merkoçi, Anal. Chim. Acta 627 (2008) 219.
9. O.D. Renedo, M.J.A. Martínez, Anal. Chim. Acta 589 (2007) 255. 10. J. Zen, C.C. Yang, A. S. Kumar, Anal. Chim. Acta 464 (2002) 229.
11. A. Avramescu, S. Andreescu, T. Noguer, C. Bala, D. Andreescu, J. Marty, Anal. and Bioanal. Chem. 374 (2002) 25.
12. M.D.P.T. Sotomayor, A.A. Tanaka, L.T. Kubota, Journal of Electroanal. Chem. 536 (2002) 71. 13. R. Solna, P. Skladal, Electroanalysis 17 (2005) 2137.
14. E.C. Figueiredo, C.R.T. Tarley, L.T. Kubota, S. Rath, M.A.Z. Arruda, Microchemical Journal 85 (2007) 290.
15. E.L.B. Lourenço, A.Ferreira, E.Pinto, M. Yonamine, S.H.P. Farsky, Chromatographia 63 (2006) 175.
16. B.L. Lee, H.Y. Ong, C.Y. Shi, C.N. Ong, Journal of Chromatography: Biomedical Applications 619 (1993) 259.
17. S. Tembe, S. Inamdar, S. Haram, M. Karve, S.F. D'Souza, Journal of Biotechnology 128 ( 2007) 80.
18. M.J. Schöning, M. Jacobs, A. Muck, D.-T. Knobbe, J. Wang, M. Chatrathi, S. Spillmann, Sensors and Actuators B: Chem. 108 (2005) 688.
19. M. Portaccio, S. Di Martino, P. Maiuri, D. Durante, P. De Luca, M. Lepore, U. Bencivenga, S. Rossi, A. De Maio, D.G. Mita, Journal of Molecular Catalysis B: Enzymatic 41 ( 2006) 97. 20. K.R. Rogers, J.Y. Becker, J. Cembrano, S.H. Chough, Talanta 54 (2001)1059.
21. Y. Tsai, C. Chiu, Sensors and Actuators B: Chem. 125 (2007) 10.
22. C. Capannesi, I. Palchetti, M. Mascini, A. Parenti, Food Chem. 71 (2000) 553.
24. R. Ricci, G. Palleschi, Biosens. Bioelectron. 21 (2005) 389. 25. M.A. Ghanem, Electrochem. Commun. 9 ( 2007) 2501. 26. S. Mu, Biosens. and Bioelectron. 21 (2006) 1237. 27. L. Su, L. Mao, Talanta 70 (2006) 68.
28. B, Nasar, G. Abdelltif, P. Canizares, C. Saez, M.A. Rodrigo, Environ. Sci. Technology 39 (2005) 723.
29. S.G. Wang, Y.Q. Li, X.J. Zhao, J.H. Wang, J.J. Han, T. Wang, Diamond and Related Materials 16 (2007) 248.
30. J. Yu, W. Du, F. Zhao, B. Zeng, Electrochim. Acta 54 (2009) 984. 31. H. Qi, C. Zhang, Electroanalysis 17 (2005) 832..
32. L. Wang, P. Huang, J. Bai, H. Wang, L. Zhang, Y. Zhoo, International Journal of Electrochemical Science 2 (2007) 123.