Dynamical masses of a nova-like variable on the edge of the period gap
P. Rodr´ıguez-Gil,
1,2,3‹T. Shahbaz,
1,2T. R. Marsh,
4B. T. G¨ansicke,
4D. Steeghs,
4K. S. Long,
5I. G. Mart´ınez-Pais,
1,2M. Armas Padilla,
1,2†
R. Schwarz,
6M. R. Schreiber,
7M. A. P. Torres,
8D. Koester,
9V. S. Dhillon,
10J. Castellano
11and D. Rodr´ıguez
121Instituto de Astrof´ısica de Canarias, V´ıa L´actea s/n, La Laguna, E-38205 Tenerife, Spain 2Departamento de Astrof´ısica, Universidad de La Laguna, La Laguna, E-38206 Tenerife, Spain 3Harvard–Smithsonian Center for Astrophysics, 60 Garden St, Cambridge, MA 02138, USA 4Department of Physics, University of Warwick, Coventry CV4 7AL, UK
5Space Telescope Science Institute, 3700 San Martin Drive, Baltimore, MD 21218, USA
6Leibniz-Institut f¨ur Astrophysik Potsdam (AIP), An der Sternwarte 16, D-14482 Potsdam, Germany
7Departamento de F´ısica y Astronom´ıa, Universidad de Valpara´ıso, Avenida Gran Breta˜na 1111, 2360102 Valpara´ıso, Chile 8SRON, Netherlands Institute for Space Research, Sorbonnelaan 2, NL-3584 CA Utrecht, the Netherlands
9Institut f¨ur Theoretische Physik und Astrophysik, University of Kiel, D-24098 Kiel, Germany 10Department of Physics and Astronomy, University of Sheffield, Sheffield S3 7RH, UK 11Observatorio Rodeno (MPC 939), Segorbe, E-12400 Castell´on, Spain
12Observatorio Guadarrama (MPC 458), E-28430 Madrid, Spain
Accepted 2015 June 1. Received 2015 May 27; in original form 2015 April 13
A B S T R A C T
We present the first dynamical determination of the binary parameters of an eclipsing SW Sextantis star in the 3–4 h orbital period range during a low state. We obtained time-resolved optical spectroscopy and photometry of HS 0220+0603 during its 2004–2005 low-brightness state, as revealed in the combined Small & Moderate Aperture Research Telescope System, IAC80 and M1 Group long-term optical light curve. The optical spectra taken during primary eclipse reveal a secondary star spectral type of M5.5±0.5 as derived from molecular band-head indices. The spectra also provide the first detection of a DAB white dwarf in a cataclysmic variable. By modelling its optical spectrum we estimate a white dwarf temperature of 30 000± 5000 K. By combining the results of modelling the white dwarf eclipse from ULTRACAM light curves with those obtained by simultaneously fitting the emission- and absorption-line radial velocity curves andI-band ellipsoidal light curves, we measure the stellar masses to be M1 =0.87±0.09 MandM2 =0.47±0.05 M for the white dwarf and the M dwarf, respectively, and an inclination of the orbital plane ofi≈79◦. A radius of 0.0103±0.0007 R is obtained for the white dwarf. The secondary star in HS 0220+0603 is likely too cool and undersized for its mass.
Key words: binaries: close – stars: fundamental parameters – stars: individual: HS 0220+0603 – novae, cataclysmic variables.
1 I N T R O D U C T I O N
Cataclysmic variables (CVs) are binary systems that contain late-type (K–M) companion stars that fill their Roche lobes and therefore transfer mass to their white dwarf (WD) primary stars. Nova-like (NL) variables are CVs for which a nova or dwarf nova outburst has never been observed. The orbital period distribution of CVs shows a significant paucity of systems in the∼2–3 h range, the so-called period gap (see e.g. G¨ansicke et al.2009, and references therein).
E-mail:[email protected],[email protected]
†CEI Canarias: Campus Atl´antico tricontinental.
and its companion most of the time, making direct observations and accurate binary parameter measurements impossible (Ciardi et al.1998). However, these CVs are occasionally caught fading towards states of greatly diminished brightness, or ‘low states’. During the low states, these CVs are 3–5 mag fainter than their normal high state. They can stay at this level for days, months or even years before returning to the high state. Low states appear to be a feature of several types of CV and, in addition, they seem to occur independently of the magnetic field of the WD: they are observed in practically all known strongly magnetic systems without discs (polars), some intermediate polars and many weakly-magnetic CVs, including a large fraction of NLs and a number of dwarf novae (e.g. Schreiber, G¨ansicke & Mattei2002; Manser & G¨ansicke2014).
Although there is broad agreement that low states are the con-sequence of a reduction in the mass transfer rate from the donor star, the exact mechanism is unclear. Livio & Pringle (1994) and King & Cannizzo (1998) proposed an accumulation of large star-spots close to the inner Lagrangian point (L1) as a way of inhibiting Roche lobe overflow, but Howell et al. (2000) put the case of the polar ST LMi forward to challenge this scenario and proposed that it is changes in the level of magnetic activity of the secondary star that may be behind the observed high-/low-state transitions. This idea had been already explored by Bianchini (1992), who invoked solar-like magnetic cycles with time-scales of about a decade.
In the low state, only gas provided by the magnetic activity or stellar wind of the donor star would then be available for accretion (e.g. Hessman, G¨ansicke & Mattei2000). In this respect, entan-glement of the magnetic fields of both stars has been proposed to explain the line emission patterns observed in polars during low states (e.g. Kafka et al.2008; Mason et al.2008).
The study of the CV population with orbital periods between 3 and 4 h is of essential interest to the development of the theory of CV evolution. Particularly, those NL systems closer to the upper boundary of the period gap at an orbital period of about 3.18 h (a limit set observationally by Knigge2006). According to the stan-dard stellar structure codes (e.g. Chabrier & Baraffe1997), the M-dwarf secondary stars in these CVs are expected to undergo a major change in their internal structure, developing into a totally convective configuration at a mass of∼0.35 M. The exact value of this boundary depends on the choice of several parameters, such as the metallicity, opacities and mixing length (e.g. Chabrier & Baraffe1997). We can find in the literature values ranging from 0.27 (Gabriel1969) to 0.4 M(Cox & Giuli1969). For low-mass stars, Reiners & Mohanty (2012) place 0.3 Mas the fully con-vective limit. In the case of detached white dwarf/main-sequence binaries a drop in the fraction of post-common envelope binaries relative to wide binaries is observed at a mass of0.25 M, which is an independent observation in support of the disrupted mag-netic braking mechanism invoked to reproduce the observed or-bital period gap in CVs (Schreiber et al.2010). On the other hand, in the population synthesis study of CVs by Howell, Nelson & Rappaport (2001) their zero-age main-sequence models have a fully convective configuration at a mass of∼0.34 M, while the semi-empirical donor star sequence for CVs of Knigge (2006) suggests a (fully convective) donor mass of 0.2 Mat the upper edge of the period gap. These authors warn against the lack of fundamental input in the form of accurate masses, especially in the 3–4 h orbital period range. In fact, the donor masses used in this period interval come fromindirectmethods such as the mass ratio (q)–superhump period excess (ε) relation refined by Patterson et al. (2005), and the a priori assumption of a constant WD mass of 0.75 M. Moreover, the system used to refine the fit to theq–εdata, thought to have the
largest value of the superhump excess (ε=0.094), is BB Doradus, (Rodr´ıguez-Gil et al.2012; Schmidtobreick et al.2012) for which an accurate determination of its stellar masses is unavailable.
Another essential observational input to the theory is the time-averaged mass transfer rate, that has to be compared with the pre-dicted secular mass transfer rates (see Knigge, Baraffe & Patter-son2011). A medium-term (103–105yr) mass transfer rate may
be derived from measurements of the effective temperature and mass of the accreting WD (Townsley & Bildsten2003; Townsley & G¨ansicke2009), which again emphasizes the need for accurate bi-nary parameters.
In brief, no direct measurement of the stellar masses in any SW Sex star in the 3–4 h orbital period range exists thus far. However, the CV evolution theory demands appropriate input in the form of dynamical mass solutions and other binary parameters. This is especially true for these CVs close to the upper boundary of the period gap, in which the donor stars may be about to experience the predicted major structural change in their stellar interiors.
In this paper, we present the first attempt to measure the funda-mental parameters of an SW Sex star in the 3–4 h period range, the eclipsing system HS 0220+0603 (Rodr´ıguez-Gil et al.2007), with no initial assumptions about the binary system.
2 L O N G - T E R M L I G H T C U RV E
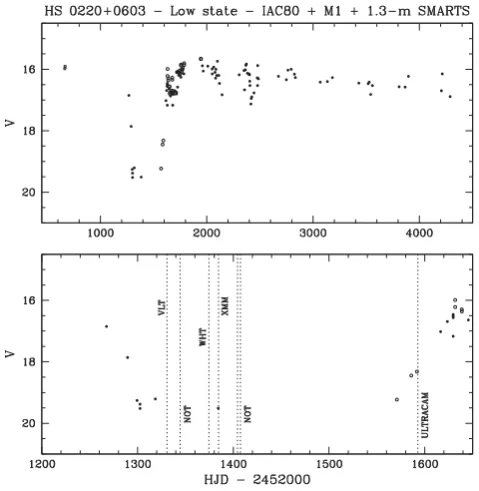
[image:2.595.308.548.381.627.2]The long-termV-band light curve of HS 0220+0603 is presented in Fig. 1. The photometry spans 9.92 years and comprises data provided by Spanish amateur astronomers of the M1 Group, the
1.3-m SMARTS telescope on Cerro Tololo, Chile (operated by the SMARTS Consortium) and the 0.82-m IAC80 telescope at the Observatorio del Teide on Tenerife, Spain. The apparentV-band magnitudes were computed relative to the comparison star USNO– A2.0 0900–00554112. Conversion of itsBA2.0andRA2.0magnitudes
into the Landolt standard system1resulted in aV-band magnitude
of 12.3. The nearby star USNO–A2.0 0900–00553941 (V=16.5) was used as the check star.
The M1 Group reported HS 0220+0603 entering a low state on 2004 September 19. The system was atV=16.8, nearly a magnitude fainter than the previous IAC80 telescope measurements. Almost a month later, on 2004 October 24, the system settled in the low state at V= 19.5 after fading at a rate of∼0.08 mag d−1. The
egress from the low state occurred shortly before 2005 July 19, when the system was observed atV=19.2. It then brightened at a relatively slow rate of∼−0.05 mag d−1and reached its high state
brightness level atV≈16 around 2005 September 18. This places a lower limit to the low state length of about 1 year. However, just after 2005 September 18 it started to fade again at a rate of ∼0.03 mag d−1. HS 0220+0603 remained atV≈16.7 for about
64 d before starting its final rise to the high state at the same rate of∼−0.03 mag d−1. All the ingress and egress slopes reported
here have to be taken with caution due to the scarce sampling of the long-term light curve, but the occurrence of the second fading looks convincing. Further, during this secondary plateau the system showed occasional brightenings with an amplitude of∼0.5 mag, similar to those seen in BB Dor in the low state (Rodr´ıguez-Gil et al.2012). Finally, the post-low-state monitoring reveals a steady brightness decline at a rate of∼3×10⁻⁴mag d−1.
3 DATA AC Q U I S I T I O N A N D R E D U C T I O N
3.1 Optical spectroscopy
3.1.1 Very Large Telescope
We obtained four 600-s spectra with the ESO 8.2-m Very Large Telescope (VLT) at Cerro Paranal on 2004 November 20, shortly after the onset of minimum light with the FOcal Reducer and low dispersion Spectrograph on the Antu (UT1) telescope. For the ob-servations the spectrograph was equipped with the 600RI grism, the GG435 order sorter filter and the MIT/LL 2048×4096 pixel CCD detector. With a 0.7-arcsec slit, this delivered a spectral resolution of 3.5 Å (full width at half-maximum, FWHM) over the 5015–8325 Å wavelength range. For flux calibration we used spectra of the flux standard LTT 377.
3.1.2 William Herschel Telescope
We carried out time-resolved spectroscopy of HS 0220+0603 on 2005 January 3 with the 4.2-m William Herschel Telescope (WHT) at the Roque de los Muchachos Observatory on La Palma. The double-armed Intermediate dispersion Spectrograph and Imaging System (ISIS) was fitted with the R600B and the R316R gratings, and the 2048×4200 pixel EEV12 and the 2148 ×4700 pixel Marconi CCDs in the blue and the red arm, respectively. This setup and a 1.2-arcsec slit width (1.5-arcsec seeing conditions) granted access to the wavelength intervals 3700–5010 and 6110–8930 Å at 1.8 and 3.3 Å resolution (FWHM) in the blue and red, respectively.
[image:3.595.309.543.72.230.2]1Seehttp://www.pas.rochester.edu/∼emamajek/memo_USNO-A2.0.html.
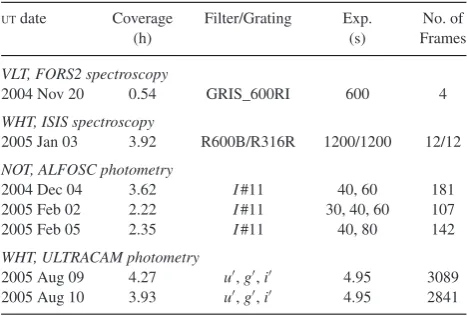
Table 1. Log of optical observations.
UTdate Coverage Filter/Grating Exp. No. of
(h) (s) Frames
VLT, FORS2 spectroscopy
2004 Nov 20 0.54 GRIS_600RI 600 4
WHT, ISIS spectroscopy
2005 Jan 03 3.92 R600B/R316R 1200/1200 12/12
NOT, ALFOSC photometry
2004 Dec 04 3.62 I#11 40, 60 181
2005 Feb 02 2.22 I#11 30, 40, 60 107
2005 Feb 05 2.35 I#11 40, 80 142
WHT, ULTRACAM photometry
2005 Aug 09 4.27 u,g,i 4.95 3089
2005 Aug 10 3.93 u,g,i 4.95 2841
The exposure time was 1200 s and we regularly took spectra of arc lamps in order to account for instrument flexure. A flat-field image was obtained after every two science exposures of the target in order to correct for fringing in the red-arm CCD. Flux calibration was performed using spectra of the flux standard Feige 34 taken with the same setup. We used the same spectrophotometric standard star to remove the telluric features. See Table1for details of the observations.
We reduced both the VLT and WHT spectroscopic data using standard procedures inIRAF.2After subtracting the bias level, the
images were divided by an average flat-field that was normalized by fitting Chebyshev functions of high order to remove the de-tector specific spectral response. We then subtracted the sky con-tribution and optimally extracted the final spectra following the method described by Horne (1986). For wavelength calibration, we fitted a low-order polynomial to the pixel-wavelength arc data. In calibrating the WHT data, we obtained the wavelength solution for each target spectrum by interpolating between the two near-est arc spectra. All subsequent analysis was performed with the
MOLLY3package. All the spectra were corrected for interstellar
red-dening using a colour excess ofE(B−V)=0.047, corresponding to
AV=0.145 mag (from the extinction map of Schlafly & Finkbeiner 2011).
3.2 Optical photometry
3.2.1 NOT I-band light curves
We used the Andaluc´ıa Faint Object Spectrograph and Camera (ALFOSC) equipped with the 2048×2048 pixel EEV chip (CCD #8) on the 2.56-m Nordic Optical Telescope (NOT) on La Palma to obtain time-resolved,I-band photometry of HS 0220+0603 on 2004 December 4 and 2005 February 2 and 5. The exposure time ranged between 30 and 80 s due to changing sky transparency conditions during the nights. We usedIRAFto reduce the individual
images in a standard way, and to perform aperture photometry on the target and two comparison stars. Differential light curves of the target relative to the main comparison star (C1, USNO–A2.0 0900–
00554015) were then computed. We confirmed the stability of C1
by differential photometry relative to the second comparison star. In converting the differentialI-band magnitudes of HS 0220+0603
2
IRAFis distributed by the National Optical Astronomy Observatories. 3http://deneb.astro.warwick.ac.uk/phsaap/software/molly/html/
to the standard system, we calculated theI-band magnitude of C1
from its Sloan Digital Sky Survey (SDSS)r, iand zmagnitude measurements (Data Release 7). We then transformed the SDSS magnitudes intoI-band magnitudes by using the two formulae given by R. Lupton in 2005.4The average value for C
1isI=15.565±
0.007.
3.2.2 WHT/ULTRACAM fast photometry
We also observed HS 0220+0603 with ULTRACAM on the WHT on La Palma on 2005 August 9 and 10. ULTRACAM is a high-speed, triple-beam CCD camera (Dhillon et al.2007) capable of acquir-ing simultaneous images in three different photometric bands. For HS 0220+0603, we used the SDSSu,gandifilters (see Table1). The exposure time was fixed to 4.95 s and the dead time between consecutive exposures was∼24 ms. We reduced the data with the ULTRACAM pipeline software. Debiasing, flat-fielding and sky subtraction were performed in the standard way. We determined the flux of the source and two close comparison stars with aperture pho-tometry using a variable aperture scaled according to the FWHM of the stellar profile. Note that the ULTRACAM observations took place when the system’s brightness was starting to increase (see Fig.1), and it was about one magnitude brighter than the low state level.
3.2.3 Updated eclipse ephemeris
We combined the times of mid-eclipse of the WD in HS 0220+0603 in the high state reported by Rodr´ıguez-Gil et al. (2007) with new WD mid-eclipse times measured from the light curves in the low state presented in this work to update the eclipse ephemeris. The resulting linear ephemeris is
T0(HJD)=2452563.57399(12)+0.149207749(75)×E .
We used this ephemeris to calculate the orbital phase for all the data presented in this work.
4 XMM–NEWTONX - R AY A N D U V O B S E RVAT I O N S
The XMM–Newton satellite (Jansen et al. 2001) pointed to HS 0220+0603 for 30.7 ks on 2015 January 13 (observation ID 0212480101). The European Photon Imaging Camera consists of two MOS cameras (Turner et al.2001) and one PN camera (Str¨uder et al.2001), which were operated in full-frame window imaging mode with the thin optical blocking filter applied. We used the Sci-ence Analysis Software (SAS, v.14.0) to carry out the data reduction
and obtain the scientific products. The observation was affected by episodes of background flaring, therefore a total of 14.2 ks had to be neglected in our analysis. We extracted events using a circular region with a radius of 15 arcsec centred on the source position (RA=02:23:01.6, Dec.= +06:16:49.6, J2000), and a circular re-gion with a radius of 30 arcsec covering a source-free part of the CCDs to extract background events. The average 0.2–12 keV source net count rate was (8.2±1.0)×10−3count s−1for the PN camera.
A very limited number of photons were recorded with the MOS cameras, which did not allow us to perform a spectral analysis.
We generated the spectrum and the light curve of the PN data, as well as the response files, following the standard analysis threads.5
[image:4.595.311.549.58.223.2]4http://www.sdss3.org/dr8/algorithms/sdssUBVRITransform.php 5http://www.pas.rochester.edu/∼emamajek/memo_USNO-A2.0.html
Figure 2. The 0.3–10 keV PN X-ray spectrum (top) and residuals (bottom). The solid line represents the best fit with a one-temperature thermal plasma model (PHABS*APEC).
Table 2. Best fit to the 0.3–10 keV PN spectrum using
PHABS*APEC.
Model parameters
NH 3.2×1020cm−2
kT 2.9 keV
EMa,b 8.98×1052cm−3
χ2(dof) 0.7 (18)
Energy band FX,abs FX,unabs LXb
(10−14erg cm−2s−1) (1029erg s−1)
0.5–10 keV 2.0 2.1 14
0.1–7 keV 2.03 2.4 16
0.5–10 keV 1.25 1.62 10
aEmission measure EM=
nenHdV=4πD2NormAPEC.
bTo calculate the EM and the luminositiesD=740 pc was
as-sumed for the distance.
The spectral data were grouped to contain a minimum of 10 photons per bin and fit in the 0.3–10 keV energy range usingXSPEC(v.12.8;
Arnaud1996). We assumed a total Galactic HIcolumn density (NH)
ofNH=(3.2±0.1)×1020cm−2calculated with theNH–AVrelation
(G¨uver & ¨Ozel2009) using theAVobtained in Section 3.1. This
is consistent with theNH=4.8×1020cm−2in the direction to the
source found by Kalberla et al. (2005).
Since HS 0220+0603 is in a low state, we assume that the bulk of the X-ray emission comes from the M-dwarf companion star. There-fore, we modelled the spectrum with an absorbed one-temperature thermal plasma model, which is typically used for stellar emis-sion. To this end, the plasma thermal emissionAPECcode (Smith et al.2001) was applied. A good fit withχ2
ν=0.7 for 18 degrees of freedom (dof) andp-value >0.8 (see Fig.2) was achieved. The value of the obtained temperature is kT = 2.9 keV (∼34 MK) and the emission measure (EM) is 8.98×1052 cm−3. The 0.5–
10 keV absorbed (unabsorbed) flux is 2.0 × 10⁻¹⁴erg cm−2s−1
(2.1×10⁻¹⁴erg cm−2s−1). Assuming a distance of 740 pc (see
Sec-tion 6.2), the corresponding X-ray luminosity is 14×1029erg s−1
(see Table2for spectral results and X-ray luminosities for different energy ranges in order to compare with the literature).
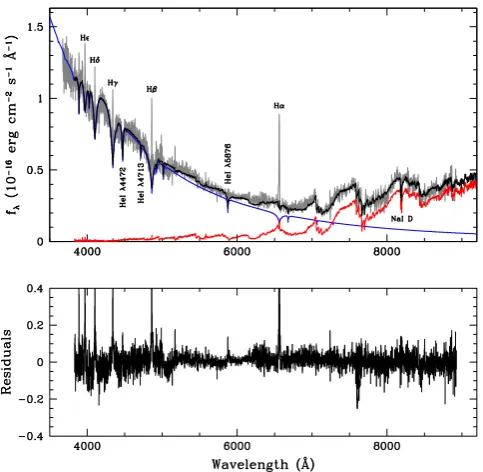
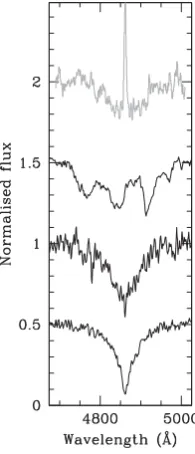
[image:4.595.326.532.303.416.2]Figure 3. Average VLT/FORS and WHT/ISIS spectrum of HS 0220+0603. Only spectra taken shortly before or after primary eclipse were used in order to include the WD spectrum while at the same time minimizing the effect of irradiation from the WD on the M-dwarf companion. The data (grey) are fitted with WD (blue)+M-dwarf (red) templates. The solid black line is the best composite fit (see text for details).
temperatures ofkT= 1.22 keV andkT= 1.7 keV, and X-ray lu-minosities of 1.7×1029erg s−1(0.1–7 keV) and 5×1027erg s−1
(0.2–2 keV), respectively (Gupta, Galeazzi & Williams2011; Tsang et al.2012). When placing HS 0220+0603 in theLXversus
rota-tion period plot (Pizzolato et al.2003, see also Cook, Williams & Berger2014), we see that the luminosity is also higher than rapidly rotating active stars. We therefore cannot discard the presence of X-ray emission due to very low-level accretion.
Simultaneous to the X-ray measurements, observations with the optical/UV monitor telescope (Mason et al.2001) were car-ried out in the imaging mode. The near-ultraviolet uvw1 (245– 320 nm) and uvm2 (205–245 nm) filters were used during ∼4.4 ks each. The data were reduced using the omichain task. The resulting unreddened fluxes for the uvw1 anduvm2 bands were (0.24 ± 0.01) × 10−15erg cm−2s−1Å−1 and (0.48 ± 0.02) ×
10−15erg cm−2s−1Å−1, respectively (see the bottom panel of
Fig.4).
5 S P E C T R A L C L A S S I F I C AT I O N
5.1 Spectral energy distribution
The optical spectrum of HS 0220+0603 in the low state is dom-inated by the two stellar components. In Fig.3, the contributions of a WD and a mid-M dwarf are apparent in the blue and the red, respectively. The spectral modelling presented below does not re-quire the presence of an accretion disc. In addition, the U-shaped WD eclipse seen in the light curves (see Figs5and10) points to a bare WD or, at most, a WD surrounded by a cold, remnant disc. The emission lines do not reveal a disc either, unlike DW UMa in the low state (Dhillon, Jones & Marsh1994).
Narrow emission lines of hydrogen are superimposed on the WD absorption troughs. For comparison, the intrinsic FWHM of Hαin
the low state is 340 km s−1at orbital phase 0 (defined as inferior
conjunction of the secondary star), whilst the Hαemission line has an FWHM of 1390 km s−1in the high state (Rodr´ıguez-Gil et al. 2007). The CaIItriplet (λ8498,λ8542 andλ8662) in emission is apparent around orbital phase 0.5. Some HeIλ5876 emission is
also present. We will later show that these narrow emission lines originate on the donor side of the binary system, and are due to irradiation from a hot WD and/or chromospheric emission. The HeIIλ4686 and Bowen blend emissions observed in the high state
are absent.
In determining the spectral type of the two stars, we used an average spectrum of HS 0220+0603 computed from spectra cor-responding to a limited range of orbital phases around the primary eclipse. This minimizes the contribution from the side of the sec-ondary star that faces the WD and yet includes the spectrum of the WD. In particular, we only used VLT/FORS2 spectra obtained at orbital phases 0.15 and 0.20, WHT/ISIS red spectra at 0.92, 0.93 and 0.11, and at 0.82, 0.92, 0.93, 0.11 and 0.21 for the WHT/ISIS blue spectra. Note that we use this average spectrum in the subse-quent analyses unless otherwise stated. Also note that this approach will eliminate any information on the spectral type variation with orbital phase, but it is necessary as the signal-to-noise ratio of the individual spectra is far from being optimal for this purpose.
The spectral contribution of the WD is very blue in colour, and contains both Balmer and HeIlines, making this the first definite
detection of a DAB WD in a CV. The composite spectrum super-imposed on the average spectrum of HS 0220+0603 presented in Fig.3contains our DAB WD model with temperature and surface gravity of 30 000 K and logg= 8.35, respectively, and a dwarf M5.5 secondary star (see Section 5.2).
The de-reddened UV fluxes (see Section 4) are plotted together with our WD model and the average WHT/ISIS blue spectrum in the bottom panel of Fig.4. The UV observations fit well into the WD model withTeff =30 000 K. For comparison, we show
in Fig.4the SDSS spectrum of a (single) DAB WD with simi-lar atmospheric parameters (SDSS J084742.22+000647.6,Teff=
30545±241 K, logg=8.49±0.05; Kleinman et al.2004) along with the average spectrum of the WD in HS 0220+0603 and the DAB model. The SDSS WD and the HS 0220+0603 spectra show a good match. Given the uncertainties in the flux calibration of the average WD spectrum and the UV fluxes, and considering that the UV and the optical observations were not simultaneous, it is dif-ficult to establish a formal error on the WD temperature, but we conservatively estimate that the quoted value is accurate to within 5000 K.
5.2 Secondary star molecular-band indices
In this section, we present the determination of the spectral type of the secondary star. Boeshaar (1976) introduced a spectral clas-sification scheme for M dwarfs based on molecular-band ratios, which has also been used for CVs (Wade & Horne1988). The work of Reid, Hawley & Gizis (1995) used a similar set of spectral in-dices to measure the depth of selected molecular band heads. These authors improved on the M-dwarf spectral sequence presented by Kirkpatrick, Henry & McCarthy (1991) for classification in the red (6300–9000 Å). These indices have been extensively calibrated against spectral type by many authors (see L´epine, Rich & Shara
2003, and references therein).
Figure 4. Top panel: average WD spectrum around eclipse (grey) with our DAB WD model (red;Teff=30 000 K, logg=8.35) and spectrum of the
field DAB WD SDSS J084742.22+000647.6 (blue;Teff=30545 K, logg=
8.49) superimposed. Note that the contribution of the secondary star has not been subtracted, so there is a flux excess increasing with wavelength. Bottom panel: average WD spectrum around eclipse (grey) with our DAB WD model (blue) and theXMMUV flux measurements after correcting for interstellar reddening (circles).
spectral indices from the average WHT/ISIS red spectrum and com-paring them with the indices observed for calibrated M dwarfs. We followed the strategy described by L´epine et al. (2003) for mid to late M-dwarfs, focusing on the VO1, VO2 and TiO7 indices (see their table 2 for details). We did not use the TiO6 index as the con-tinuum is defined very close to the O2telluric absorption complex
[image:6.595.48.282.58.287.2]at∼7650 Å, and residuals from the telluric correction remain in that region. Prior to this analysis, we first removed the contribution of the WD. We present the flux ratios for HS 0220+0603 and SDSS M-dwarfs ranging from M2 to M8 in Table3. L´epine et al. (2003) present linear functions to obtain the spectral type of M dwarfs from the molecular-band indices. Using their equations (4), (6) and (7), we obtain a spectral type for the secondary star in HS 0220+0603 of M5.5, M5.6 and M5.4 for the VO1, VO2 and TiO7 indices, re-spectively. The indices obtained for the SDSS M-dwarf templates (Table3) also point to an M5–6 spectral type. The linear calibra-tions of L´epine et al. (2003) can provide spectral types accurate to half a spectral type. We can therefore conclude that the M-dwarf
Table 3. Molecular band-head indices.
Star VO1 VO2 TiO7
HS 0220+0603 0.875 0.649 0.756
M2V 0.947 0.899 0.956
M3V 0.920 0.821 0.914
M4V 0.904 0.758 0.876
M5V 0.874 0.654 0.791
M6V 0.851 0.601 0.762
M7V 0.829 0.537 0.703
[image:6.595.96.237.627.731.2]M8V 0.799 0.443 0.626
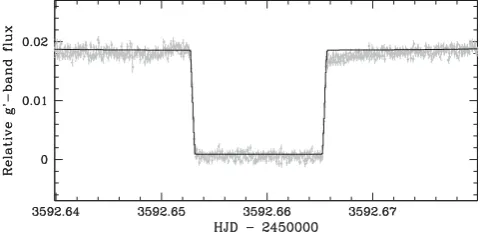
Figure 5. Modelling of the WHT/ULTRACAM WD eclipse in thegband. The data were fitted with theLCURVEcode. The solid line represents the
best fit.
secondary star in HS 0220+0603 shows a low-state spectral type of M5.5±0.5 when observed close to its inferior conjunction.
6 B I N A RY PA R A M E T E R S
6.1 WD eclipse modelling
In order to obtain constraints on the binary parameters, we fitted light curve models to the ULTRACAMg-band eclipse data. The
g-band light curve has the best quality and the deepest eclipse of the three recorded by ULTRACAM (see Fig.5). Of special interest is the mass ratioq=M2/M1(whereM1andM2are the masses of
the WD and secondary star, respectively) as a function of the orbital inclination (i), that can be tested against an analogous function de-rived from the joint modelling of the emission- and absorption-line radial velocity curves and the ellipsoidal modulation plus eclipse curves (see Section 6.2).
For the modelling of the ULTRACAM light curve, we made use of theLCURVEcode developed by one of us (TRM; see Copperwheat
et al. 2010for a description, and e.g. Pyrzas et al. 2009for its application to light curves of WD/M-dwarf binaries). TheLCURVE
code computes a model from input parameters provided by the user. Model light curves are then fitted to the data using Levenberg– Marquardt minimization. Both fixed and free parameters can be set by the user, which gives full flexibility to the code operation.
The results of the spectral modelling presented in Section 5.1 allowed us to fix the temperature of the WD toT1=30 000 K. We
also fixed the limb darkening coefficients to four-parameter values as listed in Gianninas et al. (2013) forT1=30 000 K and logg=8.5.
The mass ratioq, the scaled WD radiusr1=R1/a(withathe binary
separation) and the effective temperature of the secondary starT2
were left as free parameters. For the scaled secondary star radius
r2=R2/a, the code calculates the proper non-spherical shape of
the secondary star’s Roche lobe for each value ofq. We performed a grid search inq, withqranging from 0.25 to 0.60 in steps of 0.05. The results are presented in Table4.
6.2 Simultaneous radial velocity and ellipsoidal modulation modelling
The NOTI-band light curves were phase folded according to the eclipse ephemeris given in Section 3.2.3 and averaged into 43 orbital phase bins. To interpret theI-band light curve and the absorption-and emission-line radial velocity curves we used the XRBCURVE
Table 4. ULTRACAM WD eclipse modelling parameters. Mass ratio Inclination Scaled WD radius q(=M2/M1) i(deg) r1(=R1/a)
0.260 88.71(15) 0.0101(5)
0.300 85.48(04) 0.0095(5)
0.350 83.51(03) 0.0091(4)
0.400 82.11(03) 0.0087(5)
0.450 80.99(02) 0.0083(4)
0.500 80.05(02) 0.0080(4)
0.550 79.24(02) 0.0078(4)
0.600 78.52(02) 0.0075(4)
Briefly, the model includes a Roche lobe filling secondary star, the effects of UV/X-ray heating of the secondary star by a source of high-energy photons from a compact object, an accretion disc and mutual eclipses of the disc and star. In the case of HS 0220+0603 in the low state, where the eclipse of the WD by the secondary star is clearly seen, we simulate the presence of a bare WD by assuming that it can be described by a blackbody cylindrical accretion disc (with equal radius and height).
The geometry of the binary system is given by the orbital incli-nationi, the binary mass ratioq, and the Roche lobe filling factor
fR2of the secondary star. The light arising from the secondary star
depends on its mean effective temperature (T2), the gravity
darken-ing exponentβand the X-ray/UV albedoW. The additional light due to UV/X-ray heating is given by the unabsorbed UV/X-ray flux (FX, 0). The light from the WD is given by its scaled radius and
ef-fective temperature. The distance to the source in parsecs (dpc), the
orbital periodPand the radial velocity amplitude of the secondary star (K2) set the scale of the system.
We usePHOENIXmodel-atmosphere fluxes (Hauschildt, Allard &
Baron1999) to determine the intensity distribution on the secondary star and blackbody fluxes for the light arising from the WD. For both cases we use a quadratic limb-darkening law with coefficients taken from Claret (1998), to correct the intensity. We assume that the secondary star is in synchronous rotation and completely fills its Roche lobe. Since the late-type secondary star should have a convective envelope, we fix the gravity darkening exponent to 0.08 (Lucy1967). Its albedo (W) is fixed at 0.40 (de Jong, van Paradijs & Augusteijn1996).
The irradiating flux can strongly alter the distribution of temper-ature across the face of the secondary star and thus the observed optical light curves and radial velocities. For the light curves, the heating of the secondary star is computed in the same way as de-scribed in Shahbaz et al. (2003), who calculate the increase in unperturbed local effective temperature due to the irradiating exter-nal source. Substantial heating of the secondary star also shifts the effective centre of the secondary, weighted by the strength of the ab-sorption and emission lines, from the centre of mass of the star. This results in a significant distortion of the radial velocity curve leading to spuriously high or lowK-amplitudes using absorption or emis-sion lines, respectively, arising from the secondary star (Phillips, Shahbaz & Podsiadlowski1999; Shahbaz et al.2000). To model the radial velocity curves, we determine the fraction of the surface of the star that contributes to the absorption-line or emission-line radial velocity. These are described by factorsFAVandFEV,
respec-tively, and represent the fraction of the external radiation flux that exceeds the unperturbed flux, e.g.FAV=1.0 assumes all the area of
the star visible by the heating source is irradiated and does not con-tribute to the absorption-line radial velocity, whereas forFEV=1.10
only surface elements on the star where the external radiation flux
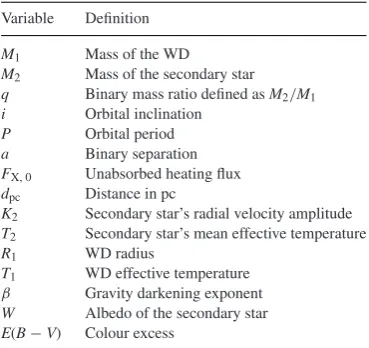
Table 5. List of the key model variables and what they represent.
Variable Definition
M1 Mass of the WD
M2 Mass of the secondary star
q Binary mass ratio defined asM2/M1
i Orbital inclination P Orbital period a Binary separation FX, 0 Unabsorbed heating flux
dpc Distance in pc
K2 Secondary star’s radial velocity amplitude
T2 Secondary star’s mean effective temperature
R1 WD radius
T1 WD effective temperature
β Gravity darkening exponent W Albedo of the secondary star E(B−V) Colour excess
is greater than 10 per cent of the unperturbed flux contribute to the emission-line radial velocity (Billington, Marsh & Dhillon1996; Phillips et al.1999). The line flux of each element on the star is calculated using the equivalent width and continuum flux value, and the equivalent width of elements that do not contribute are set to zero. For ease of reference, the key variables are listed in Table5. In determining the binary parameters we simultaneously fit the photometricI-band light curve (43 data points) and the absorption-line (NaIdoublet) and emission-line (CaIItriplet) radial velocity
curves (11 and 7 data points, respectively) with our model to rep-resent the photometric and radial velocity variations. We used the differential evolution algorithm described in Shahbaz et al. (2003) to fit the data, which is robust and simple.
The model parameters that determine the shape and amplitude of the optical light curves, absorption-line and emission-line radial velocity curves arei,q,T2,FX, 0,dpc,W,R1,T1,K2,FAVandFEV.
For the fitting procedure, there are three extra parameters: the phase shift for the optical light curve δφLC, and the phase and
radial-velocity shift for the absorption-line radial radial-velocity curveδφRVand γRV, respectively (the absorption-line radial velocity curve allows
us to define the phase 0.0, i.e. inferior conjunction of the secondary star, and the systemic velocity, hence we use the same values for the fit to the emission-line radial velocity curve).
We fixedT2=3000 K for a mid-M dwarf (see e.g. Leggett et al. 1996), a WD blackbody temperature ofT1=30 000 K,E(B−V)=
0.047 with the constraintM1<1.4 Mand then performed a grid
search ini. Given that there are three different data sets with different numbers of data points, to optimize the fitting procedure we assigned relative weights to them. After our initial search of the parameter space, which resulted in a good solution, we scaled the uncertainties on each data set (i.e. the light curve and the radial velocity curves) so that the total reduced χ2of the fit was∼1 for each data set
separately. The fitting procedure was then repeated to produce the final set of parameters. We have checked that the results do not significantly change upon varyingT2by a few hundred degrees.
By combining the best-fitting model parametersq,iandK2with
the mass function equation, we can determineM1andM2. In Fig.6,
we show the best-fitting solutions in the (M1–M2) plane, where the
most probable value for the binary masses are M1 = 0.87 M
andM2=0.47 M. The red circles in the figure show the 99 per
[image:7.595.334.519.82.256.2]Figure 6. M1–M2plane with the best-fitting solutions. The solid red circles
show the 99 per cent confidence level solutions. The dashed line corresponds to a mass ratio ofq=0.54. The bars at the lower left represent the typical error.
solutions with the 99 per cent confidence level. As one can see the (M1–M2) solution allows us to constrainq; the dashed line in Fig.6
[image:8.595.321.538.92.208.2]shows the best fit withq=0.54±0.02, which when combined with
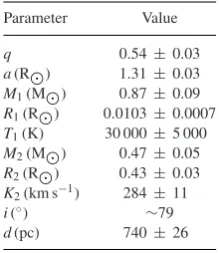
Table 6. Results obtained from the model fits to theI-band optical light curve, NaIabsorption-line and CaIIemission-line radial
veloc-ity curves of HS 0220+0603 forT2=3000 K andT1=30 000 K.
Parameter Value
q 0.54±0.03
K2(km s−1) 284±11
dpc 740±26
logFX, 0(erg cm−2s−1) −11.7±0.05
γAV(km s−1) 1.8±2.3
FAV 1.06±0.06
FEV 1.03±0.02
M1(M) 0.87±0.09
M2(M) 0.47±0.05
the (i−q) solutions obtained from the ULTRACAM eclipse fitting (see Section 6.1), givesi∼79◦. In Fig.7, we show the light curve and radial velocity curves for the best-fitting model parameters;
M1=0.87 MandM2=0.47 M,i=79◦,T2=3000 K andT1=
30 000 K.
We also present a model prediction of the Hαemission-line radial velocity curve (not included in the fitting process) assuming that all of the inner face of the secondary star is irradiated. The model nicely
[image:8.595.58.542.330.696.2]Figure 8. Comparison of the HS 0220+0603 average Hβabsorption profile (top grey spectrum) with the Hβabsorption profiles of three magnetic WDs (showing the characteristic Zeeman splitting) with magnetic fields of 8.4, 4.1 and 1.0 MG (from top to bottom; see text for details).
reproduces the observed Hαradial velocity curve, but note that the Hαemission line is also seen around zero phase, indicating that it is not entirely driven by irradiation. We suggest that chromospheric Hαemission is also occurring in the secondary star (also see Mason et al.2008, for the case of VV Pup in the low state).
7 D I S C U S S I O N
7.1 The white dwarf
The spectral decomposition of the optical spectrum of HS 0220+0603 in the low state revealed a DAB WD withTeff 30 000 K and logg8.35. On the other hand, our dynamical so-lution of the binary system provided a WD with massM1=0.87±
0.09 M. Cubic interpolation of theq−r1data from the
ULTRA-CAM eclipse modelling (see Table4) yields a scaled WD radius
R1/a=0.0078±0.0004 for a mass ratioq=0.54, which translates
into a WD radiusR1 = 0.0103±0.0007 R. The WD surface
gravity derived from the measured mass and radius is logg=8.36, in good agreement with the logg8.35 value found from spec-tral modelling (Section 5.1). When the WD radius is used in the WD spectral modelling a distance of∼763 pc is derived, which is consistent with the results presented in Section 6.2 (see Table6).
Circular polarimetry observations of SW Sex stars show that some systems may contain magnetic WDs (Rodr´ıguez-Gil et al.
2001,2002; Rodr´ıguez-Gil, Mart´ınez-Pais & de la Cruz Rodr´ıguez
2009). In order to check for any Zeeman splitting in the WD spectrum of HS 0220+0603, we compare the average Hβ absorp-tion profile of HS 0220+0603 with three magnetic WDs (Fig.8): SDSS J151130.17+422023.00 (Teff = 30 882 K, B1 = 8.4 MG;
Kepler et al.2013), SDSS J154305.67+343223.6 (Teff=25 000 K,
B1=4.1 MG; K¨ulebi et al.2009) and SDSS J091005.44+081512.2
(Teff=25 000 K,B1=1.0 MG; K¨ulebi et al.2009). We can therefore
rule out a WD magnetic field in excess of 8 MG in HS 0220+0603, butB14.1 MG would pass undetected due to the poor
signal-to-noise ratio. Blue spectra of better quality are needed to confirm any Zeeman splitting in the low state.
Observations of accreting WDs in CVs indicate that they are significantly more massive than isolated WDs. The statistical stud-ies of the CV population by Smith & Dhillon (1998) and Knigge (2006) produced mean WD masses of 0.80±0.22 M(above the period gap, 0.69 ± 0.13 M below) and 0.75 ±0.05 M, re-spectively. Also, Savoury et al. (2011) and Zorotovic, Schreiber & G¨ansicke (2011) report more massive WDs in CVs. The WD mass for HS 0220+0603 fits well within these results. In addition, the WD mass of the eclipsing dwarf nova IP Peg (P=3.80 h) is measured to be 1.16±0.02 M(Copperwheat et al.2010). On the other hand, the mass distribution of isolated WDs peaks at 0.6 M (e.g. Koester, Schulz & Weidemann1979; Bergeron, Saffer & Liebert
1992; Kepler et al.2007; Falcon et al.2010; Tremblay et al.2013). The distribution of WD effective temperature as a function of the orbital period may serve as a probe of CV evolution. Changes in the mass transfer rate reflect in the WD effective temperature, which is determined by compressional heating of the WD by the accreted matter. Therefore,Teff can be a good tracer of the medium-term
(103–105yr) mass transfer rate (Townsley & Bildsten2003;
Towns-ley & G¨ansicke2009). The WD effective temperatures predicted by the evolutionary sequences of Knigge et al. (2011) are signifi-cantly cooler than the data below the period gap, and show large disagreement in the 3–4 h orbital period range, where the scarce measurements point to much hotter WDs than expected (see fig. 5 of Townsley & G¨ansicke2009and fig. 16 of Knigge et al.2011). However, the relationship between the time-averaged mass transfer rate and the WD temperature has to be used with caution. As Towns-ley & G¨ansicke (2009) point out, the mass transfer rate for a given
Teffstrongly depends on the WD mass, which again highlights the
need for independent mass measurements. In addition, a dominant WD in the blue/UV is also a requirement for a reliableTeff
determi-nation. Hence, studies of the WDs in CVs in the low state like the one presented here are important to test the current CV evolutionary sequences in the 3–4 h regime. In this regard, Knigge et al. (2011) suggest that the large scatter of the WD temperatures observed in this orbital period interval may be the result of the temperatures not tracing the secular mass transfer rates.
The measured temperature and mass of the WD in HS 0220+0603 result in a time-averaged mass transfer rate of M˙ =(1.1±1.2)× 10−9M
yr−1. This value places HS 0220+0603 closer to the
evolutionary sequences of Knigge et al. (2011) than MV Lyr, TT Ari and DW UMa, but at the same time increases the scatter in
˙
M observed close to the upper edge of the period gap (fig. 5 of Townsley & G¨ansicke2009). In contrast, IP Peg (also in the 3– 4 h orbital period regime) may have a time-averaged mass transfer rate as low as M˙<5×10⁻¹¹M
yr−1as derived from its WD
temperature (10 000–15 000 K; Copperwheat et al.2010), almost 30 times lesser than the value inferred for HS 0220+0603 from its WD temperature. These authors also point out the possibility that the WD temperature might not be a good tracer of the medium-term mass transfer rate. The time-averaged mass transfer rate of IP Peg is also inconsistent with the results of the population synthesis study by Howell et al. (2001). It is therefore clear that more direct measurements of masses and temperatures of WDs in the 3–4 h orbital period regime are needed.
7.2 The M-type companion
Figure 9. Period–mass data of CV donors (data from Knigge2006). All mass estimates come from superhump period excesses. The SW Sex systems are marked with grey squares. The large grey square corresponds to our results for HS 0220+0603 while IP Peg is plotted as a large grey triangle. The dark grey solid line shows the best-fitting evolutionary model track of Knigge et al. (2011).
fits presented in Section 6.2 never produced a secondary star mass smaller than 0.3 M. We have approximated the radius of the donor star by its Roche lobe volume radius (Eggleton1983). The donor radius can then be derived from its scaled valueR2/aby using the
binary parameters of HS 0220+0603. The resulting Roche lobe volume radius of the M-dwarf is thenR2=0.43±0.03 R. The
distance to the system when this radius is taken into account in the M-dwarf spectral modelling is found to range between 740 and 940 pc for the spectral types M5 and M6, respectively. This is consistent with both the distances from the WD spectral modelling and the dynamical modelling presented in Section 6.2.
However, our derived mass for the secondary star runs counter to expectations for an orbital period of 3.58 h. The semi-empirical CV evolution track of Knigge et al. (2011) points to an M-dwarf mass of 0.25 M. In Fig.9, we show theP–M2diagram for CVs along
with the evolutionary track of Knigge et al. (2011). Note that all mass values are not direct measurements but come from superhump period excesses, as emphasized in Section 1. The SW Sex systems between 3 and 4 h have been plotted as grey filled squares. We have also plotted the data for the dwarf nova IP Peg (large grey triangle), with an orbital period of 3.80 h and a secondary star mass of 0.55±0.02 M. The secondary star in IP Peg is significantly more massive than predicted by the evolutionary track of Knigge et al. (2011). In addition, the measured mass of the secondary star in HS 0220+0603 marginally fits in the predicted orbital period– secondary mass distribution for CVs of Howell et al. (2001, cf. their fig. 5), while the secondary mass in IP Peg is clearly off.
[image:10.595.307.548.55.267.2]With measured values of 0.55 Mand 0.47 R, Copperwheat et al. (2010) conclude that the secondary star in IP Peg is undersized for its mass, suggesting it is in thermal equilibrium. The same might be happening in HS 0220+0603 with a secondary star mass of 0.47 M and a derived secondary Roche lobe volume radius of 0.43 R. Taken at face value, this indicates that the donor star in HS 0220+0603 may not be bloated at all. This is not common among CVs, in which the secondary stars are believed to be significantly
Figure 10. Same as Fig. 9but for the donor mass–spectral type data. HS 0220+0603 and IP Peg largely deviate from the evolutionary track of Knigge et al. (2011).
oversized for their mass as the result of either nuclear evolution or being out of thermal equilibrium.
In Fig.10, we have plotted the (few) CVs with determinations of both the secondary star mass and spectral type. HS 0220+0603 is marked by a large grey square and IP Peg is plotted with a large grey triangle. Our analysis provided a secondary star spectral type of M5.5±0.5 when the donor star is observed at its inferior conjunction (i.e. phase zero). This indicates a photosphere with temperature around 2800 K (see e.g. Bonnefoy et al. 2014, and references therein). Even if HS 0220+0603 followed the semi-empirical sequence of Knigge et al. (2011) and had a donor mass of 0.25 M, the spectral type would still be cooler than expected. Fig.10also shows that the secondary star in IP Peg is underluminous for its mass. The spectral types measured for HS 0220+0603 and IP Peg are also much later than predicted (Howell et al. 2001, cf. the effective temperature–orbital period distribution for CVs in their fig. 7). Again, we stress the fact that we measured the M5.5±0.5 spectral type of the secondary star in HS 0220+0603 from the average of spectra taken at orbital phases around its inferior conjunction, so any information on spectral type change along the orbit is lost. An illustrative example is the case of the polar CV ST LMi, whose secondary star shows a changing temperature with a much cooler region at orbital phase 0.8 (Howell et al. 2000). Therefore, more detailed studies of the secondary stars in the NL variables which populate the 3–4 h orbital period range during low states should be conducted in order to check how frequent these secondary stars are.
8 C O N C L U S I O N S
We have presented the first dynamical characterization of an eclips-ing SW Sex star in the 3–4 h orbital period range dureclips-ing a low state (see Table7).
Table 7. System parameters for HS 0220+0603. R2 is the
vol-ume radius of the secondary star’s Roche lobe as defined by Eggleton (1983).
Parameter Value
q 0.54±0.03
a(R) 1.31±0.03 M1(M) 0.87±0.09
R1(R) 0.0103±0.0007
T1(K) 30 000±5 000
M2(M) 0.47±0.05
R2(R) 0.43±0.03
K2(km s−1) 284±11
i(◦) ∼79
d(pc) 740±26
suggesting an effective temperature of about 2800 K. The analysis of the spectrum of HS 0220+0603 also provided the first detection of a DAB WD in a CV, withTeff=30 000±5000 K. By modelling
the ULTRACAM light curve of the WD eclipse, we determined solutions in the binary mass ratio–inclination angle plane. Further-more, by simultaneously fitting the radial velocity and irradiated ellipsoidal light curves of the secondary star, we independently cal-culate solutions as well as the unperturbed radial velocity amplitude of the secondary star (K2=284±11 km s−1) and the distance to
the source (d=740±26 pc). Combining the results of the WD and secondary-star modelling we derived the stellar masses to beM1=
0.87±0.09 MandM2=0.47±0.05 Mfor the WD and M
dwarf, respectively. As in IP Peg, the M-dwarf in HS 0220+0603 seems too cool and undersized for its mass. More binary parame-ters from dynamical measurements in NL CVs with orbital periods between 3 and 4 h during low states are needed before a critical com-parison with theoretical predictions can be made. What triggers low states in CVs is still far from being fully understood.
AC K N OW L E D G E M E N T S
We thank Christian Knigge and Mercedes L´opez-Morales for en-lightening discussion. We are also thankful to the anonymous ref-eree for the helpful comments and constructive suggestions for improvement of the manuscript. The use of theMOLLYpackage
de-veloped by Tom Marsh is acknowledged. This research has been supported by the Spanish Ministry of Economy and Competitive-ness (MINECO) under the grants AYA2012–38700 and AYA2010– 18080. PRG acknowledges support from the MINECO under the Ram´on y Cajal programme (RYC–2010–05762). He also acknowl-edges support from the XMM grant NNG05GJ22G. He is thankful to the staff of the Harvard–Smithsonian Centre for Astrophysics for a pleasant visit during which part of this work was carried out. He also wishes to thank all the M1 Group observers for their long-term dedication to the search for low states. TRM and DS acknowledge support from the UK’s Science and Technology Fa-cilities Council, grant ST/L000733/1. The research leading to these results has received funding from the European Research Coun-cil under the European Union’s Seventh Framework Programme FP 2007–2013 ERC Grant Agreement no. 320964 (WDTracer). MRS acknowledges support from FONDECYT (grant 1141269) and from the Millennium Nucleus RC130007 (Chilean Ministry of Economy). VSD and ULTRACAM are supported by the STFC. Based in part on observations collected at the European
Organiza-tion for Astronomical Research in the Southern hemisphere, Chile, under programme 074.D–0657, and on observations obtained with
XMM–Newton, an ESA science mission with instruments and con-tributions directly funded by ESA Member States and NASA, and on observations made with the WHT operated on the island of La Palma by the Isaac Newton Group in the Spanish Observatorio del Roque de los Muchachos, and on observations made with the NOT operated by the Nordic Optical Telescope Scientific Association at the Observatorio del Roque de los Muchachos, La Palma, Spain, and on observations made with the IAC80 telescope operated on the island of Tenerife by the Instituto de Astrof´ısica de Canarias in the Spanish Observatorio del Teide. The WHT data were obtained as part of the 2004 International Time Programme of the night-time telescopes at the European Northern Observatory.
R E F E R E N C E S
Araujo-Betancor S., G¨ansicke B. T., Long K. S., Beuermann K., de Martino D., Sion E. M., Szkody P., 2005, ApJ, 622, 589
Arnaud K. A., 1996, in Jacoby G. H., Barnes J., eds, ASP Conf. Ser. Vol. 101, Astronomical Data Analysis Software and Systems V. As-tron. Soc. Pac., San Francisco, p. 17
Bergeron P., Saffer R. A., Liebert J., 1992, ApJ, 394, 228
Bianchini A., 1992, in Vogt N., ed., ASP Conf. Ser. Vol. 29, Vina del Mar Workshop on Cataclysmic Variable Stars. Astron. Soc. Pac., San Francisco, p. 284
Billington I., Marsh T. R., Dhillon V. S., 1996, MNRAS, 278, 673 Boeshaar P. C., 1976, PhD thesis, Ohio State Univ.
Bonnefoy M., Chauvin G., Lagrange A.-M., Rojo P., Allard F., Pinte C., Dumas C., Homeier D., 2014, A&A, 562, A127
Chabrier G., Baraffe I., 1997, A&A, 327, 1039
Ciardi D. R., Howell S. B., Hauschildt P. H., Allard F., 1998, ApJ, 504, 450 Claret A., 1998, A&A, 335, 647
Cook B. A., Williams P. K. G., Berger E., 2014, ApJ, 785, 10
Copperwheat C. M., Marsh T. R., Dhillon V. S., Littlefair S. P., Hickman R., G¨ansicke B. T., Southworth J., 2010, MNRAS, 402, 1824
Cox J. P., Giuli R. T. eds 1969, Principles of Stellar Structure, Vol. II. Gordon & Breach, New York
de Jong J. A., van Paradijs J., Augusteijn T., 1996, A&A, 314, 484 Dhillon V. S., Jones D. H. P., Marsh T. R., 1994, MNRAS, 266, 859 Dhillon V. S. et al., 2007, MNRAS, 378, 825
Eggleton P. P., 1983, ApJ, 268, 368
Falcon R. E., Winget D. E., Montgomery M. H., Williams K. A., 2010, ApJ, 712, 585
Gabriel M., 1969, in Kumar S. S., ed., Low-Luminosity Stars. Gordon & Breach, New York, p. 267
G¨ansicke B. T. et al., 2009, MNRAS, 397, 2170
Gianninas A., Strickland B. D., Kilic M., Bergeron P., 2013, ApJ, 766, 3 Gupta A., Galeazzi M., Williams B., 2011, ApJ, 731, 63
G¨uver T., ¨Ozel F., 2009, MNRAS, 400, 2050
Hauschildt P. H., Allard F., Baron E., 1999, ApJ, 512, 377 Hessman F. V., G¨ansicke B. T., Mattei J. A., 2000, A&A, 361, 952 Horne K., 1986, PASP, 98, 609
Howell S. B., Ciardi D. R., Dhillon V. S., Skidmore W., 2000, ApJ, 530, 904 Howell S. B., Nelson L. A., Rappaport S., 2001, ApJ, 550, 897
Jansen F. et al., 2001, A&A, 365, L1
Kafka S., Ribeiro T., Baptista R., Honeycutt R. K., Robertson J. W., 2008, ApJ, 688, 1302
Kalberla P. M. W., Burton W. B., Hartmann D., Arnal E. M., Bajaja E., Morras R., P¨oppel W. G. L., 2005, MNRAS, 440, 775
Kepler S. O., Kleinman S. J., Nitta A., Koester D., Castanheira B. G., Giovannini O., Costa A. F. M., Althaus L., 2007, MNRAS, 375, 1315 Kepler S. O. et al., 2013, MNRAS, 429, 2934
King A. R., Cannizzo J. K., 1998, ApJ, 499, 348
Knigge C., 2006, MNRAS, 373, 484
Knigge C., Baraffe I., Patterson J., 2011, ApJS, 194, 28 Koester D., Schulz H., Weidemann V., 1979, A&A, 76, 262
K¨ulebi B., Jordan S., Euchner F., G¨ansicke B. T., Hirsch H., 2009, A&A, 506, 1341
Leggett S. K., Allard F., Berriman G., Dahn C. C., Hauschildt P. H., 1996, ApJS, 104, 117
L´epine S., Rich R. M., Shara M. M., 2003, AJ, 125, 1598 Livio M., Pringle J. E., 1994, ApJ, 427, 956
Lucy L. B., 1967, Z. Astrophys., 65, 89
Manser C. J., G¨ansicke B. T., 2014, MNRAS, 442, L23 Mason K. O. et al., 2001, A&A, 365, L36
Mason E., Howell S. B., Barman T., Szkody P., Wickramasinghe D., 2008, A&A, 490, 279
Patterson J. et al., 2005, PASP, 117, 1204
Phillips S. N., Shahbaz T., Podsiadlowski P., 1999, MNRAS, 304, 839 Pizzolato N., Maggio A., Micela G., Sciortino S., Ventura P., 2003, A&A,
397, 147
Pyrzas S. et al., 2009, MNRAS, 394, 978
Reid I. N., Hawley S. L., Gizis J. E., 1995, AJ, 110, 1838 Reiners A., Mohanty S., 2012, ApJ, 746, 43
Rodr´ıguez-Gil P., Casares J., Mart´ınez-Pais I. G., Hakala P., Steeghs D., 2001, ApJ, 548, L49
Rodr´ıguez-Gil P., Casares J., Mart´ınez-Pais I. G., Hakala P. J., 2002, in ASP Conf. Ser. Vol. 261, The Physics of Cataclysmic Variables and Related Objects. Astron. Soc. Pac., San Francisco, p. 533
Rodr´ıguez-Gil P. et al., 2007, MNRAS, 377, 1747
Rodr´ıguez-Gil P., Mart´ınez-Pais I. G., de La Cruz Rodr´ıguez J., 2009, MN-RAS, 395, 973
Rodr´ıguez-Gil P., Schmidtobreick L., Long K. S., G¨ansicke B. T., Torres M. A. P., Rubio-D´ıez M. M., Santander-Garc´ıa M., 2012, MNRAS, 422, 2332
Savoury C. D. J. et al., 2011, MNRAS, 415, 2025 Schlafly E. F., Finkbeiner D. P., 2011, ApJ, 737, 103
Schmidtobreick L., Rodr´ıguez-Gil P., Long K. S., G¨ansicke B. T., Tappert C., Torres M. A. P., 2012, MNRAS, 422, 731
Schmitt J. H. M. M., Liefke C., 2004, A&A, 417, 651
Schreiber M. R., G¨ansicke B. T., Mattei J. A., 2002, A&A, 384, L6 Schreiber M. R. et al., 2010, A&A, 513, L7
Shahbaz T., Groot P., Phillips S. N., Casares J., Charles P. A., van Paradijs J., 2000, MNRAS, 314, 747
Shahbaz T., Zurita C., Casares J., Dubus G., Charles P. A., Wagner R. M., Ryan E., 2003, ApJ, 585, 443
Shahbaz T., Casares J., Watson C. A., Charles P. A., Hynes R. I., Shih S. C., Steeghs D., 2004, ApJ, 616, L123
Smith D. A., Dhillon V. S., 1998, MNRAS, 301, 767
Smith R. K., Brickhouse N. S., Liedahl D. A., Raymond J. C., 2001, ApJ, 556, L91
Str¨uder L. et al., 2001, A&A, 365, L18
Thorstensen J. R., Ringwald F. A., Wade R. A., Schmidt G. D., Norsworthy J. E., 1991, AJ, 102, 272
Townsley D. M., Bildsten L., 2003, ApJ, 596, L227 Townsley D. M., G¨ansicke B. T., 2009, ApJ, 693, 1007
Tremblay P.-E., Ludwig H.-G., Steffen M., Freytag B., 2013, A&A, 559, A104
Tsang B. T. H., Pun C. S. J., Di Stefano R., Li K. L., Kong A. K. H., 2012, ApJ, 754, 107
Turner M. J. L. et al., 2001, A&A, 365, L27 Wade R. A., Horne K., 1988, ApJ, 324, 411
Zorotovic M., Schreiber M. R., G¨ansicke B. T., 2011, A&A, 536, A42