0022-538X/97/$04.0010
Copyrightq1997, American Society for Microbiology
Evolution of Human Immunodeficiency Virus Type 1
env
Sequence
Variation in Patients with Diverse Rates of Disease
Progression and T-Cell Function
RICHARD A. MCDONALD,1DOUGLAS L. MAYERS,1† RAYMOND C.-Y. CHUNG,2KENNETH F. WAGNER,3
SILVIA RATTO-KIM,3DEBORAH L. BIRX,1ANDNELSON L. MICHAEL1*
Division of Retrovirology, Walter Reed Army Institute of Research,1and Henry M. Jackson Foundation,3
Rockville, Maryland 20850, and Division of Infectious Diseases, Walter Reed Army Medical Center, Washington, D.C. 203072
Received 16 July 1996/Accepted 27 November 1996
We examined the relationship betweenenvsequence variation and disease progression in 10 human immu-nodeficiency virus type 1 (HIV-1)-seropositive subjects selected from a longitudinal cohort receiving zidovudine therapy. Five subjects were chosen for stable clinical status and CD4 counts (slow progressors), and five were selected for rapid clinical deterioration and CD4 count decline (rapid progressors). The slow progressors had significantly lower plasma viral RNA loads and greater lymphoproliferative responses to mitogens than the rapid progressors. DNA sequences representing the C1 through C3 regions ofenvwere amplified from two peripheral blood mononuclear cell DNA samples from each subject separated by an average of 2.5 years. Molecular clones of these amplicons were then sequenced, and DNA sequence and deduced amino acid sequence distances were compared. Inter-time point sequence comparison showed a higher rate of sequence evolution for the rapid progressors in three of five matched pairs of rapid progressors and slow progressors and for the slow progressors in the remaining two subject pairs. However, intra-time point sequence compar-isons showed that four of five slow progressors developed a more diverse quasispecies over time and one showed no change. In contrast, four of five rapid progressors showed no change in quasispecies diversity over time and one showed a significant decrease in diversity. The overall C1 through C3 region quasispecies diversity in the slow progressors at baseline was lower than that for the rapid progressors, but this difference was not significant at the follow-up time points. These diversity relationships were obscured if sequence analyses were limited to the 300-bp C2 to V3 region. Thus, HIV-1 quasispecies diversity increased over time in subjects with more functional immune systems.
Human immunodeficiency virus type 1 (HIV-1) replication is characterized by a high degree of viral sequence variation (1, 6, 8, 11, 13, 14, 18, 24, 32, 34, 39, 40). HIV-1 disease is asso-ciated with a progressive deterioration of the host immune system as a consequence of chronic viral replication in suscep-tible host cells. The diminution of the host immune system should predict a progressive loss of host adaptive pressures over the course of HIV disease. Thus, given a constant rate of HIV replication error, the mutation fixation rate should dimin-ish over time, resulting in a lower degree of viral diversity in late-stage disease (3, 4, 19, 36). This hypothesis has been pre-viously examined, with mixed conclusions. Although some ear-lier studies failed to demonstrate a relationship between viral sequence diversity and disease course (6, 17), more recent data support this hypothesis (5, 7, 15, 38).
We tested the hypothesis that the degree of HIV-1 DNA sequence diversity is inversely correlated with the stage of HIV-1 disease in a subcohort of five slow progressors and five rapid progressors chosen from a longitudinal study of zidovu-dine therapy. Although matched for CD4 count at baseline, the slow progressors had no change in CD4 count or clinical status, while the rapid progressors exhibited a$65% decline in CD41
cell count and clinically progressed. Furthermore, the slow progressors had lower plasma viral loads and greater T-cell responses to mitogenic stimulation. Sequences representing the C1 to C3 regions from the env gene were isolated from peripheral blood mononuclear cell (PBMC) DNA from two time points spanning a 2.5-year follow-up period, and both the evolution rate (inter-time point) and diversity (intra-time point) of the quasispecies were analyzed. Although the rate of sequence evolution was higher for the rapid progressors in three of five matched pairs of slow and rapid progressors, the diversity of the quasispecies increased over time in the slow progressors but was static or decreased in the rapid progres-sors. Importantly, sequence analyses limited to the C2 to V3 loop region failed to discriminate quasispecies diversity differ-ences between the two progression subcohorts.
MATERIALS AND METHODS
Cohort characterization.Ten initially asymptomatic HIV-1-seropositive sub-jects with CD4 counts of less than 400 cells/ml (2526104) and receiving zidovudine monotherapy were selected from a cohort being prospectively fol-lowed to evaluate the time course and clinical significance of zidovudine resis-tance (16). The 10 subjects were selected as five pairs with similar initial CD4 cell counts but markedly disparate final CD4 counts and clinical status at follow-up (29.966.3 months; range, 22 to 36 months) (Table 1). Subjects with stable CD4 counts and clinical status were classified as slow progressors, whereas subjects with lower CD4 counts (88% 613% decline) and clinical progression were classified as rapid progressors. Plasma viral load was determined in these subjects by using a quantitative, noncompetitive reverse transcriptase PCR reaction assay (35).
Lymphoproliferative assays.Recombinant gp160 (NL4-3 clone) produced in baculovirus was obtained from MicroGeneSys (Meriden, Conn.). Tetanus toxoid and diphtheria were obtained from Connaught (Willowdale, Ontario, Canada).
* Corresponding author. Mailing address: Division of Retrovirology, Walter Reed Army Institute of Research, 13 Taft Court, Suite 200, Rockville, MD 20850. Phone: (301) 762-0089. Fax: (301) 762-4177. E-mail: [email protected].
† Present address: Division of Infectious Diseases, National Naval Medical Center, Bethesda, MD 20892.
1871
on November 9, 2019 by guest
http://jvi.asm.org/
Pokeweed mitogen (PWM), phytohemagglutinin (PHA), and concanavalin A (ConA) were obtained from Sigma (St. Louis, Mo.). The proliferative responses of subject PBMC to antigens and mitogens were measured by incubating 105cells
per well in 96-well U-bottom plates (Costar, Cambridge, Mass.) with serial antigen concentrations of tetanus toxoid (6.5 and 3.25 limit of flocculation [L.f.]), diphtheria (23 and 11.5 L.f.), and gp160 (3.1, 1.5, 0.75, and 0.37mg/ml) and in separate plates with 2mg of PHA, 1.25mg of PWM, and 20mg of ConA per ml. After 3 days of incubation with the mitogens and 7 days with the antigens, cells were pulsed with 1.67mCi of [3H]thymidine per well for 18 h, harvested by using
the Skatron harvesting system (Skatron Instruments, Sterling, Va.), and counted in ab-counter (BetaPlate model 1205; Wallac, Uppsala, Sweden). The data were expressed as LSI (lymphocyte stimulation index) calculated as antigen- or mito-gen-pulsed PBMC cpm/unpulsed PBMC cpm. Cultures were arbitrarily desig-nated positive if their LSIs were greater than or equal to 3 (30).
Recovery and analysis of DNA sequences.A 790-bp amplicon representing the entire V1, V2, and C2 and partial C1 and C3 regions (C1-C3 fragment; HXB2 positions 6,559 to 7,339) (27) was amplified and cloned from DNA extracted from PBMC as previously described (19). Although not measured directly for this cohort, the typical HIV DNA load in our laboratory for subjects in the CD4 intervals enrolled in this study would be 1,000 to 10,000 copies permg of genomic DNA (20). Thus, the HIV copy number in the amount of PBMC genomic DNA used as the template in these studies was adequate to avoid sampling error. Nucleotide sequences exclusive of the inner primer sequences were initially com-piled and translated into amino acids by using EditSeq and SeqMan (DNAStar, Inc.). For subanalysis, a 300-bp portion of the 790-bp amplicon representing the distal portion of C2, the V3 loop, and the proximal portion of C3 (C2-V3 fragment; HXB2 sequence positions 7,032 to 7,313) was used. For cladistic analysis, DNA sequences and deduced amino acid sequences from both the initial and final time points for each subject were aligned, gap stripped, and submitted to distance matrix and neighbor-joining tree analysis using Genetic Data Environment version 2.2 software (33). These same distance matrices were used to compute inter- and intra-time point DNA and intra-time point protein distances. For each subject, 100 inter-time point and two sets of 45 intra-time point distances were extracted. The distribution of distances between (rate of evolution) and within (diversity) the initial and final time points from each subject and for each subcohort were subjected to nonparametric statistical treat-ment using the Wilcoxon signed rank test included in the StatView version 4.01 software package (Abacus Concepts, Berkeley, Calif.). The rate ratios of synon-ymous to nonsynonsynon-ymous nucleotide substitutions (dS/dN) were generated by comparing the initial to the final time point sequences, using the Nei method (22). A phylogeny of all 200 sequences generated in these studies revealed no evidence for intersubject sequence associations and thus no evidence for labo-ratory-generated contamination of the sequence database (data not shown).
GenBank accession numbers.The sequences reported here have been depos-ited at GenBank with accession numbers U69282 through U69481.
RESULTS
Virologic and immunologic characterization of the subco-horts. Five slow progressors were chosen and matched with five rapid progressors (Table 1) based on criteria described in Materials and Methods. Plasma viral RNA was quantified from the initial time point for each subject, and the distribution of these values was determined for each subcohort (Fig. 1). The
viral load in the slow progressors (median 5105.12) was
sig-nificantly lower than the viral load in the rapid progressors (median5105.49) (P50.04, Wilcoxon signed rank test).
We further characterized the differences in the subcohorts by using a lymphoproliferative assay that measures responses to mitogens, recall antigens, and HIV-1-specific antigens. PBMC samples from each subject were evaluated for lympho-proliferative responses (a measurement of T-cell function) at multiple time points for two of the three mitogens (Table 2). Responses to PHA were generally greater than those for PWM (Table 2), whereas the ConA responses were too low to be discriminating (data not shown). Higher absolute values for these lymphoproliferative responses were observed for the slow progressors than for the rapid progressors for both PHA and PWM (Table 2).
The distribution of mitogenic responses was statistically an-alyzed by both absolute LSI values and categorical transfor-mation of the absolute LSI values into positive ($3.0) and negative (,3.0) values (Table 3). The mean mitogenic re-sponses were given for each mitogen by subcohort for the entire course of the study (all years) as well as for each of the 2 years of the study along with thePvalues of their cognate statistical treatments. Absolute LSI distributions were ana-lyzed by the Mann-Whitney test, and categorically transformed LSI data were analyzed with the chi-square test. PHA re-sponses were significantly higher in the slow progressors than in the rapid progressors by both statistical treatments for all years of the study as well as for year 1 and year 2 alone (Table 3). PWM responses were higher in the slow progressors at all time points by analysis of absolute LSI values and by categor-ical analysis for all time points except for year 1, where there was a strong trend toward statistical significance (P 50.06). Lymphoproliferative responses to tetanus and diphtheria tox-oids and to gp160 (env) antigen were uniformly low (below an LSI of 2.0 in the majority of cases) for both the slow progres-sors and the rapid progresprogres-sors (data not shown). Data from assays using PHA and PWM indicate a distinctly higher level of T-cell function in the slow-progressor subcohort than in the rapid-progressor subcohort.
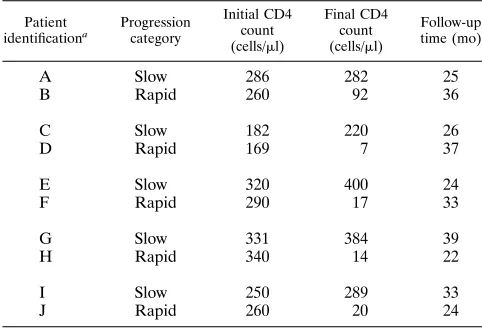
[image:2.612.57.298.82.246.2]Rate of evolution of individual viral quasispecies.DNA se-quence distances were computed from a pairwise comparison of C1-C3envDNA sequences derived from individual molec-ular clones from both the initial and final time points for each subject. Neighbor-joining DNA trees constructed by using TABLE 1. Cohort characteristics
Patient
identificationa Progressioncategory
Initial CD4 count (cells/ml)
Final CD4 count (cells/ml)
Follow-up time (mo)
A Slow 286 282 25
B Rapid 260 92 36
C Slow 182 220 26
D Rapid 169 7 37
E Slow 320 400 24
F Rapid 290 17 33
G Slow 331 384 39
H Rapid 340 14 22
I Slow 250 289 33
J Rapid 260 20 24
aAll subjects were males.
FIG. 1. Viral load comparison of the slow- and rapid-progressor subcohorts. The distribution of initial plasma HIV-1gagRNA levels is shown for each subcohort. For each distribution, the horizontal lines represent the 10th, 25th, 50th (median), 75th, and 90th percentiles of viral load. The median value for each subcohort is given in parentheses.
on November 9, 2019 by guest
http://jvi.asm.org/
these distance values are shown in Fig. 2. For each subject, the rate of evolution of quasispecies diversity is tracked by com-paring the distribution of sequences at the initial and final time points. Distinct, temporal clustering of sequences at each time point is seen for all subjects. This pattern is indicative of continuous quasispecies evolution in all subjects. The rate of quasispecies evolution was derived for each subject by analysis of the inter-time point distances (n 5 100). The means 6 standard deviations of these distances are given in Table 4. Slow-progressor subjects A and G showed a higher rate of quasispecies evolution compared with the cognate rapid-pro-gressor subjects B and H. Rapid-prorapid-pro-gressor subjects D, F, and J showed a higher rate of quasispecies evolution compared with the cognate slow-progressor subjects C, E, and I. Taken as subcohorts, the rate of quasispecies evolution in the slow pro-gressors (0.07760.039) was lower than for the rapid progres-sors (0.10060.055) (P50.0007).
[image:3.612.320.556.77.294.2]Diversity trends of individual viral quasispecies.Visual in-spection of the neighbor-joining trees suggested a trend toward greater diversity at the final time point for the nonprogressors (Fig. 2A, C, E, G, and I) compared with static or decreasing diversity in the progressors (Fig. 2B, D, F, H, and J). These TABLE 2. Lymphoproliferative responses to mitogenic
stimulation of PBMC
Patient identification
(progression category) Moa
LSI (mean cpm of mitogen-stimulated wells/mean cpm of medium wells)
PHA PWM
A (slow) 0 260.4 42.3
3 41.7 11.2
5 290.0 45.1
9 33.2 81.0
12 81.5 17.0
18 42.2 9.8
22 81.3 20.2
24 2.4 2.6
B (rapid) 0 225.6 10.5
6 35.0 10.0
9 23.5 8.0
13 1.5 0.0
15 1.0 1.3
18 2.3 1.2
22 1.2 1.0
24 1.5 1.3
C (slow) 0 12.3 4.7
3 6.2 2.9
6 48.7 11.3
9 1.2 23.3
14 5.9 13.2
18 6.8 0.0
24 2.6 11.9
D (rapid) 0 1.7 0.8
3 1.3 1.3
5 2.2 3.6
9 3.0 2.5
12 1.5 1.8
15 1.0 1.3
19 2.9 2.0
22 1.8 1.2
E (slow) 0 1.0 4.3
2 190.3 50.8
5 13.3 6.6
8 38.3 11.0
11 28.6 9.2
14 0.9 3.0
17 46.1 10.3
F (rapid) 0 1.9 1.1
3 1.7 2.6
6 5.3 11.0
9 1.3 4.1
11 3.9 6.6
15 1.2 0.5
24 4.1 2.7
G (slow) 0 73.0 24.0
6 109.8 27.9
9 1.4 1.0
12 46.3 6.3
15 59.3 7.3
18 92.3 12.3
21 36.0 8.6
24 1.3 0.0
H (rapid) 0 3.3 56.5
3 1.4 1.3
6 5.7 22.0
[image:3.612.60.294.88.721.2]Continued
TABLE 2—Continued
Patient identification
(progression category) Moa
LSI (mean cpm of mitogen-stimulated wells/mean cpm of medium wells)
PHA PWM
I (slow) 0 0.9 3.2
3 39.1 11.7
6 35.2 16.5
9 41.4 16.5
12 93.6 11.8
15 2.3 2.4
18 2.6 2.4
21 23.9 13.9
24 4.3 6.3
J (rapid) 0 1.9 4.1
3 23.1 3.2
6 13.0 29.7
9 80.5 8.5
12 1.8 2.1
18 1.2 1.1
21 1.0 1.0
[image:3.612.315.557.586.692.2]aTime post-study entry that sample was analyzed.
TABLE 3. Subcohort pooled mitogenic stimulation data
Mitogen Trialyra
LSI Pvalue
Slow
progressors progressorsRapid Mann-Whitney Chi-squareb
PHA All 48.7 13.9 0.0001 0.001
1 64.7 20.9 0.006 0.03
2 25.6 1.7 0.001 0.004
PWM All 14.5 6.2 0.0001 0.0005
1 19.1 9.1 0.005 0.06
2 7.8 1.2 0.001 0.0002
aSum of all data from 0 to 24 months for all years, 0 to 12 months for year 1,
and 13 to 24 months for year 2.
bLSI values of,3.0 were assigned as negative and values of $3.0 were
assigned as positive for chi-square treatment.
on November 9, 2019 by guest
http://jvi.asm.org/
trends were quantitatively evaluated by using the subset of intra-time point sequences distances (n545) extracted from the intra- and inter-time point distance values used to con-struct each neighbor-joining tree. Mean intra-time point dis-tances are shown in Table 5. The distributions of these DNA distances were compared by the Wilcoxon sign rank test (Table 5). Slow-progressor subjects A, C, E, and I showed an increase (average 6 standard deviation 5 0.024 6 0.011) in DNA sequence distance over the 2-year period. Subject G showed no
[image:4.612.141.469.67.574.2]statistically significant change in DNA sequence variation dur-ing this period. The same statistical relationships were found for deduced amino acid sequence variation (Table 6). In con-trast, rapid-progressor subjects B and J showed a statistically significant decrease in DNA sequence variation, while subjects D, F, and H showed no statistically significant change in DNA sequence variation during this period. Only the decreased vari-ation for subject B was statistically significant for the evolution of deduced amino acid sequences (Table 6). These quantitative
FIG. 2. Neighbor-joining trees ofenvC1 through C3 region DNA sequences. DNA distances computed from gap-stripped sequences representing the C1 through C3 regions ofenvfrom both the initial and final time points from each subject were used to construct neighbor-joining trees. DNA sequences from the initial time point are shown as open circles, and those from the final time point are shown as closed circles. A distance scale is given for each tree, as a uniform scale is not generated by the tree program. A, C, E, G, and I, slow-progressor subjects; B, D, F, H, and J, rapid-progressor subjects.
on November 9, 2019 by guest
http://jvi.asm.org/
assessments of intra-time point DNA sequence diversity con-firmed the qualitative impression of a trend toward greater sequence diversity in the slow progressors than in the rapid progressors obtained from visual inspection of the neighbor-joining trees (Fig. 1).
These same analyses were computed by using the 300-bp C2-V3 fragment sequences contained within the C1-C3 frag-ment. Overall, analyses limited to this small fragment in-creased the observed amount of variation. Slow-progressor subjects A, C, E, and I once again showed an increase (0.0286 0.008) in DNA sequence variation, whereas subject G showed no statistically significant change (Table 5). Similarly, the same statistical relationships were found for protein sequence vari-ation (Table 6). Although rapid-progressor subject B still showed a significant decrease in DNA sequence variation, the decreased variation for subject J was no longer statistically significant. Subjects D, F, and H showed a statistically signifi-cant increase in DNA sequence variation in analyses using this subfragment, whereas no significant changes were observed with the larger C1-C3 fragment. The decreased variation for subject B and increased variation for subjects F and H were
statistically significant for the evolution of C2-V3 fragment sequences.
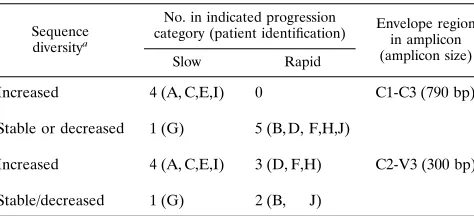
A summary of the trends in intra-time point viral quasispe-cies diversity for these subjects, computed for both the C1-C3 fragment and the C2-V3 subfragment, is given in Table 7. All subjects were categorized into either an increased or a stable/ decreased sequence diversity group and sorted by disease pro-gression subcohort. In an analysis using the larger C1-C3 frag-ment, four of five slow progressors showed increased diversity and one showed stable/decreased diversity, while all five rapid progressors showed stable/decreased diversity. The same cat-egorization applied to the slow progressors when analysis was limited to the C2-V3 subfragment. However, three of five rapid progressors showed increased diversity in analyses using this subfragment. Thus, a smaller DNA fragment for genetic vari-ation calculvari-ations was less robust for discriminating between slow and rapid progressors than a larger fragment of DNA which includes, but is not limited to, this subfragment.
The rate ratios of inter-time point synonymous to nonsyn-onymous nucleotide substitutions computed for each subject from the C1-C3 fragment did not differ significantly between the slow and rapid progressors (1.211 6 0.322 and 1.2826 0.243, respectively;P50.50).
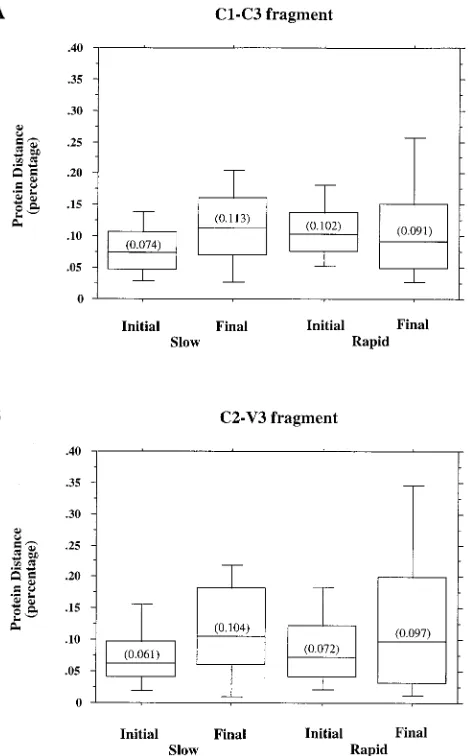
[image:5.612.57.298.82.263.2]DNA sequence diversity trends between the subcohorts.The distribution of intra-time point DNA distances for the initial and final time points for the C1-C3 region fragment for the slow and rapid progressors are shown in Fig. 3A. A statistically significant 1.5-fold increase in sequence diversity was observed for the slow progressors (P,0.0001). No statistically signifi-cant change in the sequence diversity of the rapid progressors was noted (P50.079). Although the initial sequence diversity of the slow progressors was significantly lower than the initial sequence diversity seen for the rapid progressors (P,0.0001), this difference between the subcohorts was not significant at the final time point (P50.202). Thus, the amount of sequence diversity rose in the slow progressors but remained static in the rapid progressors. These same distributions were computed by using the C2-V3 subfragment (Fig. 3B), and as expected, the overall amount of calculated sequence diversity rose. A statis-tically significant 1.9-fold increase in sequence diversity was observed for the slow progressors (P,0.0001), and a 1.5-fold increase was noted for the rapid progressors (P50.0006). The amount of sequence diversity for the slow progressors was TABLE 4. Inter-time point distances for envelope DNA sequences
Patient
identification Progressioncategory DNA distance(mean6SD) Psign rank test)value (Wilcoxon
A Slow 0.06460.013 ,0.0001
B Rapid 0.04260.007
C Slow 0.04160.009 ,0.0001
D Rapid 0.08460.032
E Slow 0.06560.029 ,0.0001
F Rapid 0.19260.032
G Slow 0.13260.040 ,0.0001
H Rapid 0.09060.023
I Slow 0.08460.019 ,0.0007
J Rapid 0.09360.018
All slow 0.07760.039 ,0.0001 All rapid 0.10060.055
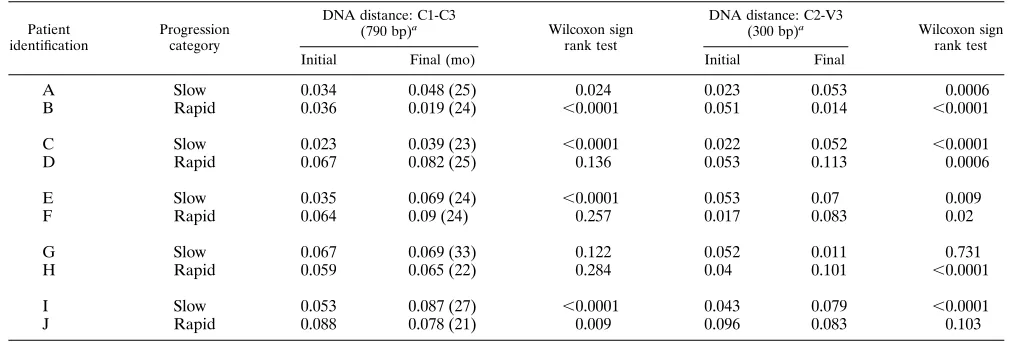
TABLE 5. Intra-time point distances for envelope DNA sequences
Patient
identification Progressioncategory
DNA distance: C1-C3
(790 bp)a Wilcoxon sign
rank test
DNA distance: C2-V3
(300 bp)a Wilcoxon sign
rank test
Initial Final (mo) Initial Final
A Slow 0.034 0.048 (25) 0.024 0.023 0.053 0.0006
B Rapid 0.036 0.019 (24) ,0.0001 0.051 0.014 ,0.0001
C Slow 0.023 0.039 (23) ,0.0001 0.022 0.052 ,0.0001
D Rapid 0.067 0.082 (25) 0.136 0.053 0.113 0.0006
E Slow 0.035 0.069 (24) ,0.0001 0.053 0.07 0.009
F Rapid 0.064 0.09 (24) 0.257 0.017 0.083 0.02
G Slow 0.067 0.069 (33) 0.122 0.052 0.011 0.731
H Rapid 0.059 0.065 (22) 0.284 0.04 0.101 ,0.0001
I Slow 0.053 0.087 (27) ,0.0001 0.043 0.079 ,0.0001
J Rapid 0.088 0.078 (21) 0.009 0.096 0.083 0.103
aThe envelope regions contained in the sequenced amplicons are given with the amplicon size (in parentheses).
on November 9, 2019 by guest
http://jvi.asm.org/
[image:5.612.54.559.547.718.2]significantly lower than that for the rapid progressors at both the initial and final time points (P ,0.0001 and P5 0.003, respectively).
Deduced amino acid sequence diversity trends between the subcohorts.The distributions of deduced amino acid distances for the initial and final time points for the C1-C3 fragment for the slow and rapid progressors are shown in Fig. 4A. Similar to results of the DNA sequence diversity calculations, a statisti-cally significant 1.5-fold increase in sequence diversity was ob-served for the slow progressors (P,0.0001), but no significant change in the sequence diversity of the rapid progressors was noted (P50.097). Again, the initial sequence diversity for the slow progressors was significantly lower than the initial se-quence diversity seen for the rapid progressors (P,0.0001), but this difference was not significant at the final time point (P5 0.228). When these distributions were computed by us-ing the C2-V3 subfragment (Fig. 4B), a significant 1.9-fold increase in sequence diversity was observed for the slow pro-gressors (P,0.0001) and a 1.5-fold increase was noted for the rapid progressors (P5 0.0006). The amount of sequence di-versity for the slow progressors was significantly lower than that for the rapid progressors at the initial but not the final time point (P50.032 andP50.212, respectively). Thus, the amount of protein sequence diversity in the C1-C3 fragment rose in the slow progressors but remained static in the rapid progressors, analogous to the evolution of DNA sequence di-versity. As with the DNA sequence analyses, the amount of protein sequence diversity calculated for the C2-V3 fragment was greater than that calculated for the larger C1-C3 fragment.
DISCUSSION
We have shown that the HIV-1 quasispecies continues to evolve in patients regardless of their rate disease progression. Given that a higher rate of quasispecies evolution was ob-served for the rapid progressors in only three of five matched progression pairs, the higher aggregate rate of evolution for the rapid-progressor subcohort may not be generalizable. A conservative interpretation of these data is that the viral qua-sispecies can continue to evolve even in some patients pro-gressing to advanced stages of HIV-1 disease. However, we have also shown an inverse correlation between disease pro-gression and the trend in intra-time point HIV-1 sequence diversity. The intra-time point quasispecies diversity increased
in four of five slow progressors, while diversity remained static or decreased in all five of the rapid progressors. Thus, the higher aggregate degree of quasispecies diversity for the slow-progressor subcohort is much more likely to be generalizable. Although the study subjects were drawn from a cohort with middle-stage HIV disease, the clear distinctions between the rapid- and slow-progressor subcohorts in viral load, CD4 count stability, and T-cell function validate the selection of these subjects as a progression cohort.
[image:6.612.56.557.82.253.2]When quasispecies diversity was assessed by using the smaller, C2 to V3 regions of gp120, the differences in diversity trends between the two subcohorts was lost. Analyses re-stricted to the C2 to V3 regions showed an overall greater rate of sequence diversity for both the slow- and rapid-progressor subcohorts than identical analyses using the larger C1-C3 frag-ment. This likely resulted from the higher overall variability seen with the distal C2, V3 loop, and proximal C3 regions (21) than with the C1 to C3 regions, which include the entire con-stant domain C2 and the variable V1/V2 regions stripped of their length polymorphisms. Thus, the high degree of sequence variation contained within the C2 to V3 regions is moderated by the constant domains (C1, C2, and C3) in the C1-C3 frag-ment. As analysis of HIV-1 sequence variation using short, highly variable DNA sequences yields an exaggerated view of sequence variation, we would advocate the use of larger DNA fragments to better reflect viral sequence evolution.
TABLE 6. Intra-time point distances for deduced amino acid sequences
Patient
identification Progressioncategory
Protein distance: C1-C3
(790)a Wilcoxon sign
rank test
Protein distance: C2-V3
(300)a Wilcoxon sign
rank test
Initial Final Initial Final
A Slow 0.067 0.091 0.023 0.048 0.102 0.003
B Rapid 0.069 0.038 ,0.0001 0.087 0.031 ,0.0001
C Slow 0.038 0.077 ,0.0001 0.042 0.112 ,0.0001
D Rapid 0.104 0.116 0.509 0.101 0.147 0.062
E Slow 0.067 0.114 ,0.0001 0.098 0.139 0.0004
F Rapid 0.113 0.179 0.247 0.033 0.153 0.008
G Slow 0.132 0.128 0.261 0.107 0.073 0.397
H Rapid 0.107 0.123 0.075 0.071 0.165 ,0.0001
I Slow 0.112 0.166 ,0.0001 0.093 0.155 ,0.0001
J Rapid 0.154 0.139 0.092 0.15 0.154 0.843
aThe envelope regions contained in the sequenced amplicons are given with the amplicon size (in parentheses).
TABLE 7. Categorization of observed sequence diversity by disease progression subcohort
Sequence diversitya
No. in indicated progression
category (patient identification) Envelope regionin amplicon (amplicon size)
Slow Rapid
Increased 4 (A, C,E,I) 0 C1-C3 (790 bp)
Stable or decreased 1 (G) 5 (B, D, F,H,J)
Increased 4 (A, C,E,I) 3 (D, F,H) C2-V3 (300 bp)
Stable/decreased 1 (G) 2 (B, J)
aDNA and deduced amino acid sequence diversity. Patient D showed a
sig-nificant increase for DNA change and a trend for protein change in the C2-V3 analysis.
on November 9, 2019 by guest
http://jvi.asm.org/
[image:6.612.318.555.593.701.2]The data presented here are in agreement with a recent study that found an inverse correlation with genetic variation and disease progression by analysis of the V3 to V5 regions of env(38). Theenvregion in that study was similar to ours in that two constant domains, C3 and C4, smoothed the overall vari-ation introduced by the V3, V4, and V5 variable domains. This study also found a positive correlation ofenvsequence varia-tion to variavaria-tion in cytotoxic T-lymphocyte epitopes and cyto-toxic T-lymphocyte precursor frequency as measures of cellu-lar immune function (38). An earlier study, using heteroduplex mobility assay in lieu of DNA sequence determination, also found an inverse correlation with HIV-1 env variation and disease progression (5), but no assays of host immune function were performed. Roos et al. have also shown a correlation with an in vitro T-cell functional assay and disease progression (29). Increased viral sequence variation has not been correlated with disease progression in all studies, however. The first study to address this issue found no correlation between disease progression and viral sequence variation, using small DNA sequences confined to the highly variable V1 and V2 regions,
in addition to the p24gag region, employing a cross-sectional
[image:7.612.64.307.71.440.2]study design (6). A more recent study found no correlation with disease progression when sequences from the C2 to V3 regions in four subjects were analyzed by using a longitudinal study design (17). Both of these studies were likely biased by both the analysis of small, highly variable sequences and the small numbers of subjects examined. Moreover, the cross-sec-tional study design in the former study did not allow for an analysis of sequence evolution (6). In contrast, in an analysis of sequence evolution of C2 to V3 regions in a rigorously defined, longitudinal disease progression cohort, Lukashov et al. found a correlation with disease progression, using inter-time point dS/dN ratios (15). Whereas we identified an inverse correlation between the two progression subcohorts by using sequence diversity in the C1 to C3 regions derived from intra-time point DNA distance calculations, we did not find a similar relation-ship when inter-time point dS/dN ratios were used. This cor-related in our study to a high rate of inter-time point evolution
FIG. 3.envDNA distance distributions for the slow- and rapid-progressor subcohorts. The distributions ofenvDNA distances are shown for each subco-hort at both the initial and final time points. Distances were calculated by pairwise comparison between 10 sequences for each subject in the study and then pooled by subcohort. For each distribution, the horizontal lines represent the 10th, 25th, 50th (median), 75th, and 90th percentiles of the distance data. The median value for each subcohort is given in parentheses.
FIG. 4.envamino acid distance distributions for the slow- and rapid-pro-gressor subcohorts. The distributions ofenvdeduced amino acid sequence dis-tances are shown for each subcohort at both the initial and final time points. Distances were calculated by pairwise comparison between 10 sequences for each subject in the study and then pooled by subcohort. For each distribution, the horizontal lines represent the 10th, 25th, 50th (median), 75th, and 90th percen-tiles of the distance data. The median value for each subcohort is given in parentheses.
on November 9, 2019 by guest
http://jvi.asm.org/
[image:7.612.324.558.280.658.2]for all patients regardless of progression status. This apparent dichotomy between these two studies can be explained by dif-ferences in study design. The study by Lukashov et al. followed a seroincident cohort for 5 years, whereas we followed a sero-prevalent cohort for 2.5 years. Differences in dS/dN ratios would be more likely to be detected in the former study design, as quasispecies diversity is being tracked from an initial time point with much more limited complexity than in our study.
During chronic infection, a rapid turnover of viral particles is associated with a rapid turnover of CD41T cells that func-tion as both immune modulatory and viral target cells (10, 26, 37). Furthermore, the attenuation of host cellular (2, 9, 25, 28, 30) and humoral immune (2, 12, 25, 31) responses is associated with disease progression. Given a fixed rate of HIV replication error induced by the virus-encoded reverse transcriptase (4) and a progressive relaxation of host immune-mediated selec-tion pressure, one would expect a progressive reducselec-tion in the rate of mutation fixation in the viral genome. This would lead to a progressive reduction in viral sequence variation with disease progression as we found for two of five rapid progres-sors in this study. However, this logic does not account for the three rapid progressors who showed a higher rate of sequence evolution compared with the cognate slow-progressor control subjects. This is likely due to the fact that all 10 subjects, including the slow progressors, entered this study with signifi-cant immune system impairments (supported by the lack of T-cell proliferative responses to recall antigens), unlike the study by Lukashov et al., who followed patients from the time of seroconversion (15).
We did find a striking restriction in quasispecies diversity in the rapid progressors compared with increasing diversity in the slow progressors despite the higher rate of sequence evolution in three of them. Why should this be so? The viral quasispecies is in a constant flux as it adapts to a particular human host. A consequence of this adaptative process is a reduction in host immune selective forces but persistent positive selection coin-cident with the emergence of a restricted number of viral strains with increased fitness for propagation within a given host (15).
Although the data presented here are limited by the sero-prevalent study design, they do not fully support the antigenic diversity threshold model of pathogenesis, which proposes a level of viral variation above which the host immune system cannot respond (23), as we observed static, not increasing, viral sequence diversity in the rapid progressor subcohort. We have previously shown that the degree of V3 region sequence diver-sity is related to the broadness of the humoral response to this epitope (19). Taken together, these data support a view of HIV pathogenesis compatible with a gradual deterioration of a par-tially effective host antiviral immune response associated with an initially high rate of HIV sequence diversity that also di-minishes with late-stage disease as a consequence of relaxed host selective forces and selection for a restricted number of viral genotypes with increased, host-specific fitness.
ACKNOWLEDGMENTS
We thank the RV43 Study Group for clinical study execution. Mer-lin Robb, Mika Salminen, and Karl Sitz provided helpful discussions. We thank Quay Parrott and Laju Patel for technical assistance with the lymphoproliferation studies and Chris Drew for graphic design sup-port.
REFERENCES
1.Ahmad, N., B. M. Baroudy, R. C. Baker, and C. Chappey.1995. Genetic analysis of human immunodeficiency virus type 1 envelope V3 region isolates from mothers and infants after perinatal transmission. J. Virol.69:1001– 1012.
2.Cao, Y., L. Qin, L. Zhang, J. Safrit, and D. D. Ho.1995. Virologic and immunologic characterization of long-term survivors of human immunode-ficiency virus type 1 infection. N. Engl. J. Med.332:201–208.
3.Coffin, J. M.1992. Genetic diversity and evolution of retroviruses. Curr. Top. Microbiol. Immunol.176:143–164.
4.Coffin, J. M.1995. HIV population dynamics in vivo: implications for genetic variation, pathogenesis, and therapy. Science267:483–489.
5.Delwart, E. L., H. W. Sheppard, B. D. Walker, J. Goudsmit, and J. I. Mullins.1994. Human immunodeficiency virus type 1 evolution in vivo tracked by DNA heteroduplex mobility assays. J. Virol.68:6672–6683. 6.Goodenow, M., T. Huet, W. Saurin, S. Kwok, J. Sninsky, and S.
Wain-Hobson.1989. HIV-1 isolates are rapidly evolving quasispecies: evidence for viral mixtures and preferred nucleotide substitution. J. Acquired Immune Defic. Syndr.2:344–352.
7.Goudsmit, J., N. K. T. Back, and P. L. Nara.1991. Genomic diversity and antigenic variation of HIV-1: links between pathogenesis, epidemiology and vaccine development. FASEB J.5:2427–2436.
8.Hahn, B. H., G. M. Shaw, M. E. Taylor, R. R. Redfield, P. D. Markham, S. Z. Salahuddin, F. Wong-Staal, R. C. Gallo, E. S. Parks, and W. P. Parks.1986. Genetic variation in HTLV-III/LAV over time in patients with AIDS or at risk for AIDS. Science232:1548–1553.
9.Harrer, E., T. Harrer, S. Buchbinder, D. L. Mann, M. Feinberg, T. Yilma, R. P. Johnson, and B. D. Walker.1994. HIV-1-specific cytotoxic T lympho-cyte response in healthy, long-term nonprogressing seropositive persons. AIDS Res. Hum. Retroviruses10:S77–S78.
10. Ho, D. D., A. U. Neumann, A. S. Perelson, W. Chen, J. M. Leonard, and M. Markowitz.1995. Rapid turnover of plasma virions and CD4 lymphocytes in HIV-1 infection. Nature373:123–126.
11. Holmes, E. C., L. Q. Zhang, P. Simmonds, C. A. Ludlam, and A. J. Leigh-Brown.1992. Convergent and divergent sequence evolution in the surface envelope glycoprotein of human immunodeficiency virus type 1 infection: low viral RNA copy numbers in serum and maintenance of high HIV-1 p24-specific, but not V3-specific antibody levels. J. Infect. Dis.171:811–821. 12. Keet, I. P., P. Krijnen, M. Koot, J. M. Lange, F. Miedema, J. Goudsmit, and R. A. Coutinho.1993. Predictors of rapid progression to AIDS in HIV-1 seroconverters. AIDS7:51–57.
13. Lamers, S. L., J. W. Sleasman, J. X. She, K. A. Barrie, S. M. Pomeroy, D. J. Barrett, and M. M. Goodenow.1993. Independent variation and positive selection in Env V1 and V2 domains within maternal-infant strains of human immunodeficiency virus type 1 in vivo. J. Virol.67:3951–3960.
14. Lamers, S. L., J. W. Sleasman, J. X. She, K. A. Barrie, S. M. Pomeroy, D. J. Barrett, and M. M. Goodenow.1994. Persistence of multiple maternal ge-notypes of human immunodeficiency virus type I in infants infected by vertical transmission. J. Clin. Invest.93:380–390.
15. Lukashov, V. V., C. L. Kuiken, and J. Goudsmit.1995. Intrahost human immunodeficiency virus type 1 evolution is related to length of the immu-nocompetent period. J. Virol.69:6911–6916.
16. Mayers, D. L., A. J. Japour, J. M. Arduino, S. M. Hammer, R. Reichman, K. F. Wagner, R. Chung, J. Lane, C. S. Crumpacker, G. X. McLeod, L. A. Beckett, C. R. Roberts, D. Winslow, D. Burke, and The RV43 Study Group. 1994. Dideoxynucleoside resistance emerges with prolonged zidovudine monotherapy. Antimicrob. Agents Chemother.38:307–314.
17. McNeary, T., Z. Hornickova, R. Markham, A. Birdwell, M. Arens, A. Saah, and L. Ratner.1992. Relationship of human immunodeficiency virus type 1 sequence heterogeneity to stage of disease. Proc. Natl. Acad. Sci. USA 89:10247–10251.
18. Meyerhans, A., R. Cheynier, J. Albert, M. Seth, S. Kwok, J. Sninsky, M. L. Morfeldt, B. Asjo, and S. Wain-Hobson.1989. Temporal fluctuations in HIV quasispecies in vivo are not reflected by sequential HIV isolations. Cell 58:901–910.
19. Michael, N. L., K. E. Davis, L. D. Loomis-Price, T. C. VanCott, D. S. Burke, R. R. Redfield, and D. L. Birx.1996. V3 seroreactivity and sequence varia-tion: tracking the emergence of V3 genotypic variation in HIV-1 infected patients. AIDS10:121–129.
20. Michael, N. L., M. Vahey, D. S. Burke, and R. R. Redfield.1992. Viral DNA and mRNA expression correlate with the stage of human immunodeficiency virus (HIV) type 1 infection in humans: evidence for viral replication in all stages of HIV disease. J. Virol.66:310–316.
21. Myers, G., B. Hahn, J. W. Mellors, L. E. Henderson, B. Korber, K. T. Jeang, F. E. McCutchan, and G. N. Pavlakis.1995. Human retroviruses and AIDS. Los Alamos National Laboratory, Los Alamos, N.Mex.
22. Nei, M., and T. Gojobori.1986. Simple methods estimating the numbers of synonymous and nonsynonymous nucleotide substitutions. Mol. Biol. Evol. 3:418–426.
23. Nowak, M. A., R. M. Anderson, A. R. McLean, T. F. Wolfs, J. Goudsmit, and R. M. May.1991. Antigenic diversity thresholds and the development of AIDS. Science254:963–969.
24. Pang, S., Y. Shlesinger, E. S. Daar, T. Moudgil, D. D. Ho, and I. S. Y. Chen. 1992. Rapid generation of sequence variation during primary HIV-1 infec-tion. AIDS6:453–460.
25. Pantaleo, G., S. Menzo, M. Vaccarezza, C. Graziozi, O. J. Cohen, J. F. Demarest, D. Montefiori, J. M. Orenstein, C. Fox, L. K. Schrager, J. B.
on November 9, 2019 by guest
http://jvi.asm.org/
Margolick, S. Buchbinder, J. V. Giorgi, and A. S. Fauci.1995. Studies in subjects with long-term nonprogressive human immunodeficiency virus in-fection. N. Engl. J. Med.332:209–216.
26. Perelson, A. S., A. U. Neumann, M. Markowitz, J. M. Leonard, and D. D. Ho. 1996. HIV-1 dynamics in vivo: virion clearance rate, infected cell life-span, and viral generation time. Science271:1582–1586.
27. Ratner, L., W. Haseltine, R. Patarca, K. J. Livak, B. Starcich, S. F. Josephs, E. R. Doran, J. A. Rafalski, E. A. Whitehorn, K. Baumeister, L. Ivanoff, S. R. Petteway, M. L. Pearson, J. A. Lautenberger, T. S. Papas, J. Ghrayeb, N. T. Change, R. C. Gallo, and F. Wong-Staal.1985. Complete nucleotide se-quence of the AIDS virus, HTLV-III. Nature313:277–284.
28. Rinaldo, C., X. L. Huang, Z. F. Fan, M. Ding, L. Beltz, A. Logar, D. Panicali, G. Mazzara, J. Liebmann, M. Cottrill, and P. Gupta.1995. High levels of anti-human immunodeficiency virus type 1 (HIV-1) memory cytotoxic T-lymphocyte activity and low viral load are associated with lack of disease in HIV-1-infected long-term nonprogressors. J. Virol.69:5838–5842. 29. Roos, M. T., F. Miedema, M. Koot, M. Tersmette, W. P. Schaasberg, R. A.
Coutinho, and P. T. Schellekens.1995. T cell function in vitro is an inde-pendent progression marker for AIDS in human immunodeficiency virus-infected asymptomatic subjects. J. Infect. Dis.171:531–536.
30. Schwartz, D., U. Sharma, M. Busch, K. Weinhold, T. Matthews, J. Lieber-man, D. Birx, H. Farzedagen, J. Margolick, T. Quinn, B. Davis, O. Bagasra, R. Pomerantz, and R. Viscidi.1994. Absence of recoverable infectious virus and unique immune responses in an asymptomatic HIV1long-term survi-vor. AIDS Res. Hum. Retroviruses10:1703–1711.
31. Sheppard, H. W., M. S. Ascher, B. McRae, R. E. Anderson, W. Lang, and J. P. Allain.1991. The initial immune response to HIV and immune system activation determine the outcome of HIV disease. J. Acquired Immun. Defic. Syndr.4:704–712.
32. Simmonds, P., L. Q. Zhang, F. McOmish, P. Balfe, C. A. Ludlam, and A. J. Leigh-Brown.1991. Discontinuous sequence change of human
immunode-ficiency virus (HIV) type 1envsequences in plasma viral and lymphocyte-associated proviral populations in vivo: implications for models of HIV pathogenesis. J. Virol.65:6266–6276.
33. Smith, S., R. Overbeek, C. Woese, W. Gilbert, and P. Gillevet.1994. The genetic data environment: an expandable GUI for multiple sequence anal-ysis. Comput. Appl. Biol. Sci.10:671–675.
34. Starcich, B. R., B. H. Hahn, G. M. Shaw, P. D. McNeely, S. Modrow, H. Wolf, E. S. Parks, W. P. Parks, S. F. Josephs, R. C. Gallo, and F. Wong-Staal.1986. Identification and characterization of conserved and variable regions in the envelope gene of HTLV-IIILAV, the retrovirus of AIDS. Cell45:637–648. 35. Vahey, M. T., and M. T. Wong.1995. Quantitative liquid hybridization PCR method employing storage phosphor technology, p. 313–338.InC. W. Dief-fenbach and G. S. Dveksler (ed.), PCR primer: a laboratory manual. Cold Spring Harbor Laboratory Press, Plainview, N.Y.
36. Wain-Hobson, S.1993. Viral burden and AIDS. Nature366:22.
37. Wei, X., S. K. Ghosh, M. E. Taylor, V. A. Johnson, E. A. Emini, P. Deutsch, J. D. Lifson, S. Bonhoeffer, M. A. Nowak, B. H. Hahn, M. S. Saag, and G. M. Shaw.1995. Viral dynamics in human immunodeficiency virus type 1 infec-tion. Nature373:117–122.
38. Wolinsky, S. M., B. T. M. Korber, A. U. Neumann, M. Daniels, K. J. Kunstman, A. J. Whetsell, M. R. Furtado, Y. Cao, D. D. Ho, J. T. Safrit, and R. A. Koup.1996. Adaptive evolution of human immunodeficiency virus-type 1 during the natural course of infection. Science272:537–542.
39. Wolinsky, S. M., C. M. Wike, B. T. Korber, C. Hutto, W. P. Parks, L. L. Rosenblum, K. J. Kunstman, M. R. Furtado, and J. L. Munoz.1992. Selec-tive transmission of human immunodeficiency virus type-1 variants from mothers to infants. Science255:1134–1137.
40. Zhu, T., H. Mo, N. Wang, D. S. Nam, Y. Cao, R. A. Koup, and D. D. Ho.1993. Genotypic and phenotypic characterization of HIV-1 in patients with pri-mary infection. Science261:1179–1181.