R E S E A R C H A R T I C L E
Open Access
Effect of training-sample size and classification
difficulty on the accuracy of genomic predictors
Vlad Popovici
1, Weijie Chen
2, Brandon G Gallas
2, Christos Hatzis
3, Weiwei Shi
4, Frank W Samuelson
2, Yuri Nikolsky
4,
Marina Tsyganova
5, Alex Ishkin
5, Tatiana Nikolskaya
4,5, Kenneth R Hess
6, Vicente Valero
7, Daniel Booser
7,
Mauro Delorenzi
1,8, Gabriel N Hortobagyi
7, Leming Shi
9, W Fraser Symmans
10, Lajos Pusztai
7*Abstract
Introduction:As part of the MicroArray Quality Control (MAQC)-II project, this analysis examines how the choice of univariate feature-selection methods and classification algorithms may influence the performance of genomic predictors under varying degrees of prediction difficulty represented by three clinically relevant endpoints. Methods:We used gene-expression data from 230 breast cancers (grouped into training and independent validation sets), and we examined 40 predictors (five univariate feature-selection methods combined with eight different classifiers) for each of the three endpoints. Their classification performance was estimated on the training set by using two different resampling methods and compared with the accuracy observed in the independent validation set.
Results:A ranking of the three classification problems was obtained, and the performance of 120 models was estimated and assessed on an independent validation set. The bootstrapping estimates were closer to the validation performance than were the cross-validation estimates. The required sample size for each endpoint was estimated, and both gene-level and pathway-level analyses were performed on the obtained models.
Conclusions:We showed that genomic predictor accuracy is determined largely by an interplay between sample size and classification difficulty. Variations on univariate feature-selection methods and choice of classification algorithm have only a modest impact on predictor performance, and several statistically equally good predictors can be developed for any given classification problem.
Introduction
Gene-expression profiling with microarrays represents a novel tissue analytic tool that has been applied success-fully to cancer classification, and the first generation of genomic prognostic signatures for breast cancer is already on the market [1-3]. So far, most of the pub-lished literature has addressed relatively simple classifi-cation problems, including separation of cancer from normal tissue, distinguishing between different types of cancers, or sorting cancers into good or bad prognoses [4]. The transcriptional differences between these condi-tions or disease states are often large compared with transcriptional variability within the groups, and there-fore, reasonably successful classification is possible. The
methodologic limitations and performance characteris-tics of gene expression based classifiers have not been examined systematically when applied to increasingly challenging classification problems in real clinical data sets.
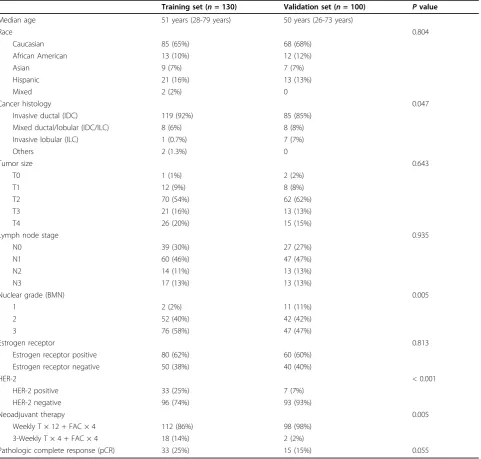
The MicroArray Quality Control (MAQC) (MAQC Consortium project-II: a comprehensive study of com-mon practices for the development and validation of microarray-based predictive models) breast cancer data set (Table 1) offers a unique opportunity to study the performance of genomic classifiers when applied across a range of classification difficulties.
One of the most important discoveries in breast can-cer research in recent years has been the realization that estrogen receptor (ER)-positive and -negative breast can-cers represent molecularly distinct diseases with large differences in gene-expression patterns [5,6]. Therefore, * Correspondence: [email protected]
7Department of Breast Medical Oncology, P.O. Box 301439, Houston, TX
77230-1439, USA
gene expression-based prediction of ER status represents an easy classification problem.
A somewhat more difficult problem is to predict extreme chemotherapy sensitivity, including all breast cancers in the analysis. This classification problem is facilitated by the association between clinical disease characteristics and chemotherapy sensitivity. For exam-ple, ER-negative cancers are more chemotherapy sensi-tive than are ER-posisensi-tive tumors [7].
A third, and more difficult, classification problem is to predict disease outcome in clinically and molecularly
homogeneous patient populations. Genomic predictors could have the greatest clinical impact here, because tra-ditional clinical variables alone are only weakly discrimi-natory of outcome in these populations. In the current data set, prediction of chemotherapy sensitivity among the ER-negative cancers represents such a challenge.
The goal of this analysis was to assess how the degree of classification difficulty may affect which ele-ments of prediction methods perform better. We divided the data into a training set (n = 130) and a
[image:2.595.59.541.100.559.2]validation set (n = 100) and developed a series of
Table 1 Patient characteristics in the training and validation sets
Training set (n= 130) Validation set (n= 100) Pvalue
Median age 51 years (28-79 years) 50 years (26-73 years)
Race 0.804
Caucasian 85 (65%) 68 (68%)
African American 13 (10%) 12 (12%)
Asian 9 (7%) 7 (7%)
Hispanic 21 (16%) 13 (13%)
Mixed 2 (2%) 0
Cancer histology 0.047
Invasive ductal (IDC) 119 (92%) 85 (85%)
Mixed ductal/lobular (IDC/ILC) 8 (6%) 8 (8%)
Invasive lobular (ILC) 1 (0.7%) 7 (7%)
Others 2 (1.3%) 0
Tumor size 0.643
T0 1 (1%) 2 (2%)
T1 12 (9%) 8 (8%)
T2 70 (54%) 62 (62%)
T3 21 (16%) 13 (13%)
T4 26 (20%) 15 (15%)
Lymph node stage 0.935
N0 39 (30%) 27 (27%)
N1 60 (46%) 47 (47%)
N2 14 (11%) 13 (13%)
N3 17 (13%) 13 (13%)
Nuclear grade (BMN) 0.005
1 2 (2%) 11 (11%)
2 52 (40%) 42 (42%)
3 76 (58%) 47 (47%)
Estrogen receptor 0.813
Estrogen receptor positive 80 (62%) 60 (60%)
Estrogen receptor negative 50 (38%) 40 (40%)
HER-2 < 0.001
HER-2 positive 33 (25%) 7 (7%)
HER-2 negative 96 (74%) 93 (93%)
Neoadjuvant therapy 0.005
Weekly T × 12 + FAC × 4 112 (86%) 98 (98%)
3-Weekly T × 4 + FAC × 4 18 (14%) 2 (2%)
Pathologic complete response (pCR) 33 (25%) 15 (15%) 0.055
Estrogen receptor: cases in which more than 10% of tumor cells stained positive for ER with immunohistochemistry (IHC) were considered positive. HER-2: cases that showed either 3+ IHC staining or had gene copy number greater than 2.0 were considered HER-2“positive.”T = paclitaxel; FAC = 5-fluorouracil, doxorubicin, and cyclophosphamide. ThePvalues for the association tests were obtained from ac2
classifiers to predict (a) ER status, (b) pathologic com-plete response (pCR) to preoperative chemotherapy for all breast cancers, and (c) pCR for ER-negative breast cancers. A predictor, or classifier, in this article is defined as a set of informative features (generated by a particular feature-selection method) and a trained dis-crimination rule (produced by applying a particular classification algorithm).
First, we examined whether the success of a predictor was influenced by a feature-selection method. We exam-ined five different univariate feature-selection methods including three variations of a ttest-based ranking and two methods that order features based on differences in expression values. It has been shown that several differ-ent classification algorithms can yield predictors with rather similar performance metrics [8-10]. However, it remains unknown whether the relative performances of different methods may vary depending on the difficulty of the prediction problem. We examined this question for eight different classifiers representing a broad range of algorithms, including linear (LDA), diagonal linear (DLDA), and quadratic discriminant analysis (QDA); logistic regression (LREG); and two versions of support-vector machines (SVM) and k-nearest neighbor (KNN) methods. Altogether, 40 different predictors were devel-oped for each of the three classification problems (five different feature-selection methods × eight different classifiers). We also were interested determine to what extent the cross-validation classification performance is influenced by different data-resampling methods and the difficulty of the classification problem. We estimated the classification performance by using 10-times-repeated fivefold cross validation (10 × 5-CV) and leave-pair-out (LPO) bootstrapping [11] (a method that better accounts for training and testing variability). We calculated per-formance metrics for each of the 120 predictors (40 pre-dictors × three endpoints) and compared the estimated accuracy in the training set with the observed accuracy in the independent validation set.
Materials and methods
Patients and materials
Gene-expression data from 230 stage I to III breast cancers, without individual patient identifiers, were provided to the MAQC project by the University of Texas M.D. Anderson Cancer Center (MDACC) Breast Cancer Pharmacogenomic Program. Gene-expression results were generated from fine-needle aspiration spe-cimens of newly diagnosed breast cancers before any therapy. The biopsy specimens were collected sequen-tially during a prospective pharmacogenomic marker discovery study approved by the institutional review board between 2000 and 2008. These specimens
represent 70% to 90% pure neoplastic cells with mini-mal stromini-mal contamination [12]. All patients signed informed consent for genomic analysis of their cancers. Patients received 6 months of preoperative (neoadju-vant) chemotherapy including paclitaxel, 5-fluorouracil, cyclophosphamide, and doxorubicin, followed by surgi-cal resection of the cancer. Response to preoperative chemotherapy was categorized as a pathologic com-plete response (pCR = no residual invasive cancer in the breast or lymph nodes) or residual invasive cancer (RD). The prognostic value of pCR has been discussed extensively in the medical literature [13]. Genomic analyses of subsets of this sequentially accrued patient population were reported previously [9,14,15]. For each endpoint, we used the first 130 cases as a training set to develop prediction models, and the next 100 cases were set aside as independent validation set. Table 1 and Additional file 1 show patient and sample charac-teristics in the two data sets.
Gene-expression profiling
Needle-aspiration specimens of the cancer were placed
into RNAlater™ solution (Qiagen, Germantown, MD,
USA) and stored at -80°C until further analysis. RNA extraction and gene-expression profiling were per-formed in multiple batches over time, as described pre-viously [16,17] by using Affymetrix U133A (Affymetrix, Santa Clara, CA, USA) microarrays. Gene-expression data have been uploaded to the Gene Expression Omni-bus website under the accession number GSE16716. Normalization was performed by using MAS 5.0 soft-ware (Affymetrix, Santa Clara, CA, USA) with default settings. Quality-control assessment of the hybridization results were performed with SimpleAffy software by Bioconductor; the percentage present call had to be more than 30%, scaling factor less than 3, and the 3’/5’ ratios forb-actin less than 3, and for GAPDH, less than 1.3. These quality-control metrics are presented for each case in Additional file 2.
Ranking of classification problems by informative feature utility score
To assess the relative difficulty of the three classification problems that we selected to study, we adopted an approach similar to that described in [18]. This method defines the utility of a featureias its Fisher score,
f i i
i i
i= −
+
( )
,
1 2 2
12 22
whereμ1iandμ2i are the class means, ands1i ands2i
respectively. If features are orderedf1 ≥f2 ≥... then, for each endpoint, the cumulative information is defined as
Fj fi
i j N =
= ≤
∑
1 ,where N is the sample size. This cumulative informa-tion score assumes that the features are independent and that their effect on the classification performance is additive. This is rarely the case, as features are often correlated. Nonetheless, this cumulative information score is a simple and straightforward approach to esti-mate the relative difficulty of a classification problem early in the classifier-development process: an easier problem tends to have larger values forF than does a more difficult problem.
Feature-selection methods
No prefiltering of probe sets was done; all probe sets were considered by the feature-ranking methods that included (a) unequal variancettest (FS1); (b) unequal variancet test with filtering of probe sets that were correlated with one another (Pearson correlation > 0.75) to generate inde-pendently informative features (FS2); (c) instead of remov-ing the correlated features, they were combined into meta-features by averaging them (FS3); and (d) we also ranked features according to their ratio of between- to within-group sum of squares (FS4) and (e) according to the abso-lute differences in the class means (FS5).
Classification algorithms
We examined eight classifiers in combination with the previously mentioned feature-selection methods, includ-ing linear discriminant analysis (LDA), diagonal linear discriminant analysis (DLDA), quadratic discriminant analysis (QDA), logistic regression (LREG), two k near-est neighbors classifiers with k = 3 (KNN3) and k = 11 (KNN11), and support vector machines with a radial basis function kernel with two different values for the kernel parameter: g= 0.5 (SVM05) andg= 2.0 (SVM2), respectively. Overall, 40 models were developed for each of the three prediction problems.
Estimation of predictive performance
Leave-N-out cross-validation and other resampling methods of the training set are often used to select a final predictor for independent validation. Therefore, it is important to understand how resampling-based pre-dictive performance correlates with prepre-dictive perfor-mance on independent validation cases. To study this question, we used a nested two-level cross-validation scheme, in which the cross-validation in the outer loop had the role of estimating the performance of the whole
modeling procedure, whereas the cross-validation in the inner loop was used for selecting the optimal number of features [19].
The procedure in the inner loop is as follows. For each combination of a feature-selection method F and a classification algorithm C, the number of features j (F, C) in the model was considered as a free-parameter (within a predefined set of allowable values) and was optimized. In the inner loop, a repeated (5 times), stra-tified (to preserve the proportion of the two classes in all training and testing splits), fivefold cross-validation was used to define the number of features that maxi-mized the AUC. A ranking of the features was first obtained by applyingF on the reduced internal train-ing set (obtained by leavtrain-ing aside one fold from the current training set). Then the classifierC was trained on the same set, but considering only the top j(F, C) features. The predictions on the internal testing set (the left-out fold) were recorded, and the procedure was repeated. At the end, an estimation of the AUC was obtained, corresponding to the given combination of F, C, and j(F, C). The procedure was repeated with different folds, and an average estimate of the AUC was obtained for each F, C, and j(F, C). The optimal number of features j*(F, C) was selected as the value j (F, C) yielding the highest average AUC. The number
of features allowed for each model was chosen a
priori, to avoid overfitting of models and to limit the computation time. For the prediction of ER status, the feature size was chosen to contain all values between 2 and 15, whereas for both pCR endpoints, it was {2,5,8,...,41}; 41 being almost half the size of the smal-lest training set (n = 85 ER-negative cancer). For a pseudo-code that details the schema used for cross-validation [see Additional file 3]. To avoid adding variability due to random partitioning the data into folds, all estimates were obtained on the same splits of the data.
We investigated two methods in the outer loop. The first method is a stratified 10-times-repeated fivefold validation (10 × 5-CV). In each of the five cross-validation iterations, 80% of the data were first used as input to the inner loop procedure for feature selection and training the classifier with the selected features, and finally, the remaining 20% of the data were used to test the classifier. The 95% CI for the area under the receiver operating characteristics curve (AUC) was approximated by [AUC - 1.96 SEM, AUC + 1.96 SEM]. The SEM was estimated by averaging the 10 estimates of the standard error of the mean obtained from the five different estimates of the AUC produced by the 5-CV.
cross-validation [20]. Efron and Tibshirani [20] proposed the leave-one-out bootstrap method on the performance metric error rate, and their technique was recently extended by Yousef and colleagues [11] to the perfor-mance metric AUC. This method uses a leave-pair-out (LPO) bootstrap approach to estimate the mean AUC
(mean over training sets) and a “delta method after
bootstrap” to estimate the variability of the estimated mean AUC. We point out that this variability captures both the effect of finite training-set size and the effect of finite testing-set size. In the LPO approach, multiple (n= 5,000) training sets are obtained by stratified boot-strap resampling, and each training set is used as input to the inner-loop procedure for feature selection and training the classifier with the selected features. In test-ing, any pair of cases (one from the positive class and one from the negative class) is tested on the classifiers trained on the bootstrap samples that do not contain the two held-out cases. The Wilcoxon-Mann-Whitney statistic of the prediction results on pairs of cases is averaged over all bootstrap-training sets and is used to estimate the mean AUC. An advantage of this technique is that it allows estimating the variability of the AUC estimator by using the influence function method [11,20]. By assuming that the estimated AUC is asymp-totically normal, the 95% CI of the AUC can be approxi-mated by [AUC - 1.96 SEM; AUC + 1.96 SEM].
The estimated performance and the associated CIs from the training and internal-assessment process are compared with the independent validation performance. The conditional validation performance was obtained by selecting features and training the classifier with the training data set and testing on the validation data set. This performance is conditional on the particular finite training set and may vary when the training set varies. Therefore, we estimated the mean of this conditional performance where the mean is over multiple training sets and obtained by bootstrapping the training set mul-tiple times and averaging the conditional AUCs, as tested on the validation set [21].
We also estimated the variability of the conditional validation performance and decomposed the variance into two components: the variability due to the finite size of the training set and the variability due to the finite size of the test set [21]. The training variability reflects the stability of the classifier performance when the training set varies, and the testing variability reflects the expected performance variation for different test sets.
To compare the ability of the performance estimates of 10 × 5-CV and the LPO bootstrap to predict the per-formance on the independent set, we used a root mean square error (RMSE) measure, which is defined as
RMSE AF Cernal AF C independent C
F
= −
=
=
∑
∑
1 40
2
1 8
1 5
( int, , ) ,
where FandC index feature selection and classifier, respectively, A denotes the mean AUC; the superscript “internal”can be“10 × 5-CV”or“LPO bootstrap.”
Estimation of predictor learning over increasing training-set size
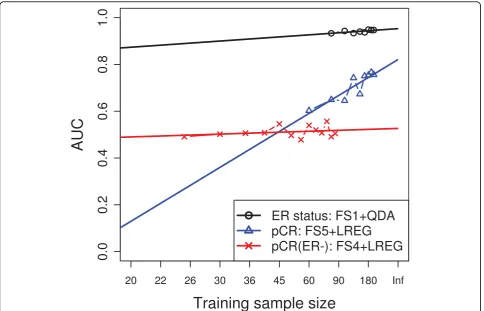
Predictor learning was evaluated for the models that performed nominally the best in independent valida-tion for each of the three predicvalida-tion problems. All 230 cases were included in the analysis to fit learning curves to these three models. For the ER-status end-point, 10 different training-sample sizes, ranging from
n = 60 to n = 220 by increments of 20, were used to
estimate the dependence of the performance para-meters on the sample size. For each sample size, 10 different random samples were drawn from the full set by stratified sampling, and fivefold cross-validation was used to assess the error rate and AUC of the models where all the parameters of the models were recalcu-lated. A similar approach was taken for the pCR (n= 50, 70, ..., 210) and “pCR in ER-negative cancer” pre-dictors (n = 25, 40, ..., 85). By following the work of Fukunaga [22], the following learning-curve model was fit to the resulting AUC:Y=a+b/TrainingSize.
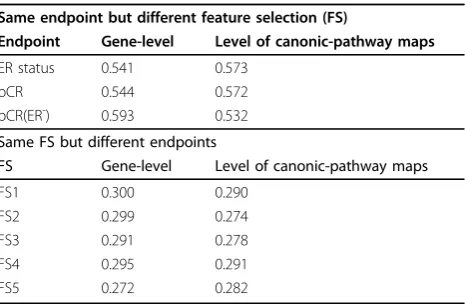
Congruence of different predictors at gene and functional pathway level
We were interested in examining the congruence of informative features that were selected by different methods for the same prediction endpoint and also for different endpoints. Both gene-level and pathway-level analyses were performed as described previously [23]. MetaCore protein-function classification was used to group genes into protein functions, and GeneGo Path-way maps were used for functional classification of predictive features. We assessed congruency by using the kappa statistics. The input for kappa involves“ lear-ners” that classify a set of objects into categories. We considered each feature-selection method as a learner and each probe set as an object. The probe sets used in this analysis are presented in Additional file 4. Each probe set from the rank-ordered lists is categorized by each feature-selection method either as 1 (that is, selected as informative) or 0 (that is, nonselected). By using such an 0/1 matrix for all probe sets × all fea-ture-selection methods for every prediction endpoint
as input, we can calculate Cohen’s kappa function
hypergeometric enrichment analysis. The pathways are
ranked by enrichment P values, and the top n
path-ways (n equals the number of genes in the input list for comparison and consistency between the two levels) were selected for presentation.
All statistical analysis was performed by using R software.
Results
Difficulty of the classification problems
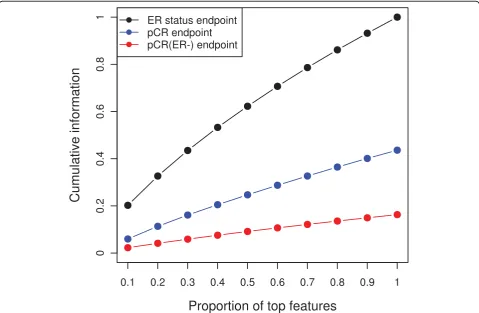
Three distinct classification problems were studied: (a) ER-status prediction, including 80 ER-positive (62%) and 50 ER-negative training cases (38%); (b) pCR prediction, including 33 cases with pCR (25%) and 97 cases with residual cancer (75%) for training; and (c) pCR prediction for ER-negative cancers, including 27 training cases with pCR (54%) and 23 with residual cancer (46%). Figure 1 shows the cumulative information scores for the three endpoints: larger cumulative information is an indicator for a simpler classification problem. The obtained rank-ing implies that the three endpoints represent different degrees of classification difficulty.
We also assessed the significance of the utility scores by using permutation tests (10,000 permutations) for com-puting the rawPvalues, followed by Benjamini-Hochberg correction for multiple testing. For the ER-status end-point, 1,502 features with significant utility scores (P value < 0.0001) were used, whereas for the pCR (all cases), 252 significant features and only five features (cor-responding to A2M [HGNC:7], RNMT [HGNC:10075], KIAA0460 [HGNC:29039], AHNAK [HGNC:347], and ACSM1 [HGNC:18049] genes) were used for pCR among ER-negative cancers.
[image:6.595.58.538.369.682.2]Effect of feature-selection methods and classification algorithms on cross-validation performance
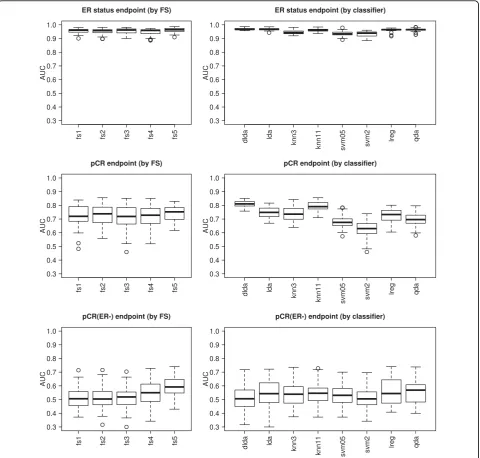
Figure 2 illustrates the average cross-validation AUC estimated by 10 × 5-CV for all predictors, stratified by feature-selection method (left column). All feature-selec-tion methods performed similarly in combinafeature-selec-tion with various classification algorithms for a given endpoint.
The two non-t test-based methods, FS4 and FS5,
showed slightly better performances than did t test-based feature selection for the most difficult prediction
endpoint “pCR on ER-negative cancers”in cross valida-tion, but confidence intervals widely overlapped. Addi-tional file 5 shows the average error rates and AUCs generated from 10 × 5-CV for each prediction model applied to all three classification problems, along with the average number of features selected. Interestingly, the number of selected features did not increase as the prediction problem became more difficult. For the most difficult problem, the number of selected features was lower than that for the moderately difficult problem. This is probably because of the lack of informative fea-tures: as the classification problem becomes more diffi-cult, fewer features are informative for the outcome (also see Figure 1).
Figure 2 also shows the variability of the classification error rates and AUC estimated through 10 × 5-CV for all predictors, stratified by classification algorithm (right column). All methods performed similarly. The predic-tion endpoint (that is, classificapredic-tion difficulty) had the greatest effect on the cross-validation AUC. The effects of feature-selection method and choice of classifier algo-rithm were modest.
Bootstrap and independent-validation results
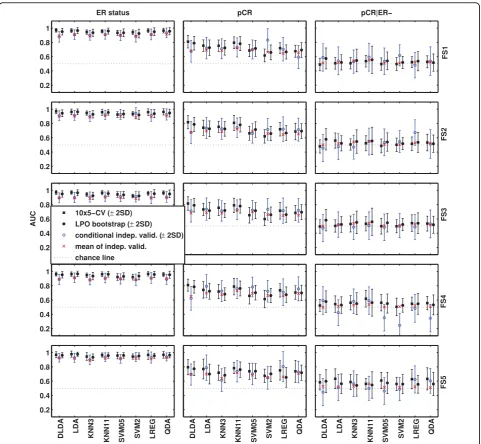
Figure 3 shows the estimated AUCs obtained with 10 × 5-CV (black square), LPO bootstrap (black circle), and the conditional AUC (blue circle) on the independent validation set and its variability (blue error bar repre-senting ± 2 SD) and mean (red cross). Additional file 5 includes the internal (10 × 5-CV and LPO bootstrap) and independent validation-performance metrics for each predictor. Both internal-estimation methods yielded AUCs that were very close, well within 2 stan-dard deviations of the mean, to the conditional and mean AUCs observed in the independent validation. Internal-performance estimates generated within the training set only slightly overestimated the performance relative to independent validation, indicating both that the modeling approach was correct and that no strong batch effect occurred between training and validation sets. Simpler linear methods, such as LREG, LDA, and DLDA, performed generally well in both internal and independent validation, and these methods were among the top five nominally best-performing models for all prediction endpoints [see Additional file 5]. The non-t test-based feature-selection methods (FS4, FS5) that showed good results in cross validation also performed well in independent validation and were included in four of the top five models for each endpoint. However, the 95% CIs of the point estimates overlap broadly for all predictors, and no single strategy emerged as clearly superior for any particular endpoint.
To assess the confidence-interval estimation, we calcu-lated the RMSE for the AUC estimates obtained with 10
× 5-CV and LPO bootstrap for all the three endpoints. Leave-pair-out bootstrap performed better than 10 × 5-CV in terms of the agreement with the mean AUC esti-mated in the independent-validation set: RMSEs for LPO bootstrap were 0.0484, 0.0491, and 0.357 in com-parison with 0.0562, 0.0713, and 0.449 for 10 × 5-CV for the ER status, pCR, and pCR within ER-negative endpoints, respectively.
Figure 3 clearly shows that the variability of the esti-mated classification performance increases as the level of classification difficulty increases. This implies that, to achieve the same level of statistical precision of the estimated performance, more cases are needed for a more-difficult endpoint. Figure 3 also shows both the conditional (blue circle) and mean validation AUCs (red cross). The larger the difference between the con-ditional validation AUC and the mean validation AUC, the less stable the predictor is with respect to varying the training sets. A quantitative measure of classifier stability is the training variability, and we have decom-posed the variability of the conditional validation AUC shown in Figure 3 into two components (training variability and testing variability) and put the results in Additional file 5.
Predictor-performance and sample-size estimations through learning curves
estimation of the learning curve or that limited informa-tion in the mRNA space exists to predict this particular outcome with the methods applied in this analysis. The learning curve that had a slope significantly different
from 0 was the one for the pCR endpoint (P = 0.001;
ER endpoint,P = 0.05; pCR in ER-negative endpoint,P = 0.365).
Functional analysis of predictive features
Our results demonstrate that several different feature sets can yield predictors with statistically similar
[image:8.595.59.540.89.547.2]five different ranking methods (Table 2). The selected gene sets and pathways were also rather similar to each other for the ER and pCR prediction endpoints. How-ever, the genes and pathways predictive of pCR in ER-negative cancers were very different from the other two informative gene sets.
Additional file 6 contains the pathway-enrichment tables for the three endpoints, including pathways with enrichmentPvalues < 0.1. Thirty-two pathways contrib-uted to the prediction of ER status; 36, to pCR predic-tion; and 11, to pCR prediction within ER-negative
cancers across the five feature-selection methods. For the ER endpoint, development, cell adhesion, cytoskele-ton remodeling, DNA damage, apoptosis, and ER tran-scription factor activity were the most significant pathway elements common to all informative feature sets. We also noted that most pathways that were involved in pCR prediction (31 of 36) were the same as those involved in ER-status prediction. This is consis-tent with the known association between pCR rate and ER status [7]. Estrogen receptor-negative cancers had significantly higher pCR rates than ER-positive cancers 0.2
0.4 0.6 0.8 1
ER status
0.2 0.4 0.6 0.8 1
0.2 0.4 0.6 0.8 1
AUC
0.2 0.4 0.6 0.8 1
0.2 0.4 0.6 0.8 1
DLDA LDA KNN3
KNN11 SVM05 SVM2 LREG
QDA
pCR
DLDA LDA KNN3
KNN11 SVM05 SVM2 LREG
QDA
FS1
pCR|ER−
FS2
FS3
FS4
DLDA LDA KNN3
KNN11 SVM05 SVM2 LREG
QDA
FS5
10x5−CV (± 2SD)
LPO bootstrap (± 2SD)
conditional indep. valid. (± 2SD)
mean of indep. valid.
[image:9.595.58.540.87.531.2]chance line
(54% pCR in ER-negative cancers versus 7.5% pCR in ER-positive cancers; c2 testP value = 1.068e-08). The pathways that were selected for prediction of pCR in ER-negative cancers were distinct from the pathways that were predictive of pCR in all patients and included immune response-related pathways (IL-2 and T-helper cell activation), opioid-receptor signaling, and endothe-lial cell-related pathways.
Discussion
The goal of this analysis was to examine how the choice of a univariate feature-selection method and classifica-tion algorithm may influence the performance of predic-tors under varying degrees of classification difficulty. We examined the influence of changing two critical components, feature selection and classification algo-rithm in the predictor development process, for three different prediction problems that represented three levels of difficulty in a clinically annotated human breast cancer data set. Classification of breast cancer into ER-positive or -negative categories is an easy classification problem; the large number of informative probe sets
[image:10.595.57.542.88.399.2]more-complex classifiers (in the sense of an implemen-table decision boundary) could have improved predictive performance. We examined only the radial function ker-nel for SVM with twoa prioriset kernel parametersg= 0.5 and 2.0, and the parameter C (cost of misclassifica-tion) was also fixed at 10. Fixing these parameters may have resulted in “less than optimally trained” models that could lead to added variability in the performance of the classifiers. Also, we examined only two versions of KNN with a priorisetkof 3 and 11, and found that
KNN11 outperformed KNN3. Low values of k yield
local classifiers with low bias but high variance, whereas higher values led to more-global classifiers with higher bias and lower variance; exploring a broader range ofk values could have optimized prediction results. Optimiz-ing the parameters gor kis not a straightforward task. It should be done within the inner cross-validation pro-cess, just as is done with feature selection. Fine tuning different model parameters outside of the two-stage cross-validation process would lead to model-selection bias, or optimization bias [19].
An interesting observation was that simple feature-selection methods that ranked features based on difference in means performed very well in both cross-validation and independent validation relative to
the more commonly used t statistic-based ranking.
Four of the top five models for each prediction pro-blem used features selected by the non-ttest-based methods. However, it is important to recognize that all of the feature-selection methods that we examined represented univariate filtering approaches that rank features individually and independent of the classifica-tion method. It is possible that nonparametric or multivariate feature-selection methods could yield dif-ferent results. Penalized feature-selection methods,
[image:11.595.58.291.109.261.2]which embed feature selection in the classifier fitting step, may also have advantages, because features that might not be discriminatory individually could be jointly predictive in combination with other features. At least one article suggested that multivariate sparse penalized likelihood methods, including lasso and elastic net, might have a slight edge compared with univariate filtering [26]. Other publications that com-pared several univariate and multivariate feature-selection methods in public cancer data sets by using 10-fold cross-validation estimates found that simple univariate feature-selection methods often outper-formed more-complex multivariate approaches [27,28].
Our data demonstrate that many different feature sets and classification methods can yield similarly accurate predictors for a given endpoint. When we mapped the feature sets generated by five different univariate fea-ture-selection methods to biologic pathways, each method tended to identify similar genes and pathways. The biologic pathways that were implicated in ER-status or pCR prediction were distinct from the pathways that were predictive of pCR in ER-negative cancers. This pathway-level analysis is hypothesis generating and will require further laboratory validation to determine the importance of the identified pathways (for example, immune response, endothelial-cell regulation, G-protein signaling) in the biology of chemotherapy response in ER-negative breast cancer.
To estimate potential improvements in predictive per-formance of the nominally best predictors for each clas-sification problem, we pooled all cases and carried out a series of split-sample training and validation analyses in which the predictors were trained on increasingly larger data sets. For the easy classification problem (ER-status), relatively small sample sizes (80 to 100 samples) were enough for constructing excellent predictors. In con-trast, for the moderately difficult problem (pCR predic-tion), the accuracy of the model steadily improved as the sample size increased. For the most difficult pro-blem, pCR prediction in ER-negative cancer, a minimal improvement was observed over a range of 25 to 85 training cases. It is important to note that the pCR and ER status predictors trained on 80 cases showed good or excellent conditional AUCs (0.65 and 0.94, respec-tively). This modest performance and limited improve-ment of the pCR predictor for ER-negative cancer may be due to (a) too small sample size for trainig or (b) the incompletness of the mRNA expression-based feature space, meaning that this class-separation problem can-not be fully accomplished by using information only from the available probes by using the methods that we applied. However, fitting learning curves to preliminary data sets could assisst investigators in estimating Table 2 Congruencies across different endpoints and
different feature-selection methods
Same endpoint but different feature selection (FS)
Endpoint Gene-level Level of canonic-pathway maps
ER status 0.541 0.573
pCR 0.544 0.572
pCR(ER-) 0.593 0.532
Same FS but different endpoints
FS Gene-level Level of canonic-pathway maps
FS1 0.300 0.290
FS2 0.299 0.274
FS3 0.291 0.278
FS4 0.295 0.291
FS5 0.272 0.282
sample-size requirements for a particular prediction pro-blem for any given model.
Conclusions
This analysis confirms that it is possible to build multi-gene classifiers of clinical outcome that hold up in inde-pendent validation. Predictor performance is determined largely by an interplay between training-sample size and classification difficulty. Variations on univariate feature-selection methods and choice of classification algorithm had only a modest impact on predictor performance, and it is clear that within our statistical precision, sev-eral equally good predictors can be developed for each of our classification problems. Pathway-level analysis of informative features selected by different methods revealed a high level of congruency. This indicates that similar biologic pathways were identified as informative for a given prediction endpoint by the different univari-ate feature-selection methods. The independent valida-tion results also showed that internal 10 × 5-CV and LPO bootstrap both yielded reasonably good and only slightly optimistic performance estimates for all the endpoints.
Additional file 1: Supplemental Table S1. Clinical data for all the patients in the training and validation sets.
Click here for file
[ http://www.biomedcentral.com/content/supplementary/bcr2468-S1.xls ]
Additional file 2: Supplemental Table S2. Quality control results. Click here for file
[ http://www.biomedcentral.com/content/supplementary/bcr2468-S2.xls ]
Additional file 3: Supplemental Table S3. Pathways mapping for all endpoints.
Click here for file
[ http://www.biomedcentral.com/content/supplementary/bcr2468-S3.xls ]
Additional file 4: Supplemental methods. Pseudo-code description of the two-level external cross-validation scheme.
Click here for file
[ http://www.biomedcentral.com/content/supplementary/bcr2468-S4.pdf ]
Additional file 5: Supplemental Table S4. Features (probesets) selected in the 120 models.
Click here for file
[ http://www.biomedcentral.com/content/supplementary/bcr2468-S5.xls ]
Additional file 6: Supplemental Table S5. Estimated and validation performance of all models.
Click here for file
[ http://www.biomedcentral.com/content/supplementary/bcr2468-S6.xls ]
Abbreviations
10 × 5-CV: repeated (10 times) fivefold cross validation; AUC: area under the receiver operating characteristic curve; CI: confidence interval; DLDA: diagonal linear discriminant analysis; ER: estrogen receptor; KNN: k nearest-neighbors classifier; LDA: linear discriminant analysis; LPO: leave-pair-out bootstrap; LREG: logistic regression classifier; pCR: pathologic complete response; QDA: quadratic discriminant analysis; RD: residual invasive cancer; RMSE: root mean square error; SD: standard deviation; SEM: standard error of the mean; SVM: support vector machine.
Acknowledgements
This research was supported by grants from the NCI R-01 program (LP), The Breast Cancer Research Foundation (LP and WFS), The MD Anderson Cancer Center Faculty Incentive Funds (WFS), and the Commonwealth Cancer Fundation (LP, WFS). VP and MD acknowledge the support of the Swiss National Science Foundation NCCR Molecular Oncology. Certain commercial materials and equipment are identified to specify experimental procedures adequately. In no case does such identification imply recommendation or endorsement by the FDA, nor does it imply that the items identified are necessarily the best available for the purpose. The views presented in this article do not necessarily reflect those of the U.S. Food and Drug Administration.
Author details
1Bioinformatics Core Facility, Swiss Institute of Bioinformatics, Génopode
Building, Quartier Sorge, Lausanne CH-1015, Switzerland.2Center for Devices and Radiological Health, US Food and Drug Administration, 10903 New Hampshire Ave WO62-3124, Silver Springs, MD 20993-0002, USA.3Nuvera Biosciences, 400 West Cummings Park, Woburn, MA 01801, USA.4GeneGo, Inc., 500 Renaissance Drive, St. Joseph, MI 49085, USA.5Department of Systems Biology, Vavilov Institute for General Genetics, Russian Academy of Sciences, Gubkina str. 3 korp. 1, Moscow 119333, Russia.6Department of Biostatistics, P.O. Box 301439, Houston, TX 77230-1439, USA.7Department of Breast Medical Oncology, P.O. Box 301439, Houston, TX 77230-1439, USA. 8Swiss NCCR Molecular Oncology, Swiss Institute for Experimental Cancer
Research (ISREC), School of Life Sciences, Ecole Polytechnique Fédérale de Lausanne, Lausanne CH-1015, Switzerland.9National Center for Toxicological Research, US Food and Drug Administration, Jefferson, AR 72079, USA. 10Department of Pathology of the University of Texas M. D. Anderson Cancer
Center, P.O. Box 301439, Houston, TX 77230-1439, USA.
Authors’contributions
LP, VP, and LS designed the study. VP, WFS, and WC performed the experiments. VP, WC, BG, CH, WS, FS, YN, MT, AI, TN, KH, MD, and LP performed the statistical analyses and interpreted the results. VV, DB, GH, WFS, and LP contributed the clinical, pathologic, and molecular data. All authors contributed to the writing of the manuscript and read and approved the manuscript.
Competing interests
The authors declare that they have no competing interests.
Received: 14 October 2009 Revised: 18 December 2009 Accepted: 11 January 2010 Published: 11 January 2010
References
1. Vijver van de MJ, He YD, van’t Veer LJ, Dai H, Hart AAM, Voskuil DW, Schreiber GJ, Peterse JL, Roberts C, Marton MJ, Parrish M, Atsma D, Witteveen A, Glas A, Delahaye L, Velde van der T, Bartelink H, Rodenhuis S, Rutgers ET, Friend SH, Bernards R:A gene-expression signature as a predictor of survival in breast cancer.N Engl J Med2002,347:1999-2009. 2. Paik S, Shak S, Tang G, Kim C, Baker J, Cronin M, Baehner FL, Walker MG,
Watson D, Park T, Hiller W, Fisher ER, Wickerham DL, Bryant J, Wolmark N:A multigene assay to predict recurrence of tamoxifen-treated, node-negative breast cancer.N Engl J Med2004,351:2817-2826.
3. Ross JS, Hatzis C, Symmans WF, Pusztai L, Hortobágyi GN:Commercialized multigene predictors of clinical outcome for breast cancer.Oncologist
2008,13:477-493.
4. Dudoit S, Fridlyand J, Speed TP:Comparison of discrimination methods for the classification of tumors using gene expression data.J Am Statist Assoc2002,97:77-87.
5. Perou CM, Sørlie T, Eisen MB, Rijn van de M, Jeffrey SS, Rees CA, Pollack JR, Ross DT, Johnsen H, Akslen LA, Fluge O, Pergamenschikov A, Williams C, Zhu SX, Lønning PE, Børresen-Dale AL, Brown PO, Botstein D:Molecular portraits of human breast tumours.Nature2000,406:747-752.
between estrogen-negative and estrogen-positive tumors.Clin Cancer Res2003,9:2406-2415.
7. Andre F, Mazouni C, Liedtke C, Kau S-W, Frye D, Green M, Gonzalez-Angulo AM, Symmans WF, Hortobagyi GN, Pusztai L:HER2 expression and efficacy of preoperative paclitaxel/FAC chemotherapy in breast cancer. Breast Cancer Res Treat2008,108:183-190.
8. Ein-Dor L, Kela I, Getz G, Givol D, Domany E:Outcome signature genes in breast cancer: is there a unique set?.Bioinformatics2005,21:171-178. 9. Hess KR, Anderson K, Symmans WF, Valero V, Ibrahim N, Mejia JA, Booser D,
Theriault RL, Buzdar AU, Dempsey PJ, Rouzier R, Sneige N, Ross JS, Vidaurre T, Gómez HL, Hortobagyi GN, Pusztai L:Pharmacogenomic predictor of sensitivity to preoperative chemotherapy with paclitaxel and fluorouracil, doxorubicin, and cyclophosphamide in breast cancer.J Clin Oncol2006,24:4236-4244.
10. Boutros PC, Lau SK, Pintilie M, Liu N, Shepherd FA, Der SD, Tsao M-S, Penn LZ, Jurisica I:Prognostic gene signatures for non-small-cell lung cancer.Proc Natl Acad Sci USA2009,106:2824-2828.
11. Yousef WA, Wagner RF, Loew MH:Estimating the uncertainty in the estimated mean area under the ROC curve of a classifier.Pattern Recog Lett2005,26:2600-2610.
12. Symmans WF, Ayers M, Clark EA, Stec J, Hess KR, Sneige N, Buchholz TA, Krishnamurthy S, Ibrahim NK, Buzdar AU, Theriault RL, Rosales MFM, Thomas ES, Gwyn KM, Green MC, Syed AR, Hortobagyi GN, Pusztai L:Total RNA yield and microarray gene expression profiles from fine-needle aspiration biopsy and core-needle biopsy samples of breast carcinoma. Cancer2003,97:2960-2971.
13. Liedtke C, Mazouni C, Hess KR, André F, Tordai A, Mejia JA, Symmans WF, Gonzalez-Angulo AM, Hennessy B, Green M, Cristofanilli M, Hortobagyi GN, Pusztai L:Response to neoadjuvant therapy and long-term survival in patients with triple-negative breast cancer.J Clin Oncol2008,
26:1275-1281.
14. Ayers M, Symmans WF, Stec J, Damokosh AI, Clark E, Hess K, Lecocke M, Metivier J, Booser D, Ibrahim N, Valero V, Royce M, Arun B, Whitman G, Ross J, Sneige N, Hortobagyi GN, Pusztai L:Gene expression profiles predict complete pathologic response to neoadjuvant paclitaxel and fluorouracil, doxorubicin, and cyclophosphamide chemotherapy in breast cancer.J Clin Oncol2004,22:2284-2293.
15. Peintinger F, Anderson K, Mazouni C, Kuerer HM, Hatzis C, Lin F, Hortobagyi GN, Symmans WF, Pusztai L:Thirty-gene pharmacogenomic test correlates with residual cancer burden after preoperative chemotherapy for breast cancer.Clin Cancer Res2007,13:4078-4082. 16. Stec J, Wang J, Coombes K, Ayers M, Hoersch S, Gold DL, Ross JS, Hess KR,
Tirrell S, Linette G, Hortobagyi GN, Symmans WF, Pusztai L:Comparison of the predictive accuracy of DNA array-based multigene classifiers across cDNA arrays and Affymetrix genechips.J Mol Diagn2005,7:357-367. 17. Rouzier R, Perou CM, Symmans WF, Ibrahim N, Cristofanilli M, Anderson K,
Hess KR, Stec J, Ayers M, Wagner P, Morandi P, Fan C, Rabiul I, Ross JS, Hortobagyi GN, Pusztai L:Breast cancer molecular subtypes respond differently to preoperative chemotherapy.Clin Cancer Res2005,
11:5678-5685.
18. Ho TK, Basu M:Complexity measures of supervised classification problems.IEEE Trans Patt Anal Mach Intel2002,24:289-300.
19. Wood IA, Visscher PM, Mengersen KL:Classification based upon gene expression data: bias and precision of error rates.Bioinformatics2007,
23:1363-1370.
20. Efron B, Tibshirani R:Improvements on cross-validation: the 632+ bootstrap method.J Am Statist Assoc1997,92:548-560. 21. Yousef WA, Wagner RF, Loew MH:Assessing classifiers from two
independent data sets using ROC analysis: a nonparametric approach. IEEE Trans Patt Anal Mach Intel2006,28:1809-1817.
22. Fukunaga K, Hayes RR:Effects of sample size in classifier design.IEEE Trans Patt Anal Mach Intel1989,11:873-885.
23. Huang DW, Sherman BT, Tan Q, Collins JR, Alvord WG, Roayaei J, Stephens R, Baseler MW, Lane HC, Lempicki RA:The DAVID gene functional classification tool: a novel biological module-centric algorithm to functionally analyze large gene lists.Genome Biol2007,8:R183. 24. Fan C, Oh DS, Wessels L, Weigelt B, Nuyten DSA, Nobel AB, van’t Veer LJ,
Perou CM:Concordance among gene-expression-based predictors for breast cancer.N Engl J Med2006,355:560-569.
25. Wirapati P, Sotiriou C, Kunkel S, Farmer P, Pradervand S, Haibe-Kains B, Desmedt C, Ignatiadis M, Sengstag T, Schütz F, Goldstein DR, Piccart M,
Delorenzi M:Meta-analysis of gene expression profiles in breast cancer: toward a unified understanding of breast cancer subtyping and prognosis signatures.Breast Cancer Res2008,10:R65.
26. Zucknick M, Richardson S, Stronach EA:Comparing the characteristics of gene expression profiles derived by univariate and multivariate classification methods.Stat Appl Genet Mol Biol2008,7:Article7.
27. Lai C, Reinders MJT, van’t Veer LJ, Wessels LFA:A comparison of univariate and multivariate gene selection techniques for classification of cancer datasets.BMC Bioinformatics2006,7:235.
28. Lecocke M, Hess KR:An empirical study of univariate and genetic algorithm-based feature selection in binary classification with microarray data.Cancer Inform2007,2:313-327.
doi:10.1186/bcr2468
Cite this article as:Popoviciet al.:Effect of training-sample size and classification difficulty on the accuracy of genomic predictors.Breast Cancer Research201012:R5.
Submit your next manuscript to BioMed Central and take full advantage of:
• Convenient online submission
• Thorough peer review
• No space constraints or color figure charges
• Immediate publication on acceptance
• Inclusion in PubMed, CAS, Scopus and Google Scholar
• Research which is freely available for redistribution