R E S E A R C H
Open Access
A deep learning model for real-time
mortality prediction in critically ill children
Soo Yeon Kim
1†, Saehoon Kim
2†, Joongbum Cho
3, Young Suh Kim
1, In Suk Sol
1, Youngchul Sung
2, Inhyeok Cho
2,
Minseop Park
2, Haerin Jang
1, Yoon Hee Kim
1, Kyung Won Kim
1*and Myung Hyun Sohn
1Abstract
Background:The rapid development in big data analytics and the data-rich environment of intensive care units together provide unprecedented opportunities for medical breakthroughs in the field of critical care. We developed and validated a machine learning-based model, the Pediatric Risk of Mortality Prediction Tool (PROMPT), for real-time prediction of all-cause mortality in pediatric intensive care units.
Methods:Utilizing two separate retrospective observational cohorts, we conducted model development and validation using a machine learning algorithm with a convolutional neural network. The development cohort comprised 1445 pediatric patients with 1977 medical encounters admitted to intensive care units from January 2011 to December 2017 at Severance Hospital (Seoul, Korea). The validation cohort included 278 patients with 364 medical encounters admitted to the pediatric intensive care unit from January 2016 to November 2017 at Samsung Medical Center.
Results:Using seven vital signs, along with patient age and body weight on intensive care unit admission, PROMPT achieved an area under the receiver operating characteristic curve in the range of 0.89–0.97 for mortality prediction 6 to 60 h prior to death. Our results demonstrated that PROMPT provided high sensitivity with specificity and outperformed the conventional severity scoring system, the Pediatric Index of Mortality, in predictive ability. Model performance was indistinguishable between the development and validation cohorts.
Conclusions:PROMPT is a deep model-based, data-driven early warning score tool that can predict mortality in critically ill children and may be useful for the timely identification of deteriorating patients.
Keywords:Machine learning, Mortality, Intensive care units, pediatric, Prognosis, Risk assessment
Background
Hospitalized children, particularly those in high-acuity environments such as the pediatric intensive care unit (PICU), are inevitably susceptible to clinical deterioration. Several outcome prediction models such as the Pediatric Index of Mortality (PIM) and the Pediatric Risk of Mortal-ity (PRISM) are widely used in PICUs [1, 2]. However, these acuity scores are based on “snapshot” values gath-ered during the early period following PICU admission. These static scores fail to adapt with the patient’s clinical
progression and offer little assistance for the management of individual patients [3,4].
Previous studies demonstrating that acute deterioration in patients is often preceded by subtle changes in physio-logical parameters [5,6] led to the development of the Early Warning Score (EWS) [7]. Accurate and generalizable risk stratification tools may contribute to the timely identifica-tion of high-risk patients and facilitate earlier clinical inter-vention leading to improved patient outcomes [8]. Since its introduction, the EWS has undergone many alterations, and its modified forms are widely used in general hospitals today [9, 10]. However, the primary target population is usually confined to relatively healthy patients in general wards [9, 11] or emergency department settings [12] and may not be applicable to intensive care settings [13].
© The Author(s). 2019Open AccessThis article is distributed under the terms of the Creative Commons Attribution 4.0 International License (http://creativecommons.org/licenses/by/4.0/), which permits unrestricted use, distribution, and reproduction in any medium, provided you give appropriate credit to the original author(s) and the source, provide a link to the Creative Commons license, and indicate if changes were made. The Creative Commons Public Domain Dedication waiver (http://creativecommons.org/publicdomain/zero/1.0/) applies to the data made available in this article, unless otherwise stated.
* Correspondence:[email protected]
†Soo Yeon Kim and Saehoon Kim contributed equally to this work.
1
Department of Pediatrics, Severance Children’s Hospital, Institute of Allergy, Institute for Immunology and Immunological Diseases, Brain Korea 21 PLUS Project for Medical Science, Yonsei University College of Medicine, 50-1 Yonsei-ro, Seodaemun-gu, Seoul 03722, South Korea
Current literature frequently calls for the development of diverse intensive care warning scores [14–16]. The rapid development in machine learning, coupled with the rich-ness of data from extensive patient monitoring in the intensive care unit (ICU), provides unprecedented oppor-tunities for the development of new prediction scores in the field of critical care [17–19]. Challenges in the analytics of PICU data, including pathologic diversity and complex-ity [20] and the wide range of age and developmental stages, are anticipated to be addressed by the implementa-tion of innovative predictive modeling [18,21].
Curtis et al. developed a cardiac arrest prediction model by time series trend analysis using a support vector ma-chine algorithm that achieved excellent performance [22]. In addition, Zhengping et al. adopted Gradient Boosting Trees to learn an interpretable model, which demonstrated strong performance for the prediction of mortality and ventilator-free days in the PICU [23]. Despite their success-ful application of data-driven analytics, the above studies were limited by the lack of external validation. To allow practical application in a real-world setting, the preliminary results would require further refinement regarding data elements, extraction, processing, and operation with acceptable false alarms.
In this paper, we describe the development and evalu-ation of a new tool, the Pediatric Risk of Mortality Predic-tion Tool (PROMPT), for real-time mortality predicPredic-tion in PICUs. We also assessed PROMPT’s suitability for practical application in the clinical care of critically ill children.
Methods
Study population and data sources
We used data from the electronic health records (EHRs) of all patients under 19 years old admitted to the medical ICU at Severance Hospital (Seoul, Korea) between January 2011 and December 2017. The primary cohort contained 1445 patients with 1977 ICU admissions. For external validation, we used a separate dataset provided by Samsung Medical Center (Seoul, Korea) containing data on 278 patients with 364 PICU admissions from January 2016 to November 2017. Details on these data-sets are presented in Additional file1: Table S1. All data were anonymized, and a waiver was obtained from the Institutional Review Board of each hospital (#4-2017-0060 and #2019-09015-001, respectively).
Feature selection and data processing
The extracted data contained sets of static features, such as demographic and clinical information, and temporal features such as time-stamped vital signs. To construct a mortality prediction tool, we adopted two descriptive features—age and weight—and seven vital signs: systolic blood pressure (SBP), diastolic blood pressure (DBP), mean blood pressure (MBP), heart rate (HR), respiratory
rate (RR), peripheral capillary oxygen saturation (SpO2), and body temperature (BT). We selected vital signs as objective predictor variables because they are routinely and frequently collected from all patients regardless of clinical situation and the values are rarely affected by the examiner. Most vital signs of ICU patients are automat-ically measured by monitoring devices at minimum once an hour, and the values are recorded on the EHR.
The following cleaning process ensured that the EHR data was ready for analysis and did not contain errors. Non-numeric values were removed. In addition, a set of defined ranges of physiologically possible values for selected variables were used to eliminate outliers (Additional file 1: Table S2). Carry-forward/carry-back-ward methods were employed for imputations. In case of multiple measurements within an hour, the most extreme values were used. Policy-based preprocessing was automated and resulted in an average coverage of 96.1% of all data with an accuracy of 97.5% compared to manual corrections. Finally, for modeling, each variable was standardized to fit an isotropic Gaussian distribution.
Machine learning
The primary outcome was all-cause mortality in the ICU. For this binary outcome, we extracted positive instances from all cases who died in ICU and negative instances from all cases who survived (Additional file 1: Figure S1). The 24-h window of vital signs up to 6 to 60 h prior to death was extracted as a positive instance, and 24-h window of vital signs randomly chosen from during ICU stay of the survivor was assigned as a negative instance. For simplicity, only a single instance was selected from each encounter, and both sampled positive and negative instances were designated to be similar in their mean lengths to avoid possible biases (Additional file1: Table S3).
development cohort was adopted to validate PROMPT’s performance, and external validation was followed to assess its generalizability.
Statistical analysis
We compared the performance of PROMPT with other standard machine learning algorithms, such as Gradient Boosting Decision Trees (GBDT) [29], Long Short-Term Memory (LSTM) [30], and the Pediatric Index of Mor-tality 3 (PIM 3), which is currently widely used in PICUs [1]. Model performance was assessed based on discrim-ination using the area under the receiver operating char-acteristic curve (AUROC), one of the most commonly used metrics, and the area under the precision-recall curve (AUPRC), which, because the outcome of interest was mortality, was calculated considering a skewed large domain of true negatives [31]. Sensitivity, specificity, positive predicted value (PPV), negative predicted value (NPV), and accuracy were also evaluated for all predic-tion tools assessed in this study.
Results
Dataset statistics
As shown from the descriptive statistics for each cohort (Additional file 1: Table S1), the development cohort consisted of 1977 patient encounters, in which 303 cases of mortality (15.3%) were identified. The validation co-hort showed 9.6% mortality. Significant differences were noted between the two datasets in terms of age, PIM 3, mortality, length of ICU stay, and inclusion period.
Mortality prediction performance
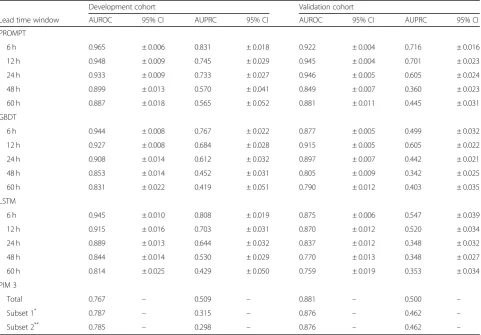
[image:3.595.58.540.363.698.2]The performance metrics of PROMPT on mortality prediction compared to other standard machine learning algorithms and PIM 3 are summarized in Table 1. The best performance was achieved for predicting mortality 6 h prior to death (AUROC 0.965, AUPRC 0.831) with a slight decrease, although still high-performance, as the time window increased to 60 h prior to death. In detecting mor-tality 60 h in advance, PROMPT (AUROC 0.887, AUPRC 0.565) consistently outperformed GBDT (AUROC 0.831, AUPRC 0.419), LSTM (AUROC 0.814, AUPRC 0.429), and
Table 1Summary of model mortality detection performance
Development cohort Validation cohort
Lead time window AUROC 95% CI AUPRC 95% CI AUROC 95% CI AUPRC 95% CI
PROMPT
6 h 0.965 ± 0.006 0.831 ± 0.018 0.922 ± 0.004 0.716 ± 0.016
12 h 0.948 ± 0.009 0.745 ± 0.029 0.945 ± 0.004 0.701 ± 0.023
24 h 0.933 ± 0.009 0.733 ± 0.027 0.946 ± 0.005 0.605 ± 0.024
48 h 0.899 ± 0.013 0.570 ± 0.041 0.849 ± 0.007 0.360 ± 0.023
60 h 0.887 ± 0.018 0.565 ± 0.052 0.881 ± 0.011 0.445 ± 0.031
GBDT
6 h 0.944 ± 0.008 0.767 ± 0.022 0.877 ± 0.005 0.499 ± 0.032
12 h 0.927 ± 0.008 0.684 ± 0.028 0.915 ± 0.005 0.605 ± 0.022
24 h 0.908 ± 0.014 0.612 ± 0.032 0.897 ± 0.007 0.442 ± 0.021
48 h 0.853 ± 0.014 0.452 ± 0.031 0.805 ± 0.009 0.342 ± 0.025
60 h 0.831 ± 0.022 0.419 ± 0.051 0.790 ± 0.012 0.403 ± 0.035
LSTM
6 h 0.945 ± 0.010 0.808 ± 0.019 0.875 ± 0.006 0.547 ± 0.039
12 h 0.915 ± 0.016 0.703 ± 0.031 0.870 ± 0.012 0.520 ± 0.034
24 h 0.889 ± 0.013 0.644 ± 0.032 0.837 ± 0.012 0.348 ± 0.032
48 h 0.844 ± 0.014 0.530 ± 0.029 0.770 ± 0.013 0.348 ± 0.027
60 h 0.814 ± 0.025 0.429 ± 0.050 0.759 ± 0.019 0.353 ± 0.034
PIM 3
Total 0.767 – 0.509 – 0.881 – 0.500 –
Subset 1* 0.787
– 0.315 – 0.876 – 0.462 –
Subset 2** 0.785
– 0.298 – 0.876 – 0.462 –
AUROCarea under the receiver operating characteristic curve,CIconfidence interval,AUPRCarea under the precision-recall curve,PROMPTpediatric risk of mortality prediction tool,GBDTGradient Boosting Decision Trees,LSTMLong Short-Term Memory,PIM 3Pediatric Index of Mortality 3
*
Subset of the cohort with data of at least 48 h
**
PIM 3 (AUROC 0.785, AUPRC 0.298) in the development cohort (Table 1), also shown in the micro-averaged per-formance comparisons (Additional file1: Figure S2). Similar results were found on external validation (Table1).
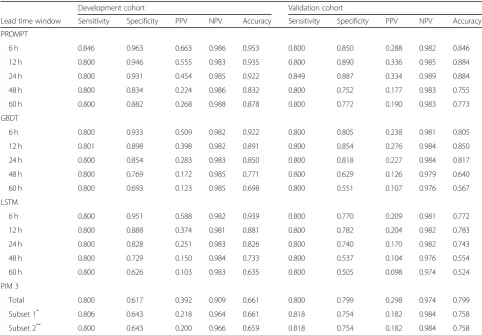
Additional paired comparison metrics at a sensitivity of 0.8 for specificity, PPV, NPV, and accuracy for each model are presented in Table2. Within the development cohort, PROMPT identified 80% of patients who were to die in 24 h, yielded 7% false alarms (specificity = 0.931), and was the most consistently accurate of all metrics. Comparison of sensitivity according to the number of false alarms showed that PROMPT provided fewer false alarms than existing models, including PIM 3, in both cohorts (Additional file1: Figure S3).
Visualization of prediction trajectory
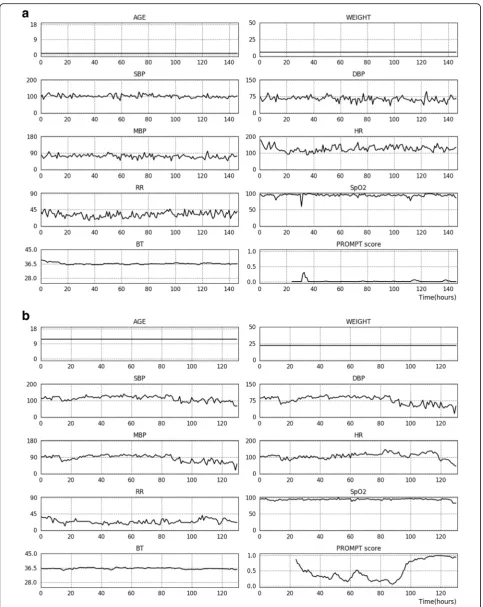
PROMPT produced an averaged mortality risk score over multiple prediction models trained from development cohorts to predict mortality in the preceding 6, 12, 24, 48, and 60 h (examples are presented in Fig.1). Wheretis the current time point, the input data composed of two
descriptive features and vital signs in a range of [t−24, t] transformed to an averaged risk score. The same procedure was repeated at thet+ 1 time points to generate prediction trajectory. A sliding window (0 to 24 h) moved hour-by-hour through the time series to generate predicted mortal-ity for each time point during the ICU stay.
Designation of time and feature contributions
[image:4.595.56.539.362.697.2]An interpretation module that quantitatively measured the contribution of time series features for mortality was developed. Every time-stamped vital sign was substituted for an age-dependent mean value and, following changes in predicted mortality, produced quantitative contribu-tions of each feature (%). In addition, algebraic manipu-lation demonstrated that the contribution of each time point was captured by the importance of six blocks in mak-ing a prediction. This is because a temporal relationship is lost due to pooling operations. Accordingly, 24 h data was grouped by six blocks for which the contribution to the prediction was computed. An average filter was then ap-plied for smoothing the signal. Figure2depicts illustrative
Table 2Comparison of model’s accuracy for mortality prediction
Development cohort Validation cohort
Lead time window Sensitivity Specificity PPV NPV Accuracy Sensitivity Specificity PPV NPV Accuracy
PROMPT
6 h 0.846 0.963 0.663 0.986 0.953 0.800 0.850 0.288 0.982 0.846
12 h 0.800 0.946 0.555 0.983 0.935 0.800 0.890 0.336 0.985 0.884
24 h 0.800 0.931 0.454 0.985 0.922 0.849 0.887 0.334 0.989 0.884
48 h 0.800 0.834 0.224 0.986 0.832 0.800 0.752 0.177 0.983 0.755
60 h 0.800 0.882 0.268 0.988 0.878 0.800 0.772 0.190 0.983 0.773
GBDT
6 h 0.800 0.933 0.509 0.982 0.922 0.800 0.805 0.238 0.981 0.805
12 h 0.801 0.898 0.398 0.982 0.891 0.800 0.854 0.276 0.984 0.850
24 h 0.800 0.854 0.283 0.983 0.850 0.800 0.818 0.227 0.984 0.817
48 h 0.800 0.769 0.172 0.985 0.771 0.800 0.629 0.126 0.979 0.640
60 h 0.800 0.693 0.123 0.985 0.698 0.800 0.551 0.107 0.976 0.567
LSTM
6 h 0.800 0.951 0.588 0.982 0.939 0.800 0.770 0.209 0.981 0.772
12 h 0.800 0.888 0.374 0.981 0.881 0.800 0.782 0.204 0.982 0.783
24 h 0.800 0.828 0.251 0.983 0.826 0.800 0.740 0.170 0.982 0.743
48 h 0.800 0.729 0.150 0.984 0.733 0.800 0.537 0.104 0.976 0.554
60 h 0.800 0.626 0.103 0.983 0.635 0.800 0.505 0.098 0.974 0.524
PIM 3
Total 0.800 0.617 0.392 0.909 0.661 0.800 0.799 0.298 0.974 0.799
Subset 1* 0.806 0.643 0.218 0.964 0.661 0.818 0.754 0.182 0.984 0.758
Subset 2** 0.800 0.643 0.200 0.966 0.659 0.818 0.754 0.182 0.984 0.758
PPVpositive predictive value,NPVnegative predictive value,PROMPTpediatric risk of mortality prediction tool,GBDTGradient Boosting Decision Trees,LSTMLong Short-Term Memory,PIM 3Pediatric Index of Mortality 3
*
Subset of the cohort with data of at least 48 h
**
examples of a deceased case showing the measured contri-bution of each time point and those of features at the most critical time point, as well as the linear trend of vital signs for 24 h.
Interpretability of PROMPT
Individual feature importance was plotted by computing a sensitivity heat map on a total of 363 test instances in the development cohort to measure the importance of individ-ual input variables (Additional file 1: Figure S4). The sensitivity was defined as the derivative of the predicted mortality according to the input variables, and the relative importance of input variables was normalized to satisfy the
sum-to-one constraint. RR showed the highest relative im-portance among all other features, followed by SBP and HR. Individual Conditional Expectation plots are shown in Additional file1: Figure S5. These six plots show the test instances in the development cohort. The predicted mortality probability was computed by creating variants of each input variable while keeping all other features as it is. For blood pressures, predicted mortality tends to increase when pressure values are too low or too high, and it de-clines as the feature value falls within the physiological range. A similar trend was observed in other vital signs, such as HR, RR, and BT. In SpO2, predicted mortality tends to decrease as the degree of saturation increases to 100%. However, several instances were identified with a (See figure on previous page.)
Fig. 1Prediction trajectory using PROMPT. Serial trends of recorded vital signs during ICU stay and hourly calculated predicted mortality rate using PROMPT shown for patients from the validation cohort who survived (a) and died (b), respectively. Predicted mortality was averaged over multiple prediction models trained from development cohort using the dataset to predict mortality in the precedingkhours (wherek= 6, 12, 24, 48, and 60). SBP, systolic blood pressure; DBP, diastolic blood pressure; MBP, mean blood pressure; HR, heart rate; RR, respiratory rate; SpO2,
peripheral capillary oxygen saturation; BT, body temperature; ICU, intensive care unit
Fig. 2Depiction of time and feature contributions for mortality using PROMPT. Measured contribution (%) for mortality at the critical time point and serial trend of vital signs over 24 h are plotted on each panel. The last sub-figure presents the time contribution. The height of the graph represents the level of importance, and the positive/negative conversion distinguishes the time point contributed to make positive or negative predictions for mortality. In the presented case, the critical time point (i.e., a peak of time contribution) was about 10 h, of which fluctuations in SpO2, blood pressure,
[image:6.595.57.540.347.661.2]high mortality probability despite a high SpO2, due to the correlation between the features.
Discussion
In this study, we developed and validated a targeted real-time early warning score, PROMPT, based on a CNN algorithm using a PICU dataset with routine vital signs. Utilizing a handful of variables, PROMPT achieved high performance with high sensitivity and specificity for pre-dicting mortality in PICU patients. In predictive ability, it outperformed the conventional severity scoring system, PIM 3, as well as other models that use GBDT and LSTM.
Existing risk prediction tools in ICU use static physio-logical parameters from early in the course of critical illness (often within the first 24 h following admission), along with other components, such as age and diagnosis, to assess severity and risk of death for the purpose of predicting outcomes [32]. For pediatric populations, PIM and PRISM are the most representative [1,2]. How-ever, it is generally agreed that they are poor surrogates for risk stratification and should not be used as the basis for individual treatment decisions [4,33,34]. Generic se-verity scores were originally developed and calibrated to maximize the capacity for mortality risk assessment for populations of interest, and not for clinical decision-making concerning individuals within those populations [4]. Moreover, utilizing the poorest values within a fixed time window, regardless of the outcome of interventions, fails to reflect the dynamic clinical course including differential treatment responses. Thus, these systems are unable to distinguish which patients are at higher risk of developing specific acute conditions. In our study, this was demonstrated by the notably low discriminative ability of PIM 3 in mortality prediction.
Predictive analytics on time series monitoring data were introduced [35, 36] based on evidence that physio-logic signatures preceded acute deterioration of patients prior to the arousal of clinical suspicion [5,6,37]. Wide-spread adoption of EHRs which could be queried in real time enabled the development of EWS with the ability to identify clinically deteriorating patients in need of intervention [8,38]. Accordingly, a wide variety of differ-ent tools now exist and are operated alongside rapid re-sponse teams in different hospital contexts [9, 10, 39]. For instance, the Bedside Pediatric Early Warning Score (PEWS) is used across the UK National Health Service for the detection of patients in wards who are at risk of acute deterioration, facilitating their timely upgrade to higher level care [40, 41]. Similarly, many other EWS systems have been developed and validated primarily on general wards [11,40], and their use has been extended to emergency departments [12, 42] and prehospital settings [43].
The ICU environment, where patients are clinically un-stable and change rapidly between states of improvement and deterioration, calls for meticulous monitoring and clinical support. This has facilitated the development of ICU early warning systems [18, 44,45]. The development of more sophisticated monitoring devices has resulted in an exponential growth in sensor data. This, coupled with re-cent advances in machine learning, artificial intelligence techniques, and data archiving hardware, has facilitated the discovery of data-driven characteristics and patterns of dis-eases [18,36,46–48]. However, the numerous developmen-tal stages, baseline age-related differences in physiologic parameters, and the wide range of underlying pathologic di-versity present unique challenges for the analysis of PICU patient data [20, 21]. Moreover, physiological data of the patient is continuously influenced by clinical interventions such as oxygen supplement, volume resuscitation, and vasopressor use, given that the core principle of intensive care is to maintain the steady state [20]. Because variations in physiological data occur within a complex biological system composed of multiple components that interact together, more sophisticated deep learning models such as neural networks, which automatically learn features, have demonstrated better performance than traditional machine learning [49].
Our study makes several significant contributions to the existing literature on mortality prediction in the PICU set-ting. PROMPT utilized changing vital signs of individuals; employed CNN, a deep model primarily used in image an-alytics; and achieved high accuracy and discriminative ability in predicting mortality. Prediction performance decreased slightly as the time window ahead of the event lengthened from 6 to 60 h, and the performance of this earlier identification was relatively lower in the validation cohort. Nevertheless, PROMPT provided AUROC above 0.88 for predicting mortality 60 h in advance from both cohorts. Moreover, it consistently achieved higher sensi-tivity and specificity compared to other standard machine learning algorithms and PIM 3.
Accuracy and false alarm rate are important issues to consider in the practical implementation of EWS in ICU settings. Because sensitivity and specificity mutually interact, the performance of EWS and alarm fatigue should be weighed and optimized [50]. Notably, PROMPT consistently provided higher specificity than PIM 3 and other algorithms against which it was tested. In addition, PROMPT maintained a higher level of accuracy than other models even with a small number of alarms (Additional file 1: Figure S3).
parameters such as laboratory tests would be expected to enhance PROMPT’s performance. However, we note that models based on continuously updated physiologic moni-toring data are better able to provide timely warning of pending deterioration. Thus, using only the most basic and commonly measured critical care data streamed from the bedside monitor has an advantage for the broader adoption of this model in other ICUs. Relatively minimal data requirements, few manual data entry requirements, and automated operation on data extracted from EHRs save additional labor and cost and may lighten the burden of application in the clinical setting.
This study has several limitations. First, we could not de-termine the generalizability of our results to other popula-tions. In addition, the retrospective study design did not allow the determination of model performance in a pro-spective setting. Our model remains a population-based estimate, as we did not validate its efficacy for individual prognostication in a prospective way. Moreover, despite PROMPT’s high performance in detecting and predicting mortality, this knowledge alone is insufficient to affect pa-tient outcomes. Clinician input is required to determine clinical interventions and shape patient-centered outcomes. However, considering that clinicians in the PICU envir-onment face limited clinical resources and that rationing of health care is a reality in some respects, PROMPT may have the potential to benefit clinical practice. If the risk of critical adverse outcomes is identified earlier, clinicians could allocate staffing and other medical resources with a higher level of certainty. Our model utilizes easily collected data and, therefore, may be particu-larly suitable for bedside prognostications in relatively low-resourced environments.
In addition, because the predictive window of PROMPT is up to 60 h before death, earlier warnings may give physicians more time to intervene and prevent or mitigate mortality. Alternatively, once physicians are alerted and prepared for the likelihood of death, there are opportunities for preference-concordant, high-value care in PICUs by initiating goals of care discussions earl-ier and revising treatment plans. Hence, our future work will focus on the practical impact of early recognition of at-risk patients on clinically relevant outcomes.
Lastly, we would like to stress the additional implica-tions of our model. Although our current model does not tell the clinician precisely how to treat a deteriorat-ing patient, the trajectory of predicted risk and designa-tion for time and feature contribudesigna-tions are expected to provide additional information, indirectly. Changes in the trend of predicted mortality over time, coupled with an event or specific intervention with a patient, may pro-vide clinicians intuitive insight into potential associations with a favorable or unfavorable clinical course in individ-ual cases.
Conclusion
In this two-center retrospective study, we validated an easily implementable deep model-based real-time mor-tality prediction system for critically ill children. Using seven vital signs routinely recorded in standard critical care practice, along with patient age and body weight on ICU admission, our results indicate that PROMPT provides high sensitivity, specificity, and discriminative ability for the prediction of patients at high risk for mortality up to 60 h prior to death. This data-driven early warning score may be an effective tool for the timely recognition of deteriorating patients.
Additional file
Additional file 1:Supplementary figures and tables. (DOCX 980 kb)
Abbreviations
AUPRC:Area under the precision-recall curve; AUROC: Area under the receiver operating characteristic curve; BT: Body temperature; CNN: Convolutional Neural Network; DBP: Diastolic blood pressure; EHR: Electronic health records; EWS: Early Warning Score; GBDT: Gradient Boosting Decision Trees; HR: Heart rate; ICU: Intensive care unit; LSTM: Long Short-Term Memory; MBP: Mean blood pressure; NPV: Negative predicted value; PICU: Pediatric intensive care unit; PIM 3: Pediatric Index of Mortality 3; PPV: Positive predicted value; PRISM: Pediatric Risk of Mortality;
PROMPT: Pediatric Risk of Mortality Prediction Tool; RR: Respiratory rate; SBP: Systolic blood pressure; SpO2: Peripheral capillary oxygen saturation
Acknowledgements
We would like to thank Young Ah Kim (Division of Medical Information and Technology, Yonsei University Health System, Seoul, Korea) for her generous cooperation in data extraction, Jinkyu Yoo (AITRICS, Seoul, Korea) for his contribution in the study design and regular critical discussions and Yu Rang Park (Department of Biomedical Systems Informatics, Yonsei University College of Medicine, Seoul, Korea) for the review and feedback on the manuscript.
Authors’contributions
All authors were involved in the conceptualization and design of the study and the discussion of the results. SYK, KWK, and JC were responsible for acquiring the data. SK, YS, IC, and MP contributed to the analysis of the data and interpretation of the result. SYK and SK wrote the manuscript. YSK, ISS, HJ, YHK, KWK, and MHS revised the article critically for important intellectual content. KWK, as the corresponding author, takes responsibility for the content of the manuscript, including the data and analysis. All authors approved the final manuscript as submitted and agree to be accountable for all aspects of the work.
Funding
K.W.K. was supported by the Institute for Information & Communications Technology Promotion (IITP) grant, funded by the Korea government (MSIT, No. 2017-0-00599, Development of Big Data Analytics Platform for Military Health Information). S.K. was supported by the Institute for Information & Communications Technology Promotion (IITP) grant funded by the Korea government (MSIT, No. 2017-0-01779, A Machine Learning and Statistical In-ference Framework for Explainable Artificial Intelligence).
Availability of data and materials
The data that support the findings of this study are available on request from the corresponding author. The data are not publicly available because they contain information that could compromise research participant privacy.
Ethics approval and consent to participate
Consent for publication Not applicable.
Competing interests
The authors declare that they have no competing interests.
Author details
1Department of Pediatrics, Severance Children’s Hospital, Institute of Allergy, Institute for Immunology and Immunological Diseases, Brain Korea 21 PLUS Project for Medical Science, Yonsei University College of Medicine, 50-1 Yonsei-ro, Seodaemun-gu, Seoul 03722, South Korea.2AITRICS, Seoul, South Korea.3Department of Critical Care Medicine, Samsung Medical Center, Sungkyunkwan University School of Medicine, Seoul, South Korea.
Received: 23 May 2019 Accepted: 7 August 2019
References
1. Straney L, Clements A, Parslow RC, Pearson G, Shann F, Alexander J, Slater A. Paediatric index of mortality 3: an updated model for predicting mortality in pediatric intensive care*. Pediatr Crit Care Med. 2013;14:673–81. 2. Pollack MM, Holubkov R, Funai T, Dean JM, Berger JT, Wessel DL, Meert K,
Berg RA, Newth CJ, Harrison RE, Carcillo J, Dalton H, Shanley T, Jenkins TL, Tamburro R. The pediatric risk of mortality score: update 2015. Pediatr Crit Care Med. 2016;17:2–9.
3. Skrobik Y, Kavanagh BP. Scoring systems for the critically ill: use, misuse and abuse. Can J Anaesth. 2006;53:432–6.
4. Vincent JL, Opal SM, Marshall JC. Ten reasons why we should NOT use severity scores as entry criteria for clinical trials or in our treatment decisions. Crit Care Med. 2010;38:283–7.
5. Berlot G, Pangher A, Petrucci L, Bussani R, Lucangelo U. Anticipating events of in-hospital cardiac arrest. Eur J Emerg Med. 2004;11:24–8.
6. Moss TJ, Lake DE, Calland JF, Enfield KB, Delos JB, Fairchild KD, Moorman JR. Signatures of subacute potentially catastrophic illness in the ICU: model development and validation. Crit Care Med. 2016;44:1639–48.
7. Monaghan A. Detecting and managing deterioration in children. Paediatr Nurs. 2005;17:32–5.
8. Alam N, Hobbelink EL, van Tienhoven AJ, van de Ven PM, Jansma EP, Nanayakkara PW. The impact of the use of the Early Warning Score (EWS) on patient outcomes: a systematic review. Resuscitation. 2014;85:587–94. 9. Parshuram CS, Hutchison J, Middaugh K. Development and initial validation of
the Bedside Paediatric Early Warning System score. Crit Care. 2009;13:R135. 10. Skaletzky SM, Raszynski A, Totapally BR. Validation of a modified pediatric
early warning system score: a retrospective case-control study. Clin Pediatr (Phila). 2012;51:431–5.
11. Churpek MM, Yuen TC, Winslow C, Robicsek AA, Meltzer DO, Gibbons RD, Edelson DP. Multicenter development and validation of a risk stratification tool for ward patients. Am J Respir Crit Care Med. 2014;190:649–55. 12. Egdell P, Finlay L, Pedley DK. The PAWS score: validation of an early warning scoring system for the initial assessment of children in the emergency department. Emerg Med J. 2008;25:745–9.
13. Royston P, Moons KG, Altman DG, Vergouwe Y. Prognosis and prognostic research: developing a prognostic model. Bmj. 2009;338:b604.
14. Baronov D, McManus M, Butler E, Chung D, Almodovar MC. Next generation patient monitor powered by in-silico physiology. Conf Proc IEEE Eng Med Biol Soc. 2015;2015:4447–53.
15. Rusin CG, Acosta SI, Shekerdemian LS, Vu EL, Bavare AC, Myers RB, Patterson LW, Brady KM, Penny DJ. Prediction of imminent, severe deterioration of children with parallel circulations using real-time processing of physiologic data. J Thorac Cardiovasc Surg. 2016;152:171–7.
16. Yun C, Hui Y. Heterogeneous postsurgical data analytics for predictive modeling of mortality risks in intensive care units. Conf Proc IEEE Eng Med Biol Soc. 2014;2014:4310–4.
17. Pollard TJ, Celi LA. Enabling machine learning in critical care. ICU Manag Pract. 2017;17:198–9.
18. Johnson AEW, Mark RG. Real-time mortality prediction in the intensive care unit. AMIA Annu Symp Proc. 2017;2017:994–1003.
19. Bailly S, Meyfroidt G, Timsit JF. What’s new in ICU in 2050: big data and machine learning. Intensive Care Med. 2018;44:1524–7.
20. Wong HR, Dalton HJ. The PICU perspective on monitoring hemodynamics and oxygen transport. Pediatr Crit Care Med. 2011;12:S66–8.
21. Olive MK, Owens GE. Current monitoring and innovative predictive modeling to improve care in the pediatric cardiac intensive care unit. Transl Pediatr. 2018;7:120–8.
22. Kennedy CE, Turley JP. Time series analysis as input for clinical predictive modeling: modeling cardiac arrest in a pediatric ICU. Theor Biol Med Model. 2011;8:40.
23. Che Z, Purushotham S, Khemani R, Liu Y. Interpretable deep models for ICU outcome prediction. AMIA Annu Symp Proc. 2016;2016:371–80.
24. Rawat W, Wang Z. Deep convolutional neural networks for image classification: a comprehensive review. Neural Comput. 2017;29:2352–449. 25. Anwar SM, Majid M, Qayyum A, Awais M, Alnowami M, Khan MK. Medical image analysis using convolutional neural networks: a review. J Med Syst. 2018;42:226.
26. Kam HJ, Kim HY. Learning representations for the early detection of sepsis with deep neural networks. Comput Biol Med. 2017;89:248–55. 27. Kamaleswaran R, Akbilgic O, Hallman MA, West AN, Davis RL, Shah SH.
Applying artificial intelligence to identify physiomarkers predicting severe sepsis in the PICU. Pediatr Crit Care Med. 2018;19:e495–503.
28. Savalia S, Emamian V. Cardiac arrhythmia classification by multi-layer perceptron and convolution neural networks. Bioengineering. 2018;5:1–12. 29. Chen T, Guestrin C. XGBoost: a scalable tree boosting system. Proceedings
of the 22nd ACM SIGKDD International Conference on Knowledge Discovery and Data Mining. San Francisco: ACM; 2016. p. 785–94. 30. Hochreiter S. #252, Schmidhuber r. long short-term memory. Neural
Comput. 1997;9:1735–80.
31. Davis J, Goadrich M. The relationship between Precision-Recall and ROC curves. Proceedings of the 23rd international conference on Machine learning. Pittsburgh: ACM; 2006. p. 233–40.
32. Keegan MT, Gajic O, Afessa B. Severity of illness scoring systems in the intensive care unit. Crit Care Med. 2011;39:163–9.
33. Murphy-Filkins R, Teres D, Lemeshow S, Hosmer DW. Effect of changing patient mix on the performance of an intensive care unit severity-of-illness model: how to distinguish a general from a specialty intensive care unit. Crit Care Med. 1996;24:1968–73.
34. Booth FV, Short M, Shorr AF, Arkins N, Bates B, Qualy RL, Levy H. Application of a population-based severity scoring system to individual patients results in frequent misclassification. Crit Care. 2005;9:R522–9.
35. Bailey TC, Chen Y, Mao Y, Lu C, Hackmann G, Micek ST, Heard KM, Faulkner KM, Kollef MH. A trial of a real-time alert for clinical deterioration in patients hospitalized on general medical wards. J Hosp Med. 2013;8:236–42. 36. Henry KE, Hager DN, Pronovost PJ, Saria S. A targeted real-time early
warning score (TREWScore) for septic shock. Sci Transl Med. 2015;7: 299ra122.
37. Hillman KM, Bristow PJ, Chey T, Daffurn K, Jacques T, Norman SL, Bishop GF, Simmons G. Duration of life-threatening antecedents prior to intensive care admission. Intensive Care Med. 2002;28:1629–34.
38. Smith ME, Chiovaro JC, O'Neil M, Kansagara D, Quinones AR, Freeman M, Motu'apuaka ML, Slatore CG. Early warning system scores for clinical deterioration in hospitalized patients: a systematic review. Ann Am Thorac Soc. 2014;11:1454–65.
39. Cater DT, Tori AJ, Moser EAS, Rowan CM. Modification and assessment of the bedside pediatric early warning score in the pediatric allogeneic
hematopoietic cell transplant population. Pediatr Crit Care Med. 2018;19:483–8. 40. Akre M, Finkelstein M, Erickson M, Liu M, Vanderbilt L, Billman G. Sensitivity
of the pediatric early warning score to identify patient deterioration. Pediatrics. 2010;125:e763–9.
41. Parshuram CS, Dryden-Palmer K, Farrell C, Gottesman R, Gray M, Hutchison JS, Helfaer M, Hunt EA, Joffe AR, Lacroix J, Moga MA, Nadkarni V, Ninis N, Parkin PC, Wensley D, Willan AR, Tomlinson GA. Effect of a pediatric early warning system on all-cause mortality in hospitalized pediatric patients: the EPOCH randomized clinical trial. JAMA. 2018;319:1002–12.
42. Gold DL, Mihalov LK, Cohen DM. Evaluating the Pediatric Early Warning Score (PEWS) system for admitted patients in the pediatric emergency department. Acad Emerg Med. 2014;21:1249–56.
43. Williams TA, Tohira H, Finn J, Perkins GD, Ho KM. The ability of early warning scores (EWS) to detect critical illness in the prehospital setting: a systematic review. Resuscitation. 2016;102:35–43.
44. Vincent JL, Moreno R. Clinical review: scoring systems in the critically ill. Crit Care. 2010;14:207.
46. Williams JB, Ghosh D, Wetzel RC. Applying machine learning to pediatric critical care data. Pediatr Crit Care Med. 2018;19:599–608.
47. Delahanty RJ, Kaufman D, Jones SS. Development and evaluation of an automated machine learning algorithm for in-hospital mortality risk adjustment among critical care patients. Crit Care Med. 2018;46:e481–e8. 48. Nemati S, Holder A, Razmi F, Stanley MD, Clifford GD, Buchman TG. An
interpretable machine learning model for accurate prediction of Sepsis in the ICU. Crit Care Med. 2018;46:547–53.
49. Bengio Y, Courville A, Vincent P. Representation learning: a review and new perspectives. IEEE Trans Pattern Anal Mach Intell. 2013;35:1798–828. 50. Capan M, Hoover S, Miller KE, Pal C, Glasgow JM, Jackson EV, Arnold RC.
Data-driven approach to Early Warning Score-based alert management. BMJ Open Qual. 2018;7:e000088.
Publisher’s Note