The Cannabis Use Problems Identification Test (CUPIT): development,
reliability, concurrent and predictive validity among adolescents and adults.
Authors
: Jan Bashford (PhD)
1, Ross Flett (PhD)1, & Jan Copeland (PhD)2
1
School of Psychology, Massey University, Palmerston North, New Zealand
2 National Cannabis Prevention and Information Centre, University of New South Wales, Sydney, Australia
Corresponding
Author: Jan Bashford 33 Brooklands Road Nelson
New Zealand 7010
Conflict of Interest: None.
Telephone: 64 3 5450416
Email: [email protected]
Running head: The CUPIT development
Keywords: cannabis problems, cannabis screening, psychometrics, public health
ABSTRACT
Aims: To describe the empirical construction and initial validation of the Cannabis Use
Problems Identification Test (CUPIT), a brief self-report screening instrument for detection of currently and potentially problematic cannabis use.
Design: In a 3-phase prospective design an item pool of candidate questions was generated
from a literature review and extensive expert consultation. The CUPIT internal structure, cross-sectional, and longitudinal psychometric properties were then systematically tested among heterogeneous past year users.
Participants: Volunteer participants were 212 high-risk adolescents (n=138) and adults
(n=74) aged 13-61 years from multiple community settings.
Measurements: The comprehensive assessment battery included several established measures
of cannabis-related pathology for CUPIT validation, with DSM-IV/ICD-10 diagnoses of Cannabis Use Disorders as criterion standard.
Findings: Sixteen items loading highly on two subscales derived from principal components
analysis exhibited good to excellent test-retest (0.89-0.99) and internal consistency reliability (0.92, 0.83), and highly significant ability to discriminate diagnostic subgroups along the severity continuum (non-problematic, risky, problematic use). Twelve months later, baseline CUPIT scores demonstrated highly significant longitudinal predictive utility for respondents’ follow-up diagnostic group membership. ROC analysis identified a CUPIT score of 12 to be the optimal cut-point for maximizing sensitivity for both currently diagnosable cannabis use disorder and those at risk of meeting diagnostic criteria in the following 12 months.
Conclusions: The CUPIT is a brief cannabis screener that is reliable, valid, and acceptable for
INTRODUCTION
Cannabis use and misuse are serious public health concerns worldwide. Current estimates are around 4% of the global population aged from 15 years 1 with much higher rates reported among adolescents.2 A corresponding increase in cannabis treatment seeking internationally and the whole spectrum of attendant health and psychosocial problems has prompted calls for stronger investment in public health initiatives to address cannabis-related harms.1, 3 The magnitude and potential societal ramifications of cannabis-related harms provide a mandate for opportunistic and targeted screening and early intervention (SEI) among users.4
Cannabis screening is a proactive step in identifying users who may be at risk of developing use-related problems.5 Screening information assists efforts to avert or arrest progression of a diagnosable or incubating disorder by intervening as early as possible in its trajectory to dependence and more serious and chronic harms.6 Given that most users with cannabis-related problems neither access nor seek specialist treatment, 7 the high contact rates, accessibility, and other characteristics of community-based health and social services make them ideal sites for opportunistic SEI for cannabis problems.4, 8, 9 However, lack of a brief empirically-verified self-report cannabis screen suitable for use across diverse community settings has hampered implementation of routine SEI for cannabis problems.
There are a number of limitations of using existing lengthy, complex drug screening tools in primary care settings.10 In addition, such general measures often take a lifetime focus, vary widely in content and target group and are not clinically oriented with complex scoring
algorithms. Even the few, briefer generic drug screens available are either inefficient or
otherwise inadequate as quick and accurate screens specifically for detecting a broad spectrum of harmful and risky cannabis consumption. It has been estimated that clinicians would detect more than 80% of drug users if they limit their initial screening questionnaires to marijuana.11
A small assortment of cannabis-specific screens have been developed internationally. These include the Cannabis Abuse Syndrome Screening Test (CASST)12 and Cannabis Use Disorders Identification Test (CUDIT)13 in New Zealand, the Marijuana Screening Inventory (MSI-X)
14-16
Marijuana Use test (PUM)18 in Poland. While closer to the model required for opportunistic cannabis screening, in different ways and to varying extents these tools were developed and tested (1) for case-finding, and not sensitive to risky (pre-dependent) cannabis use (2) among clinical or otherwise restricted samples and (3) not in generalist settings, or (4) for use among both adolescent and adult populations or constituent ethnic/cultural subgroups. Each has further idiosyncratic limitations. Still in their early developmental stages, with either limited or no evidence of their validity for use among at-risk younger users in the general population, these screens require further validation before their widespread use in their original countries or other cultures can be recommended.19
This report describes the empirical construction and initial validation of the Cannabis Use Problems Identification Test (CUPIT), a brief self-report screen developed to expedite detection of currently and potentially problematic cannabis use. Over a 4-year period the CUPIT was systematically developed and validated in a 3-phase design: (1) generation of a pool of candidate questions, (2) examination of the CUPIT’s internal structure and psychometric properties among a heterogeneous community sample of at-risk adolescent and adult cannabis users, and (3) 12-month predictive validity.
METHODS
Item pool generation
Following comprehensive review of the cannabis literature, 90 items sourced from existing interviews and scales, or constructed specifically for this research, were systematically eliminated or refined in successive rounds of an open-ended iterative Expert Panel (n=20) consultation methodology at a local, then international, level. Forty-three items were selected.
formats that maximize discriminatory power for diagnostic subgroups along the risk continuum; and (6) simple, acceptable, universal/culturally adaptable questions with rapid scoring and interpretation procedures.
Candidate questions addressed: reasons for use; cannabis consumption (days used past 12 months, 3 months, times used per day, hours stoned) and potency (products used, smoking method); dependence (tolerance, withdrawal symptoms, loss of control, preoccupation, activities given up); psychological (regretted using, felt paranoid/anxious) and health (general health, nausea, respiratory, energy/motivation, memory/concentration) effects; and abuse/harmful use (hazardous use, injury, failing to meet obligations, others’ concern, interpersonal, work/school, social, financial and legal problems). Predominantly 5-point Likert-type 20 response categories (frequency, intensity, degree) were employed.
Development and initial validation of the CUPIT
Participants
Participants were 212 cannabis users voluntarily recruited from drug treatment clinics (n=36), adult justice (n=7), juvenile justice, and alternative education programmes for at-risk adolescents (n=48), secondary school students (n=52), tertiary students and jobseekers (n=31), and the general population (n=36). Inclusion criteria required having used cannabis at least once in the previous year, aged 13+ years, and English-literate to Year Eight level. Exclusion criteria included illiteracy, intoxication, acute psychiatric or cognitive impairment. Participants were recruited via counsellor, nurse, or officer invitation, on-campus fliers, and ‘snowball sampling’.21, 22
Procedure and Measures
Participants first completed the CUPIT item pool alone. Clinical participants (n=40) provided urine samples. Shortly thereafter (mean = 6.30 days, SD=1.63, range: 4-14) the first author conducted comprehensive assessment interviews. First, most participants (93%, n=197) completed the CUPIT again. The interview schedule took a mean of 60.19 (SD=6.52, range: 50-80) minutes. Only the standardized measures incorporated for validation purposes are reported.
Current (90-day) cannabis use was measured using the Timeline Followback (TLFB) 23 interview validated for users from age 14 years.24-26 The Syva EMIT urinalysis procedure verified clinical participants’ self-reported consumption .27, 28 As criterion standard, 12-month DSM-IV 29 and ICD-10 30 cannabis dependence and abuse/harmful use diagnoses were obtained from the Drug Use module of the computerized CIDI-Auto (version 2.1).31 This automatically generates symptom and diagnostic classifications.32-35 The 5-item Severity of Dependence Scale (SDS) 36, 37 measured the degree of psychological dependence, while the adolescent or adult Cannabis Problems Questionnaire (CPQ, CPQ-A) 38-40 assessed cannabis-induced psychological, physical, and social problems, over the past 6 months. Current psychological health was assessed using the Brief Symptom Inventory 18 (BSI 18), 41 a shortened BSI.42
On individual baseline anniversaries (mean =366 days, range: 318-407) participants were contacted (n=200) and re-assessed (n=194) on all baseline measures except the CUPIT. Participants lost to attrition (8%, n=17) either failed to return calls or declined an interview (n=6), were in prison (n=3), or had left the country (n=8). Interviews were conducted face-to-face (77%), by telephone (20%), or post/email (3%) from remote locations.
Data analysis
Principal Component Analysis (PCA), and the internal consistency of retained components estimated using Cronbach’s alpha.44
CUPIT scores were obtained by summating respondents’ raw scores.45, 46 Construct (criterion, concurrent, convergent) validity was examined by comparing scores with measures of the same (CIDI-Auto, SDS, CPQ/CPQ-A, TLFB) or associated (BSI) phenomena, employing two-tailed Pearson’s r (sample) and independent t-tests (adolescent/adult comparisons).
Discriminative validity was examined by comparing CUPIT subscale scores of the 3 diagnostic groups (dependence, abuse/harmful use, non-problematic use) using one-way analysis of variance (ANOVA). Significantly different between-groups scores would indicate good discriminative validity. Longitudinal predictive validity of baseline scores for follow-up diagnostic group was similarly assessed. A receiver operating characteristic (ROC) curve was plotted to determine the CUPIT’s capacity for discriminating cases (a diagnosis) from non-cases (no diagnosis) at baseline (n=211) and follow-up (n=194). A larger value of the area under the curve (AUC) represents greater sensitivity (baseline) or predictive efficacy (follow-up). Chi square values were calculated to determine the cut-point providing the best balance between sensitivity (proportion of true positives) and specificity (proportion of true negatives) for identifying currently diagnosable and at-risk users.
RESULTS
Participants
Baseline 12-month DSM-IV/ICD-10 diagnoses were 72% cannabis dependence, 19% cannabis abuse, and 68% both diagnoses. Only 8% (n=17) had no diagnosis: 12 adolescents were ‘diagnostic orphans’ 47, 48 (met one or two dependence criteria only) while 5 reported no symptoms. No significant adolescent/adult differences emerged in number of symptoms elicited (mean 6.4, SD=3.26, range: 0-13), SDS (adolescent mean 4.05, SD=2.42, range: 0-12; adult mean 4.64, SD=3.23, range: 0-14 from a possible 15) or core CPQ/CPQ-A (mean 11.76, both ranges: 0-23) scores. BSI scores suggested 20% of this sample met Derogatis’ definition of ‘caseness’ or positive risk for psychiatric problems that warranted intervention.41 While only 17% had ever sought treatment for, only 15% thought they currently had, a cannabis problem.
Twelve months later, adolescents (n=128) reported significantly increased consumption while adults’ (n=66) use remained at baseline levels. Endorsing significantly more symptoms (mean 7.52, SD=3.47, range: 0-13), larger sample proportions (76%) obtained a DSM-IV/ICD-10 dependence diagnosis, abuse (17%), and both diagnoses (74%). Scores were significantly higher on the SDS (mean 5.52, SD=2.96, range: 0-13), CPQ (mean 13.65 vs. 11.75 baseline), CPQ-A (mean 16.8 vs. 11.76 baseline), and the GSI, suggesting a larger proportion (23% vs. 20% baseline) had psychiatric problems needing treatment. Again, however, 86% did not desire any assistance to help them cut down/quit.
Dimensionality of the CUPIT
Removal or transformation of dichotomously/trichotomously-scored items left 39 of suitable metric scaling. A series of PCA was conducted, alternating Varimax and Oblique rotation on a combination of 14 original and 25 transformed items, and then on 39 untransformed items.
Factor retention criteria included Cattell’s scree test, 49 eigenvalues, number of variables with significant loadings on a factor, and interpretability.45, 50 Since successive variable-technique combinations produced similar solutions with largely uncorrelated factors (less than 10%
variance overlap), the solution using the untransformed variables and submitting 2 factors to
Table 1 approx here……
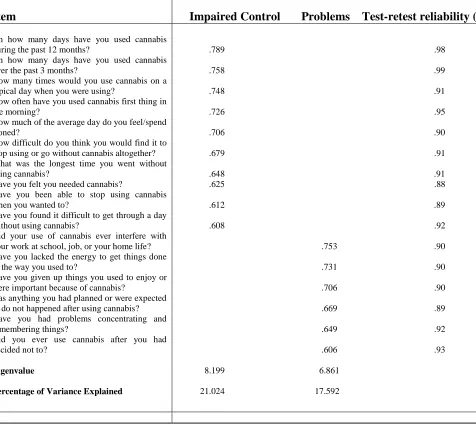
Sixteen items loading on two primary components after rotation explained 38.62% of the total variance. While most items loaded above that deemed ‘excellent’ (>.71) or ‘very good’ (>.63), all loaded well above the minimum for interpretive purposes (.30).45, 46 The first component had significant loadings of 10 items: 5 were consumption variables, with the remaining 5 suggesting ‘impaired control’ over use. The second component comprised 6 items reflecting consequences of, or ‘problems’ caused by, cannabis use. The component scales were thus labeled.
Psychometric properties of the CUPIT
Reliability
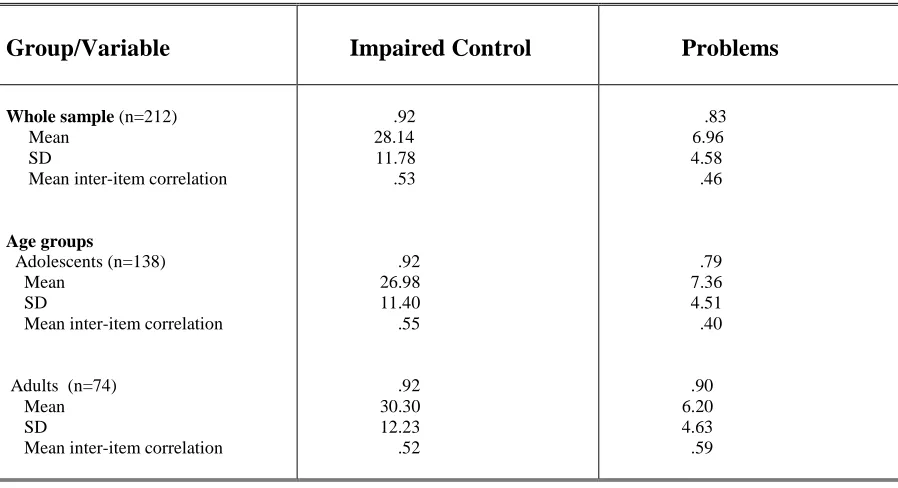
One-week test–retest reliability estimates of CUPIT items (.89 to .99) were all in the range deemed excellent (>.80) 45, 52 (Table 1). Internal consistency reliability estimates and descriptive statistics appear in Table 2. Cronbach’s alphas ranged from .79 to .92, well in excess of the recommended benchmark (.70) for exploratory research and suggesting proper sampling of content domains. Combined with the only moderate mean inter-item correlations of both components (range .40 to .59) and inter-scale correlation (r=.47, p=<.001) this indicates that, with good discriminative validity (only 22% shared variance), the two subscales were separate but related axes of a primary construct of cannabis-related problems in a heterogeneous community sample.52 Spearman correlations between clinical participants’ urinalysis results (n=40) and self-reported days (ϒs= .43, p =.01) and cones (ϒs =.37, p =.02)
used over the past 30 days suggested a general absence of bias.
Table two approx here….
Construct validity
Adults’ significantly higher mean Impaired Control scores (t (201) = -2.13, p. 03) and adolescents’ significantly higher mean Problems scores (t (201) = 2.00, p. 04) (Table 2) justified using age groups in further analyses. Pearson correlation coefficients between the CUPIT subscales and validation measures are displayed in Table 3.
Table 3 approx here…..
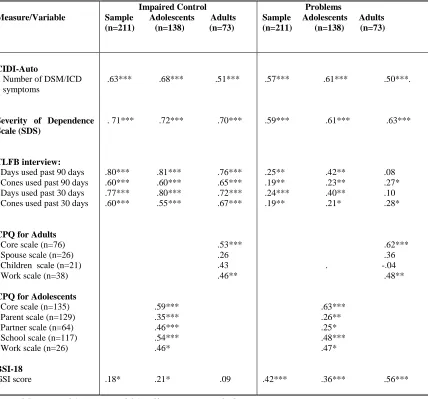
As evident, both subscales converged in conceptually consistent, highly significant, moderate to strong correlation patterns with total DSM/ICD symptoms, the SDS, all CPQ-A subscales, and the adult CPQ core and work scale. Impaired Control strongly correlated with all TLFB variables. Aadolescents largely accounted for the significant correlation between Problems and consumption measures, and between Impaired Control and psychological distress (GSI).
Discriminative validity
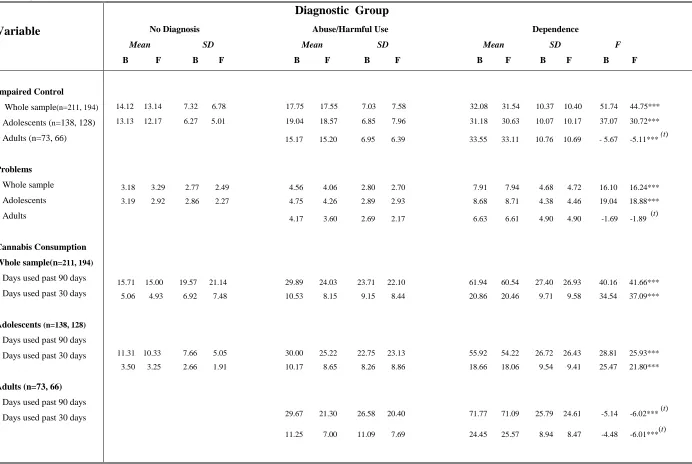
CUPIT subscale scores of the three independent CIDI-Auto-generated DSM-IV/ICD-10 diagnostic groups (no diagnosis, n=17; abuse and/or harmful use, n=36; dependence, with or without abuse/harmful use, n=158) were compared using one-way ANOVA (Table 4). Given insufficient cases in the adult ‘no diagnosis’ group, Student’s t-tests were used for adult comparisons.
Table 4 approx here…..
significantly, a pattern also evident in consumption scores. A mixed result emerged for adult groups.
Longitudinal predictive capacity
At follow-up, Pearson correlations were employed to examine the longitudinal relationship between baseline CUPIT subscale scores and re-administered validation measures. Again, Impaired Control exhibited a generally strong, highly-significant correlation and Problems a moderate to strong significant correlation, with most measures. While adolescents’ increased consumption and problems largely explained stronger associations, adult scores remained
generally stable with some minor fluctuations.
Follow-up diagnostic groups from the CIDI-Auto algorithm (no diagnosis, n=14; abuse/harmful use, n=33; and dependence, with or without abuse/harmful use, n=147) were compared using one-way ANOVAS followed by Tukey’s HSD (t-tests for adults) for any differences in original CUPIT scores and baseline consumption as a function of group membership. Table 4 presents baseline/follow-up values.
Results replicated baseline patterns of significantly different between-group mean scores with post-hoc patterns of non-significant differences between ‘abuse/harmful use’ and ‘no diagnosis’ groups. Baseline CUPIT subscale scores (particularly Impaired Control) had highly significant predictive power for diagnostic group membership 12 months later. Baseline consumption also exhibited highly significant ability to prospectively predict diagnostic group assignment.
Classification accuracy
(baseline n=194; follow-up n=180) defined a ‘case’; no diagnosis (baseline n=17; follow-up n=14) defined a ‘control’.
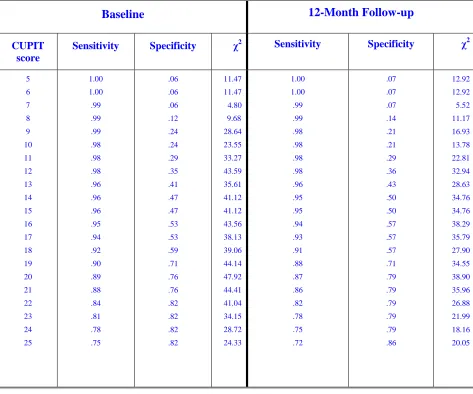
The AUC for CUPIT scores when discriminating respondents qualifying for a 12-month diagnosis from those who did not at baseline was 0.88 (95% CI=0.80, 0.97), indicating very good diagnostic performance. The closer the AUC is to 1, the more disparate the groups. Similarly, the AUC for CUPIT scores when predicting those who will qualify for a diagnosis 12 months later and those who will not was 0.89 (95% CI=0.82, 0.96). The sensitivities, specificities, positive predictive value (PPV) and chi square values corresponding to potential
score cut-points are presented in Table 5.
Table 5 approx here………
Table 5 suggests the optimal CUPIT cut-off score to be 20 at both baseline and follow-up
(sensitivity 87%, specificity 79%, PPV 98%). However, in this high-risk sample the more liberal cut-point of 12 classified almost all (176 of 180) true positives with increased sensitivity (98%), minor loss of PPV (95%) with a corresponding reduction in specificity (36%). Of critical importance in an opportunistic screening context, this cut-point captured 8 of the 12 ‘diagnostic orphans’ in the screening net.
DISCUSSION
The CUPIT is a highly-acceptable, reliable and valid brief cannabis screener for use across community settings and consumers of all ages. Its novel capability is to reliably classify both currently diagnosable and potentially problematic cannabis use among respondents. These estimable properties derive from the CUPIT’s systematic development informed by international expert opinion and empirical longitudinal validation among typically diverse cannabis-using adolescents and adults.
across adult and adolescent cannabis users universally (face/content validity). Respondents
spontaneously confirmed that questions accurately captured their experience of cannabis use
and problems. The validation analyses clearly show that the CUPIT satisfies temporal and
internal consistency reliability, and construct, discriminative, diagnostic (sensitivity) and predictive validity. Test-retest (0.89 to 0.99) and internal consistency reliability estimates (0.92 and 0.83) were well above the accepted benchmark for exploratory research (.70)46, 53 while the construct validation data provided substantial evidence of the CUPIT’s specific validity properties. The particularly consistent, strong positive relationship of ‘Impaired Control’ with all key measures supports the dimensionality of the dependence syndrome and its existence in a broad spectrum of adolescent and adult cannabis users before they come to clinical attention.54
For maximum utility in opportunistic cannabis screening, a screen should discriminate diagnostic groups along the risk continuum, from high risk (dependence diagnosis likely), through non-dependent but moderate risk of developing dependence (diagnostic orphans, abuse, risky use), to low risk.55-57 The CUPIT’s discriminative ability was evident in significantly different between-group mean scores increasing with diagnostic severity. The non-significant difference between ‘abuse/harmful use’ and ‘no diagnosis’ groups was explained by the 12 diagnostic orphans who, while distinct from ‘dependent’ groups, are similar to ‘abuse’ groups.47, 48, 58 At follow-up four baseline diagnostic orphans had progressed to full-blown DSM-IV/ICD-10 disorder while 8 remained orphans. With cannabis problems just under the diagnostic threshold and on a trajectory towards dependence, these high-risk users are prime targets for an early intervention.79, 59, 60
The CUPIT’s ROC diagnostic performance demonstrated its significant predictive capability over a 12-month period. The indicators at alternative cut-points (Table 5) illustrate the sensitivity/specificity trade-off decisions involved when attempting to detect at-risk and
optimal in other cultures, contexts, or settings (e.g., specialist, primary care settings, epidemiological research), among other cannabis-using populations with different prior probabilities for the disorder (general population, primary care, clinical) and for different purposes (preliminary screening, assessment referral, treatment planning).
The 16 final CUPIT items (Table 1) measure the DSM/ICD tri-dimensional concept of risky use (items 1 and 2), dependence/using behaviour (3-10), health and social problems (11-16), requiring a reading level of approximately seven/eight years’ schooling and about 5 minutes administration time. Scores can range from 0 (no use at all) to 82 (daily/more than daily use, severely problematic). Rapidly-scored and interpreted, self-or other-administered, the CUPIT has potential as a population screener, research tool, pre-post measure in clinical outcomes assessment, a discrete screener or component embedded within a lifestyle questionnaire, and is adaptable for computerized administration. The CUPIT is available at
http://ncpic.org.au/assets/downloads/workforce/cannabisinfo/assessment-tools/cannabis-use-problems-identification-test.pdf
The CUPIT has several advantages over existing cannabis screens. The inclusive sampling strategy, DSM-IV/ICD-10 criteria as criterion standard, and incorporating clinically-assessed adolescent and adult users assured the CUPIT’s relevance to both clinical and general populations. The CUPIT’s foremost advantage is its ability to reliably identify both currently problematic and risky use across adolescent and adult respondents.
There are some sampling and methodological caveats to this preliminary validation study. The uncontrolled, self-report, pre-post measures design raises possible reliability/validity issues. However, all indicators, including toxicology reports and (informal) internal ‘audits’, suggest over/under-reporting to be minimal, as found elsewhere.62-65 Validating the CUPIT by reference to validation instruments incorporating the same key elements may have inflated correlations, and hence validity estimates. While data from a rather small adolescent/adult
community sample of predominantly high-risk users arguably represents those primarily
cannabis-using populations in other cultures. Research applying confirmatory factor analytical procedures and cross-validation is also desirable.
Cannabis use is adversely impacting the health and social functioning of a large and rapidly-expanding cohort of the world’s adults, adolescents, and alarmingly - children. As exemplified in this sample, most are either unaware, or do not feel they need, assistance.66-68 Routine opportunistic and targeted screening with early intervention for cannabis problems has potential for enormous gains in public health. Rapid, reliable, valid classification of a broad spectrum of cannabis-related problems and harms is the hallmark of a screener suitable for cannabis SEI. This report provides extensive evidence that the CUPIT satisfies these crucial criteria.
Acknowledgements
This study would not be possible without the contribution of the many organizations and individuals who helped make the CUPIT project a reality, and we thank them for their valued contribution.
References
(1) UNODC (2009). World Drug Report 2009. Available on-line: www.unodc.org.
(2) Fergusson, D.M., & Horwood, L.J. (2000). Cannabis use and dependence in a New Zealand birth cohort. New Zealand Medical Journal, 113, 156-158.
(3) World Health Organization (2004). The neuroscience of psychoactive substance use and dependence. Geneva, Switzerland: Author.
(5) Lader, M., Edwards, G., & Drummond, D.C. (1992). The demands which the problems perspective sets for research. In: M. Lader, G. Edwards & D.C. Drummond (Eds), The nature of alcohol and drug-related problems (pp. 189-197). New York: Oxford University Press.
(6) Anthony, J.C. (2000). Putting epidemiology and public health in needs assessment: Drug dependence and beyond. In G. Andrews & S. Henderson (Eds.), Unmet need in psychiatry: Problems, resources, responses (pp. 302-308). Cambridge: Cambridge University Press.
(7) Hall, W., & Swift, W. (2006). Policy implications of cannabis dependence. In: R.A.Roffman & R.S. Stephens (Eds.), Cannabis dependence: Its nature, consequences and treatment (pp.315-319). London: Cambridge University Press.
(8) Penrose-Wall, J., Copeland, J., & Harris, M. (2000). Shared care of illicit drug problems by general practitioners and primary health care providers: A literature review. Sydney: Centre for General Practice Integration Studies, University of New South Wales.
(9) Copeland, J., Frewen, A., & Elkins, K. (2009). Management of cannabis use disorder
and related issues: a clinician’s guide. NCPIC: Sydney.
(10) McPherson, T.L., & Hersch, R.K. (2000). Brief substance use screening instruments for primary care settings: A review. Journal of Substance Abuse Treatment, 18, 193-202.
(11) Fleming, M. (2002). Screening, assessment, and intervention for substance use disorders in general health care settings. Substance Abuse, 23, (Suppl), 47-66.
(12) Hannifin, J. (1990). The cannabis abuse syndrome screening test: a brief report.
Unpublished report. Wellington: Drugs Advisory Committee.
(13) Adamson, S., & Sellman, J.D. (2003). A prototype screening instrument for cannabis use disorder: The Cannabis Use Disorders Identification Test (CUDIT) in an alcohol dependent clinical sample. Drug and Alcohol Review, 22, 309-315.
(15) Alexander, D., & Leung, P. (2004). The Marijuana Screening Inventory (MSI-X): Reliability, factor structure, and scoring criteria with a clinical sample. American Journal of Drug and Alcohol Abuse, 30, 321-351.
(16) Alexander, D., & Leung, P. (2006). The Marijuana Screening Inventory (MSI-X): Concurrent, convergent and discriminant validity with multiple measures. American Journal of Drug and Alcohol Abuse, 32, 351-378.
(17) Legleye, S., Karila, L., Beck, F., & Reynaud, M. (2007). Validation of the CAST, a general population Cannabis Abuse Screening Test. Journal of Substance Use, 12, 233-242.
(18) Okulicz-Kozaryn, K. (2007). Psychometric properties of the Problematic Marijuana Use (PUM) test for adolescents. Post Psychiatry and Neurology, 16 (2), 105-111.
(19) Piontek, D., Kraus, L., & Klempova, D. (2008). Short scales to assess cannabis-related
problems: a review of psychometric properties. Substance Abuse Treatment, Prevention,
and Policy, 3, 25.
(20) Likert, R. (1932). A technique for the measurement of attitudes. Archives of Psychology, 140, 44-53.
(21) Griffiths, P., Gossop, M., Powis, B., & Strang, J. (1993). Reaching hidden populations of drug users by privileged access interviewers: methodological and practical issues. Addiction, 88, 1617-1626.
(22) Watters, J. & Biernacki, P. (1989). Targeted sampling: options for the study of hidden populations. Social Problems, 36, 416-430.
(23) Sobell, L. C., & Sobell, M. B. (1992). Timeline Follow-Back: A technique for assessing self-reported alcohol consumption. In R. Litten and J. Allen (Eds.), Measuring alcohol consumption; Psychosocial and biochemical methods (pp. 41-69). Totowa, NJ: Humana Press Inc.
(25) Fals-Stewart, W., O’Farrell, T.J., Freitas, T.T., McFarlin, S.K., & Rutigliano, P. (2000).
The timeline followback reports of psychoactive substance use by drug-abusing patients: psychometric properties. Journal of Consulting and Clinical Psychology, 68,
134-144.
(26) Marijuana Treatment Project Research Group (2004). Brief treatments for cannabis dependence: findings from a randomized multi-site trial. Journal of Consulting and Clinical Psychology, 72, 455-456.
(27) Leino, A., Saaramies, J., Gronholm,. M. & Lillesunde, P. (2001). Comparison of eight
commercial on-site screening devices for drugs of abuse testing. Scandanavian Journal of Clinical Laboratory Investigation, 61, 325-331.
(28) Lafolie, P., Beck, O., Blennow, G., Boreus, L., Borg, S., Elwin, C.E., Karlsson, L., Odelius, G., & Hjemdahl, P. (1991). Importance of creatinine analyses of urine when screening for abused drugs. Clinical Chemistry, 37, 1927-1931.
(29) American Psychiatric Association (1994). Diagnostic and statistical manual of mental disorders (4th edition). Washington: Author.
(30) World Health Organization (1992). International Classification of Diseases- Tenth Revision (ICD-10). Geneva, Switzerland: Author.
(31) World Health Organization (1997). Composite International Diagnostic Interview, 2.1, Computerized Version (CIDI-Auto). Geneva, Switzerland: Author.
(32) Andrews, G. & Peters, L. (1998). The psychometric properties of the Composite International Diagnostic Interview. Soc Psychiatry Psychiatric Epidemiology, 33, 80-88.
(34) Wittchen, H-U., Lachner, G., Wunderlich, U., Pfister, H. (1998). Test-retest reliability of the computerized DSM-IV version of the Munich-Composite International Diagnostic Interview (M-CIDI). Soc Psychiatry and Psychiatric Epidemiology, 33, 568-578.
(35) Kedzior, K.K., & Martin-Iverson, M.T. (2007). Concurrent validity of cannabis misuse on CIDI-Auto 2.1 in low-level cannabis users from the general population. Australian Journal of Psychology, 59, 169-175.
(36) Swift, W., Copeland, J., & Hall, W. (1998). Choosing a diagnostic cut-off for cannabis dependence. Addiction, 93, 1681-1692.
(37) Martin, G., Copeland, J., Gates, P., & Gilmour, S. (2006). The Severity of Dependence Scale (SDS) in an adolescent population of cannabis users. Journal of Substance Abuse Treatment, 29, 207-213.
(38) Copeland, J., Swift, W., Roffman, R., & Stephens, R. (2001). A randomized controlled trial of brief cognitive-behavioral interventions for cannabis use disorder. Journal of Substance Abuse Treatment, 21, 55-64.
(39) Copeland, J., Gilmour, S., Gates, P., & Swift, W. (2005). The Cannabis Problems Questionnaire: factor structure, reliability and validity. Drug and Alcohol Dependence, 80, 313-319.
(40) Martin, G., Copeland, J., Gilmour, S., Gates, P., & Swift, W. (2006). The Adolescent Cannabis Problems Questionnaire (CPQ-A): Psychometric properties. Addictive Behaviors, 31, 2238-2248.
(41) Derogatis, L. R. (2000). Brief Symptom Inventory 18 (BSI 18): Administration, scoring, and procedures manual. Minneapolis, MN: National Computing Systems Pearson, Inc.
(42) Derogatis, L.R. (1994). Symptom Checklist 90-R (SCL-90-R): Administration, scoring, and procedures manual (3rd edition). Minneapolis, MN: National Computing Systems Pearson, Inc.
(44) Cronbach, L.J. (1951). Coefficient alpha and the internal structure of tests.
Psychometrika, 16, 297-334.
(45) Comrey, A.L., & Lee, H.B. (1992). A first course in factor analysis. Hillsdale, NJ: Lawrence Erlbaum Associates.
(46) Nunnally, J.C. (1978). Psychometric theory. New York: McGraw-Hill Inc.
(47) Deas, D., Roberts, J., & Grindlinger, D. (2005). The utility of DSM-IV criteria in diagnosing substance abuse/dependence in adolescents. Journal of Substance Use, 10,
10-21.
(48) Degenhardt, L., Lynskey, M., Coffey, C., & Patton, G. (2002). ‘Diagnostic orphans’ among young adult cannabis users: Persons who report symptoms but do not meet diagnostic criteria. Drug and Alcohol Dependence, 67, 205-212.
(49) Cattell, R.B. (1966). The screen test for number of factors. Multivariate Behavioral Research, 1, 245-276.
(50) Kim, J-O, & Mueller, C.W. (1978). Factor analysis: Statistical methods and practical issues. Beverly Hills, CA: Sage.
(51) Schmitt, N. (1996). Uses and abuses of coefficient alpha. Psychological Assessment, 8,
350-353.
(52) Kline, P. (1998). The new psychometrics: Science, psychology, and measurement.
London: Routledge.
(53) Streiner, D.L., & Norman, G.R. (Eds.) (1995). Health measurement scales: a practical guide to their development and use (2nd ed.). Oxford: Oxford University Press.
(54) Saunders, J.B., Aasland, O.G., Amunsden, A., & Grant, M. (1993). Development of the Alcohol Use Disorders Indentification Test (AUDIT): WHO Collaborative Project on Early Detection of Persons with Harmful Alcohol Consumption: II. Addiction, 88,
(55) Dawe, S., Loxton, N.J., Hides, L., Kavanagh, D.J., & Mattick, R.P. (2002). Review of diagnostic screening instruments for alcohol and other drug use and other psychiatric
disorders (2nd ed.). Canberra: Australian Government Publishing Service.
(56) Newcombe, D.A.L., Humeniuk, R.E., & Ali, R. (2005). Validation of the World Health Organization Alcohol, Smoking and Substance Involvement Screening Test (ASSIST); report of results from the Australian site. Drug and Alcohol Review, 24, 217-226.
(57) Winters, K. (2003). Assessment of alcohol and other drug use among adolescents. In Allen, J. P. & Wilson, V. B. (Eds.), Assessing alcohol problems (2nd ed.). NIH Publication No. 03-3745. Bethseda, MD: National Institute on Alcohol Abuse and Alcoholism.
(58) Hasin, D., & Paykin, A. (1999). Dependence symptoms but no diagnosis: ‘diagnostic orphans’ in a 1992 national sample. Drug and Alcohol Dependence, 53, 215-222.
(59) Chen, C-Y., O’Brien, M.S. & Anthony, J.C. (2005). Who becomes cannabis dependent soon after onset of use? Epidemiological evidence from the United States: 2000-2001. Drug and Alcohol Dependence, 79, 11-22.
(60) Degenhardt, L., Coffey, C., Carlin, J.B., Swift, W., & Patton, G.C. (2008). Are diagnostic orphans at risk of developing cannabis abuse or dependence? Four-year follow-up of young adult cannabis users not meeting diagnostic criteria. Drug and Alcohol Dependence, 92, 86-90.
(61) Conigrave, K.M., Hall, W., & Saunders, J.B. (1995). The AUDIT questionnaire: choosing a cut-off score. Addiction, 90, 1349-1356.
(62) Babor, T.F., Steinberg, K., McRee, B., Vendetti, J., & Carroll, K.C. (2002). Treating marijuana dependence in adults: a multi-site randomized clinical trial. New Directions in Evaluation, 94, 17-30.
(63) Buchan, B.J., Dennis, M.L., Tims, F.M., & Diamond, G.S. (2002). Cannabis use: consistency and validity of self-report, on-site urine testing and laboratory testing.
(64) Gignac, M., Wilens, T.E., Biederman, J., Kwon, A., Mick, E., & Swezey, A. (2005). Assessing cannabis use in adolescents and young adults: What do urine screens and parental report tell you? Journal of Child and Adolescent Pharmacology, 15, 742-750.
(65) Mennes, C.E., Abdallah, A.B., & Cottler, L.B. (2009). The reliability of self-reported cannabis abuse, dependence and withdrawal symptoms: Multisite study of differences between general population and treatment groups. Addictive Behaviors, 34, 223-226.
(66) Agosti, V., & Levin, F. (2004). Predictors of treatment contact among individuals with cannabis dependence. The American Journal of Drug and Alcohol Abuse, 30, 121-127.
(67) Gates, P., Taplin, S., Copeland, J., Swift, W., & Martin, G. (2009). Barriers and facilitators to cannabis treatment. NCPIC Technical Report 1, NCPIC: Sydney.
(68) Urbanoski, K.A., Strike, C.J., & Rush, B.R. (2005). Individuals seeking treatment for
cannabis-related problems in Ontario: Demographic and treatment profile. European
Table 1. CUPIT subscale items after principal components analysis with orthogonal rotation: item loadings, eigenvalues, percentage of variance explained (n=212), and test-retest reliabilities (n=197)
Item Impaired Control Problems Test-retest reliability (r)*
On how many days have you used cannabis during the past 12 months?
On how many days have you used cannabis over the past 3 months?
How many times would you use cannabis on a typical day when you were using?
How often have you used cannabis first thing in the morning?
How much of the average day do you feel/spend stoned?
How difficult do you think you would find it to stop using or go without cannabis altogether? What was the longest time you went without using cannabis?
Have you felt you needed cannabis?
Have you been able to stop using cannabis when you wanted to?
Have you found it difficult to get through a day without using cannabis?
Did your use of cannabis ever interfere with your work at school, job, or your home life? Have you lacked the energy to get things done in the way you used to?
Have you given up things you used to enjoy or were important because of cannabis?
Has anything you had planned or were expected to do not happened after using cannabis? Have you had problems concentrating and remembering things?
Did you ever use cannabis after you had decided not to?
Eigenvalue
Percentage of Variance Explained
.789 .98
.758 .99
.748 .91
.726 .95
.706 .90
.679 .91
.648 .91 .625 .88
.612 .89
.608 .92
.753 .90
.731 .90
.706 .90
.669 .89
.649 .92
.606 .93
8.199 6.861
21.024 17.592
* All correlations were significant at the 0.01 level (two-tailed)
Table 2. Standardized internal consistency reliability estimates and descriptives for the CUPIT subscales
Group/Variable Impaired Control Problems
Whole sample (n=212) Mean
SD
Mean inter-item correlation
Age groups
Adolescents (n=138) Mean
SD
Mean inter-item correlation
Adults (n=74) Mean SD
Mean inter-item correlation
.92
28.14 11.78 .53
.92
26.98 11.40 .55
.92
30.30 12.23 .52
.83
6.96 4.58 .46
.79
7.36 4.51 .40
.90
Table 3. Correlation between the CUPIT subscales and key validation measures
Measure/Variable
Impaired Control Sample Adolescents Adults (n=211) (n=138) (n=73)
Problems
Sample Adolescents Adults (n=211) (n=138) (n=73)
CIDI-Auto
Number of DSM/ICD symptoms
Severity of Dependence Scale (SDS)
TLFB interview: Days used past 90 days Cones used past 90 days Days used past 30 days Cones used past 30 days
CPQ for Adults Core scale (n=76) Spouse scale (n=26) Children scale (n=21) Work scale (n=38)
CPQ for Adolescents Core scale (n=135) Parent scale (n=129) Partner scale (n=64) School scale (n=117) Work scale (n=26)
BSI-18
GSI score
.63*** .68*** .51***
. 71*** .72*** .70***
.80*** .81*** .76***
.60*** .60*** .65***
.77*** .80*** .72***
.60*** .55*** .67***
.53*** .26 .43 .46** .59*** .35*** .46*** .54*** .46*
.18* .21* .09
.57*** .61*** .50***.
.59*** .61*** .63***
.25** .42** .08
.19** .23** .27*
.24*** .40** .10
.19** .21* .28*
.62***
.36
. -.04
.48** .63*** .26** .25* .48*** .47* .42*** .36*** .56***
Table 4. CUPIT subscale and consumption scores by DSM-IV/ICD-10 diagnostic group at baseline (n=211) and 12-month follow-up (n=194)
Variable
Diagnostic Group
No Diagnosis Abuse/Harmful Use Dependence
Mean SD Mean SD Mean SD F
B F B F B F B F B F B F B F
Impaired Control
Whole sample(n=211, 194)
Adolescents (n=138, 128) Adults (n=73, 66)
Problems
Whole sample Adolescents Adults
Cannabis Consumption
Whole sample(n=211, 194) Days used past 90 days Days used past 30 days
Adolescents (n=138, 128)
Days used past 90 days Days used past 30 days
Adults (n=73, 66)
Days used past 90 days Days used past 30 days
14.12 13.14 7.32 6.78 17.75 17.55 7.03 7.58 32.08 31.54 10.37 10.40 51.74 44.75***
13.13 12.17 6.27 5.01 19.04 18.57 6.85 7.96 31.18 30.63 10.07 10.17 37.07 30.72***
15.17 15.20 6.95 6.39 33.55 33.11 10.76 10.69 - 5.67 -5.11*** (t)
3.18 3.29 2.77 2.49 4.56 4.06 2.80 2.70 7.91 7.94 4.68 4.72 16.10 16.24*** 3.19 2.92 2.86 2.27 4.75 4.26 2.89 2.93 8.68 8.71 4.38 4.46 19.04 18.88*** 4.17 3.60 2.69 2.17 6.63 6.61 4.90 4.90 -1.69 -1.89 (t)
15.71 15.00 19.57 21.14 29.89 24.03 23.71 22.10 61.94 60.54 27.40 26.93 40.16 41.66*** 5.06 4.93 6.92 7.48 10.53 8.15 9.15 8.44 20.86 20.46 9.71 9.58 34.54 37.09***
11.31 10.33 7.66 5.05 30.00 25.22 22.75 23.13 55.92 54.22 26.72 26.43 28.81 25.93*** 3.50 3.25 2.66 1.91 10.17 8.65 8.26 8.86 18.66 18.06 9.54 9.41 25.47 21.80***
29.67 21.30 26.58 20.40 71.77 71.09 25.79 24.61 -5.14 -6.02*** (t) 11.25 7.00 11.09 7.69 24.45 25.57 8.94 8.47 -4.48 -6.01***(t)
[image:26.792.47.739.80.544.2]Table 5. CUPIT sensitivity, specificity, and χ2values at potential cut-off scores when discriminating between cannabis users with and without a DSM-IV/ICD-10 diagnosis of cannabis dependence or abuse/harmful use at baseline (n=211) and follow-up (n=194).
Baseline 12-Month Follow-up
CUPIT score
Sensitivity Specificity χ2 Sensitivity Specificity χ2
MASSEY UNIVERSITY
MASSEY RESEARCH ONLINE http://mro.massey.ac.nz/
Massey Documents by Type Journal Articles
The Cannabis Use Problems Identification
Test (CUPIT): development, reliability,
concurrent and predictive validity among
adolescents and adults
Bashford, J
2010-04-01