IJEDR1702208
International Journal of Engineering Development and Research (www.ijedr.org)1321
Sentiment Mining of Online Reviews Using
Machine Learning Algorithms
Vidushi
1, Gurjot Singh Sodhi
2Research Scholar1, Assistant Professor2
Department of Computer Science
Shaheed Udham Singh College of Engineering & Technology
ABSTRACT: Social media has drawn the attention of researchers all around the world in recent times. The reason can be attributed to the large set of data available due to active involvement of the users on such platforms. The paper proposes a novel strategy of sentiment analysis on user’s review data using hybrid algorithm. Analysis of public’s views regarding a particular items is a complex task which involves many aspects like preprocessing, score calculation, classification algorithm etc. The paper proposes a novel strategy in which the effect of other’s review for score calculation are taken into account. Also the grammatical mistakes are taken into account for pre-processing. Further a hybrid KNN algorithm will be developed which will address the short comings of earlier used algorithms like SVM for handling high dimensionality data through chi-square technique. The results will compared to that of traditional algorithms in terms of precision, accuracy and recall values
KEYWORDS: KNN,SVM, Naïve Bayes , social review, hybrid knn, data mining
I. INTRODUCTION
Companies are now using social media to promote their products and services. Many companies use Facebook and Twitter accounts to keep in touch with their clients. Clients also use social media to get information about products / services. In many ways, the Internet in general and social media in particular, has changed the way customers shop for goods and services. It is now quite normal for people to find the product that they want to brick-and-mortar stores and then order it online. In addition, the online consumer reviews (OCR) helped customers to learn about the strengths and weaknesses of different products and find the ones that best suit their needs. Compared to vendor-generated product descriptions, OCRs are more user-oriented and describe the product in terms of different usage scenarios and assess it from a user's perspective.
Human life is filled with emotions and opinions. Having an access to large quantities of data through internet and its transformation into a social web is no longer an issue, as there are terabytes of new information produced on the web every day that are available to any individual. Even more importantly, it has changed the way we share information. The use of social media is increasing day by day Increasing growth of social media users over internet has also increased their participation in various discussions and activities simultaneously. In case of a product, reviews of users will help to take many important decisions about the services of the product. But manually reading such a bulk amount reviews is a very difficult task. So there is a need of a automatic system which will lead to automatically extract the positive and negative features of the product and make the decision making process easier. There are many sites and companies which perform these activities.
A. sentiment analysis
IJEDR1702208
International Journal of Engineering Development and Research (www.ijedr.org)1322
these discussions and reviews help in many sectors such as improving e-learning environment, providing personalization in e-learning environment, for getting public response to governmental activities .Example:
User’s Opinion: Person a: it’s a great movie (positive statement)
Person b: the new iPhone is awesome..!!! (Positive statement) Person c: Nah!! I didn’t like it at all... (Negative statement)
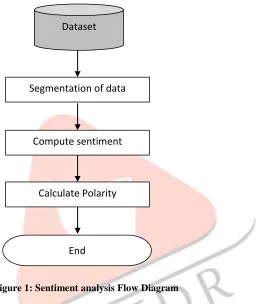
Figure 1: Sentiment analysis Flow Diagram
In the Fig 1.1 flowchart of sentiment analysis is represented which gives the general flow of process of sentiment analysis. From the given dataset, what we have to do is to extract the data and segment that data according to parts of speech. After that we will check the sentiments and assign tags to the extracted tokens. In the last step overall polarity of the text is calculated. If the polarity of data is positive, it is positive sentence and if polarity is negative it is negative sentence.
B. Need for Sentiment Analysis
As the use of social media is increasing day by day, consumers react toward government actions. Total 110 million users in India use social networking sites. The analysis of consumer behavior thus become the inevitable and critical part of the overall planning and decision making functions for any organization that is helpful to match the core competencies and capabilities.
This research work will help to monitor the trade security in the country. Analysis of Amazon conversations related to reviews on purchased electronic items increases amongst Indians. This will represent a new source of information and also helps to explore the new relationships between such conversations, reviews on purchased electronic items inflation and external trends.
Dataset
Segmentation of data
Compute sentiment
Calculate Polarity
IJEDR1702208
International Journal of Engineering Development and Research (www.ijedr.org)1323
II. RELATED WORKDivya Bohra etc [1], 2015: The paper, gives the overall view of sentiment analysis. It also discussed about Common Knowledge Base. Hour Glass Model was also discussed in the paper which was effectively being used for sentiment analysis. Hour glass model was being widely used for designing of intelligent opinion-mining systems which were capable of handling semantic knowledge. It made easier to detect, perceive, and feel the complete range of emotions more accurately. The review on the various sentiment analysis approaches have also been done in the paper. Also, the blend of both common and common sense knowledge bases would be a good choice as it represented the best trade-off between common and common-sense knowledge.
Shailesh Kumar Yadav [2], 2015: Sentiment analysis is vast research and with several challenges. It has a wide variety of applications in e-commerce. It helped in classifying, summarizing reviews and in other real time applications. The paper focused on sentiment classification, classification techniques and what tools were available for sentiment analysis. There were still some open challenges that exist in this area such as discovering of sentiment and their polarity in complex sentences, implicit aspect identification, extraction of opinion phrases and features from different corpora, extraction of multiple opinions from the same document etc. The vocabulary of natural language was very large that things become even hard
Shatakshi Agrawal etc [3], 2015:The paper presented an approach towards the analysis of freely expressed people’s opinions as well as different existing approaches of opinion mining were summarized in the literature reviews for finding the challenges and scope that were available in the field of opinion mining & analysis for efficient decision making.The challenges and scope that were available for analysis of opinions were also stated. The proposed Opinions Mining and Summarization System were described in the paper. In the future, the work would be carried out in order to implement an efficient system that would be able to solve all or some of the challenges presented in the Opinion mining
S. Vasantharajetc [4], 2015: The survey paper tackled a comprehensive summary about the methods and its corresponding techniques in various fields. It mainly focused on opinion mining techniques such as CBR, Supervised, Unsupervised, Machine learning techniques. It provided complete details about the data set, techniques, and its result such as positive, negative and neutral feedback for each method. The literature survey gave the complete information about the sentiment analysis with the recent research work and its task to identify the opinion mining.After analyzing, it's clear that the enhancements of SC associate degreed FS algorithms square measure still an open field for analysis. Naïve Bayes and Support Vector Machines square measure the foremost frequently used algorithms for determination and drawback. They're considered a reference model wherever several planned algorithms are compared. The interest in languages apart from English during this field is growing as there's still an absence of resources and researches regarding these languages.
Nikhil R; Nikhil Tikooetc [5], 2015: Experts estimate that the data generated over the past two years was the same as the amount that was generated from the beginning of time, up until 2012. This exponential increase in the amount of data (termed Big Data) has brought with it a number of issues related to data management and information extraction. This boom in data could however, be looked upon as a blessing rather than a curse. As the web and its usage continue to grow, so does the opportunity to analyze web data and extract all kinds of useful knowledge from it. Many commercial, educational and scientific applications were increasingly dependent on methodologies to extract information from such data sources. Once obtained and analyzed, engineers could make many important predictions and discover fascinating trends that would not have been possible before the analysis.
Horakova; Marketaetc [6], 2015: Presented a model which collects reviews from social networking sites and thus provide a view of business intelligence. In the framework, there are two layers in the sentiment analysis tool, the data processing layer and sentiment analysis layer. Data processing layer deals with data collection and data mining, while sentiment analysis layer use an application to present the result of data mining
IJEDR1702208
International Journal of Engineering Development and Research (www.ijedr.org)1324
Amrita Kaur etc [8], 2015: The paper aimed at presenting the various existing techniques and work done for sentiment analysis till date with issues pertaining to this field and future research prospects in this area. Using Sentiment analysis to mine vast amount of unstructured data had become an important research problem. Development of better products, services and good business management were the products of sentiment analysis. The survey paper presented a broad view on the work done till date in Sentiment Analysis field. The analysis of the articles told that the enhancements of the Sentiment Classification algorithms were still an open research field. Naive Bayes and Support Vector Machines were the most frequently used Machine learning algorithms for Sentiment classification. Among the surveyed approaches the Sentiment Analyzers were language dependent. The media sources such as micro-blogs, blogs, forums and news sources presents a huge amount of information about people's feelings and opinions about a certain topic or product. However, using these social networking sites and micro-blogging sites as a source of data to SA task still needed much deeper analysis and research.III. METHODOLOGY
The various text mining algorithm and streaming of Amazon OCTOPARSE are given in this section. The first step starts with the extraction of reviews followed by preprocessing of the extracted reviews. Then Classifier algorithm has to be applied on it. The Amazon OCTOPARSE named as ‘tweepy’ has been used in this paper for the extraction step. OAuth handler is used for streaming the reviews. Filters are applied on it using the track filter. Due to the policies of Amazon the filtering is not absolutely correct and there might be similar reviews which don’t lie in the filtered bandwidth. The location is done using a ‘location’ filter available with tweepy. The location filter works on the basis of latitude and longitude of the place. A bounding box has to be formed in which the location filter works. Any reviews sent from that bounding box is streamed. Next step is preprocessing step. Pre-processing steps on textual description of bug reports are performed. It includes tokenization, stop word removal and stemming. Tokenization divides textual description into tokens by removing punctuation marks. Then stop words are performed that remove unnecessary information (conjunctions, interjections and articles) from datasets. Stemming on reduced datasets is performed to reduced terms into their root terms. Porter’s stemming algorithm is used to perform stemming.
The steps of implementation can be listed as:
Step 1- The data regarding student problem is collected from social media site (Amazon).
Step 2- Then sampling of the collected data is done through training and testing of data.
Step 3- The preprocessing of text data is done i.e. streaming, tokenization, and special character removal, stop work removal is done on text data.
Step 4- In step 4 Extraction of features is done after preprocessing of the data.
Step 5- In this step conversion of text data to numerical data is done using TFIDF () approach.
Step 6- In this step data analysis is done.
Step 7- Application of Data Mining algorithm is done.
IJEDR1702208
International Journal of Engineering Development and Research (www.ijedr.org)1325
Figure 2. Block Diagram of Proposed SystemIV. RESULTS
As the proposed algorithm is developed using Python3.4, its results are explained below:
1. Collection of Dataset
The First Step is collecting data from Multi-Domain Sentiment Dataset. It includes file with lxml format which are formatted to text. We have included reviews from 9 products. Different products that we have used in this thesis are:
1. Baby Products 2. Beauty products 3. Camera
4. Computer and Video Games 5. Electronics
6. Grocery
7. Health and Personal Care 8. Jewelry and Watches 9. Sports and Outdoors
2. Data Sampling
Sampling of the collected data is done. Data is converted from lxml format to text format. We have included 100 reviews for 9 different products.
3. Pre-processing of Data
In this step, reviews are preprocessed by converting all the words into lower-case. Then detection of the idioms is done and they are joined so as to consider as a unique word.
Then, the message is fragmented into sentences. Dots are considered as only punctuation marks that act as a separator at this step. As other punctuation marks such as commas or semicolons can be part of the emoticons. Tokens are extracted from each sentence. In this only white spaces are considered to separate the tokens as other punctuation marks such as semi colon, hyphen can be the part of emoticons.
4. Extraction of the Feature
Chi-square is used as a Feature selection method which checks the dependency of two variables. This method is only applicable to nominal and categorical data.
5. Score Calculation
IJEDR1702208
International Journal of Engineering Development and Research (www.ijedr.org)1326
Firstly we calculate TF and IDF for each review. Then this TF and IDF is used for the calculation of TF-IDF matrix.6. Data Mining Algorithm
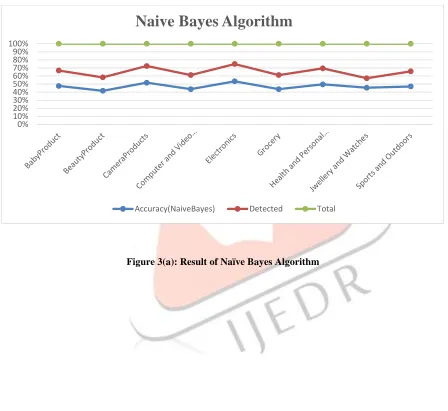
Naïve Bayes and KNN algorithms are applied on the data and the results are obtained. Training to test ratio is kept as 3:1. A total of 100 reviews are finally selected after filtering and manual assignment of sentiments is done to be fed into the classifier. Two types of classifiers are implemented in this thesis.
Naïve Bayes
The result of Naïve Baye’s Classifier is found to be 24.83 correctly classified to that of total 40 reviews. KNN
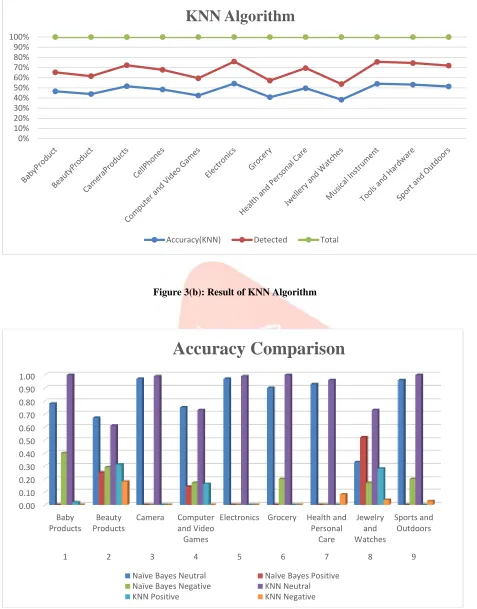
The result of KNN Classifier is found to be 24.89 correctly classified to that of total 40 reviews.
Figure 3(a): Result of Naïve Bayes Algorithm
0% 10% 20% 30% 40% 50% 60% 70% 80% 90% 100%
Naive Bayes Algorithm
IJEDR1702208
International Journal of Engineering Development and Research (www.ijedr.org)1327
Figure 3(b): Result of KNN AlgorithmFigure 3(c): Accuracy Comparison between naïve Bayes and KNN Algorithm
0% 10% 20% 30% 40% 50% 60% 70% 80% 90% 100%
KNN Algorithm
Accuracy(KNN) Detected Total
0.00 0.10 0.20 0.30 0.40 0.50 0.60 0.70 0.80 0.90 1.00
Baby Products
Beauty Products
Camera Computer
and Video Games
Electronics Grocery Health and Personal
Care
Jewelry and Watches
Sports and Outdoors
1 2 3 4 5 6 7 8 9
Accuracy Comparison
Naïve Bayes Neutral Naïve Bayes Positive
Naïve Bayes Negative KNN Neutral
IJEDR1702208
International Journal of Engineering Development and Research (www.ijedr.org)1328
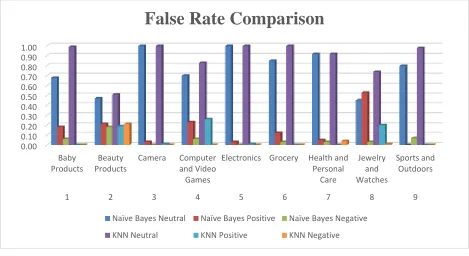
Figure 3(d): False Rate Comparison between Naïve Bayes and KNN Algorithm0.00 0.10 0.20 0.30 0.40 0.50 0.60 0.70 0.80 0.90 1.00
Baby Products
Beauty Products
Camera Computer
and Video Games
Electronics Grocery Health and Personal
Care
Jewelry and Watches
Sports and Outdoors
1 2 3 4 5 6 7 8 9
False Rate Comparison
Naïve Bayes Neutral Naïve Bayes Positive Naïve Bayes Negative
IJEDR1702208
International Journal of Engineering Development and Research (www.ijedr.org)1329
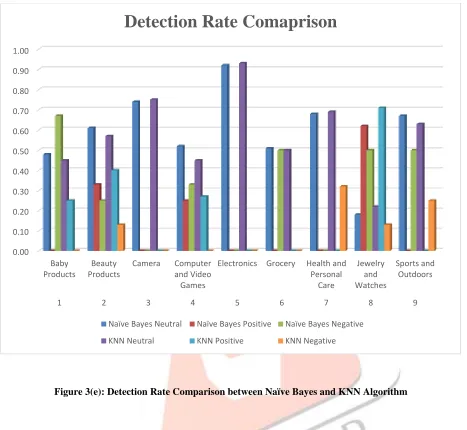
Figure 3(e): Detection Rate Comparison between Naïve Bayes and KNN AlgorithmThe proposed algorithm is tested for various product reviews. The results of different matrices of performance that is accuracy, precision and recall on these reviews are used to verify the performance of proposed algorithm.
𝑨𝒄𝒄𝒖𝒓𝒂𝒄𝒚(𝒙) = (𝑠𝑢𝑚𝑜𝑓𝑐𝑜𝑟𝑟𝑒𝑐𝑡𝑐𝑙𝑎𝑠𝑠𝑖𝑓𝑖𝑐𝑎𝑡𝑖𝑜𝑛
𝑡𝑜𝑡𝑎𝑙𝑛𝑢𝑚𝑏𝑒𝑟𝑜𝑓𝑐𝑙𝑎𝑠𝑠𝑖𝑓𝑖𝑐𝑎𝑡𝑖𝑜𝑛) × 100
𝑺𝒑𝒆𝒄𝒊𝒇𝒊𝒄𝒊𝒕𝒚(𝒙) = ( 𝑛𝑢𝑚𝑏𝑒𝑟𝑜𝑓𝑡𝑟𝑢𝑒 𝑛𝑒𝑔𝑎𝑡𝑖𝑣𝑒
𝑛𝑢𝑚𝑏𝑒𝑟𝑜𝑓𝑡𝑟𝑢𝑒 𝑛𝑒𝑔𝑎𝑡𝑖𝑣𝑒 + 𝑛𝑢𝑚𝑏𝑒𝑟 𝑜𝑓 𝑓𝑎𝑙𝑠𝑒 𝑝𝑜𝑠𝑖𝑡𝑖𝑣𝑒) 𝑋100
𝑹𝒆𝒄𝒂𝒍𝒍(𝒙) = ( 𝑛𝑢𝑚𝑏𝑒𝑟𝑠𝑜𝑓𝑡𝑟𝑢𝑒𝑝𝑜𝑠𝑖𝑡𝑖𝑣𝑒𝑝𝑟𝑒𝑑𝑖𝑐𝑡𝑖𝑜𝑛𝑠
𝑛𝑢𝑚𝑏𝑒𝑟𝑠𝑜𝑓𝑡𝑟𝑢𝑒𝑝𝑜𝑠𝑖𝑡𝑖𝑣𝑒𝑝𝑟𝑒𝑑𝑖𝑐𝑡𝑖𝑜𝑛𝑠 + 𝑛𝑢𝑚𝑏𝑒𝑟𝑠𝑜𝑓𝑓𝑎𝑙𝑠𝑒𝑛𝑒𝑔𝑎𝑡𝑖𝑣𝑒𝑝𝑟𝑒𝑑𝑖𝑐𝑡𝑖𝑜𝑛𝑠) 𝑋100
0.00 0.10 0.20 0.30 0.40 0.50 0.60 0.70 0.80 0.90 1.00
Baby Products
Beauty Products
Camera Computer
and Video Games
Electronics Grocery Health and Personal
Care
Jewelry and Watches
Sports and Outdoors
1 2 3 4 5 6 7 8 9
Detection Rate Comaprison
Naïve Bayes Neutral Naïve Bayes Positive Naïve Bayes Negative
IJEDR1702208
International Journal of Engineering Development and Research (www.ijedr.org)1330
Table 1(a): Results of Reviews for performance metrics for Naïve Bayes Algorithms. no.
Name of Product
Accuracy Specificity(False Rate) Sensitivity(Detection Rate)
Neutral(0 ) Positiv e(1) Negativ e(-1) Neutral(0 ) Positive (1) Negative (-1) Neutral(0 ) Positive (1) Negative (-1)
1 Baby
Products
0.78 0.0 0.4 0.68 0.18 0.06 0.48 0.0 0.67
2 Beauty Products
0.67 0.25 0.29 0.47 0.21 0.18 0.61 0.33 0.25
3 Camera 0.97 0.0 0.0 1.0 0.03 0.0 0.74 0.0 0.0
4 Computer and Video Games
0.75 0.14 0.17 0.7 0.23 0.06 0.52 0.25 0.33
5 Electronics 0.97 0.0 0.0 1.0 0.03 0.0 0.92 0.0 0.0
6 Grocery 0.9 0.0 0.2 0.85 0.12 0.03 0.51 0.0 0.5
7 Health and Personal Care
0.93 0.0 0.0 0.92 0.05 0.03 0.68 0.0 0.0
8 Jewelry and Watches
0.33 0.52 0.17 0.45 0.53 0.03 0.18 0.62 0.5
9 Sports and Outdoors
0.96 0.0 0.2 0.8 0.0 0.07 0.67 0.0 0.5
Table 1(b): Results of Reviews for performance metrics for KNN Algorithm
s. no.
Name of Product Accuracy Specificity(False Rate) Sensitivity(Detection Rate)
Neutral(0 ) Positiv e(1) Negative (-1) Neutral(0 ) Positive (1) Negative (-1) Neutral(0 ) Positive (1) Negative (-1)
1 Baby Products
k=3 1.0 0.08 0.0 0.95 0.0 0.0 0.46 1.0 0.0
k=5 1.0 0.0 0.0 1.0 0.0 0.0 0.45 0.0 0.0
k=7 1.0 0.0 0.0 1.0 0.0 0.0 0.45 0.0 0.0
k=11 1.0 0.0 0.0 1.0 0.0 0.0 0.45 0.0 0.0
2 Beauty Products
k=3 0.57 0.42 0.0 0.47 0.36 0.12 0.57 0.33 0.0
k=5 0.57 0.42 0.14 0.58 0.21 0.15 0.52 0.45 0.17
k=7 0.57 0.33 0.14 0.47 0.11 0.33 0.57 0.57 0.08
k=11 0.71 0.08 0.43 0.53 0.11 0.24 0.6 0.25 0.27
IJEDR1702208
International Journal of Engineering Development and Research (www.ijedr.org)1331
k=5 1.0 0.0 0.0 1.0 0.0 0.0 0.75 0.0 0.0
k=7 1.0 0.0 0.0 1.0 0.0 0.0 0.75 0.0 0.0
k=11 1.0 0.0 0.0 1.0 0.0 0.0 0.75 0.0 0.0
4 Compute r and Video Games
k=3 0.2 0.5 0.0 0.4 0.81 0.0 0.33 0.25 0.0
k=5 0.85 0.0 0.0 1.0 0.12 0.0 0.46 0.0 0.0
k=7 0.9 0.07 0.0 0.95 0.08 0.0 0.49 0.33 0.0
k=11 0.95 0.07 0.0 0.95 0.04 0.0 0.5 0.5 0.0
5 Electroni cs
k=3 0.97 0.0 0.0 1.0 0.03 0.0 0.92 0.0 0.0
k=5 1.0 0.0 0.0 1.0 0.0 0.0 0.93 0.0 0.0
k=7 1.0 0.0 0.0 1.0 0.0 0.0 0.93 0.0 0.0
k=11 1.0 0.0 0.0 1.0 0.0 0.0 0.93 0.0 0.0
6 Grocery k=3 1.0 0.0 0.0 1.0 0.0 0.0 0.5 0.0 0.0
k=5 1.0 0.0 0.0 1.0 0.0 0.0 0.5 0.0 0.0
k=7 1.0 0.0 0.0 1.0 0.0 0.0 0.5 0.0 0.0
k=11 1.0 0.0 0.0 1.0 0.0 0.0 0.5 0.0 0.0
7 Health and Personal
Care
k=3 0.85 0.0 0.22 0.77 0.0 0.16 0.70 0.0 0.29
k=5 1.0 0.0 0.11 0.92 0.0 0.0 0.69 0.0 1.0
k=7 1.0 0.0 0.0 1.0 0.0 0.0 0.68 0.0 0.0
k=11 1.0 0.0 0.0 1.0 0.0 0.0 0.68 0.0 0.0
8 Jewelry and Watches
k=3 0.56 0.44 0.17 0.58 0.27 0.03 0.22 0.73 0.5
k=5 0.78 0.32 0.0 0.74 0.13 0.0 0.23 0.8 0.0
k=7 0.67 0.24 0.0 0.74 0.33 0.0 0.21 0.55 0.0
k=11 0.89 0.12 0.0 0.90 0.07 0.0 0.22 0.75 0.0
9 Sports and Outdoors
k=3 1.0 0.0 0.1 0.93 0.0 0.0 0.64 0.0 1.0
k=5 1.0 0.0 0.0 1.0 0.0 0.0 0.63 0.0 0.0
k=7 1.0 0.0 0.0 1.0 0.0 0.0 0.63 0.0 0.0
IJEDR1702208
International Journal of Engineering Development and Research (www.ijedr.org)1332
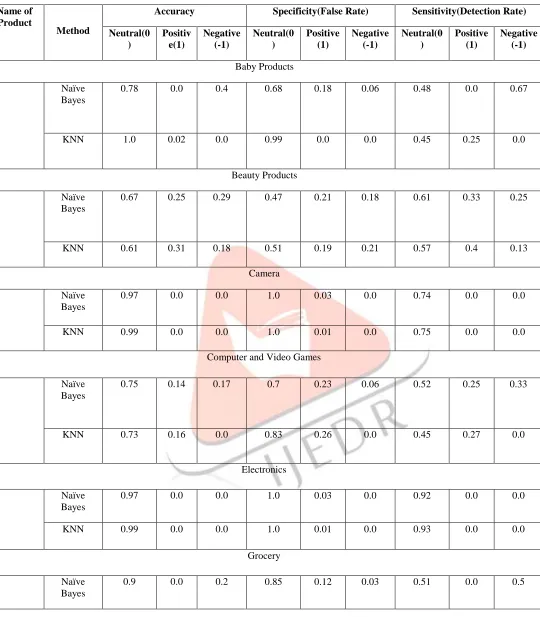
Table 1(c): Comparison of results for Different ReviewsName of Product
Method
Accuracy Specificity(False Rate) Sensitivity(Detection Rate)
Neutral(0 )
Positiv e(1)
Negative (-1)
Neutral(0 )
Positive (1)
Negative (-1)
Neutral(0 )
Positive (1)
Negative (-1)
Baby Products
Naïve Bayes
0.78 0.0 0.4 0.68 0.18 0.06 0.48 0.0 0.67
KNN 1.0 0.02 0.0 0.99 0.0 0.0 0.45 0.25 0.0
Beauty Products
Naïve Bayes
0.67 0.25 0.29 0.47 0.21 0.18 0.61 0.33 0.25
KNN 0.61 0.31 0.18 0.51 0.19 0.21 0.57 0.4 0.13
Camera
Naïve Bayes
0.97 0.0 0.0 1.0 0.03 0.0 0.74 0.0 0.0
KNN 0.99 0.0 0.0 1.0 0.01 0.0 0.75 0.0 0.0
Computer and Video Games
Naïve Bayes
0.75 0.14 0.17 0.7 0.23 0.06 0.52 0.25 0.33
KNN 0.73 0.16 0.0 0.83 0.26 0.0 0.45 0.27 0.0
Electronics
Naïve Bayes
0.97 0.0 0.0 1.0 0.03 0.0 0.92 0.0 0.0
KNN 0.99 0.0 0.0 1.0 0.01 0.0 0.93 0.0 0.0
Grocery
Naïve Bayes
IJEDR1702208
International Journal of Engineering Development and Research (www.ijedr.org)1333
KNN 1.0 0.0 0.0 1.0 0.0 0.0 0.5 0.0 0.0
Health and Personal Care
Naïve Bayes
0.93 0.0 0.0 0.92 0.05 0.03 0.68 0.0 0.0
KNN 0.96 0.0 0.08 0.92 0.0 0.04 0.69 0.0 0.32
Jewelry and Watches
Naïve Bayes
0.33 0.52 0.17 0.45 0.53 0.03 0.18 0.62 0.5
KNN 0.73 0.28 0.04 0.74 0.2 0.01 0.22 0.71 0.13
Sports and Outdoors
Naïve Bayes
0.96 0.0 0.2 0.8 0.0 0.07 0.67 0.0 0.5
KNN 1.0 0.0 0.03 0.98 0.0 0.0 0.63 0.0 0.25
V. CONCLUSION
A methodology for the classification of sentiments was developed in this paper for reviews on purchased items in Indian market.12 product reviews were used in this paper. The streamed reviews was filtered for relevant content and stored in a database. The several steps of pre-processing were applied on it and the reviews were removed from special characters, stop word, tokenized, etc. Stemming was done to all words in order to extract the root words. TF-IDF score based approach was utilized and the score was calculated for each reviews. Feature Selection was applied on it using Chi Square method and information gain. The extracted feature forms a term document matrix which is utilized in the classification algorithm. Two classification algorithms are compared as shown in previous section. The results are found to be satisfactory and when comparative analysis is done between them it is found that Naïve Bayes algorithm outperforms KNN algorithm. Thus an automated system is designed for sentiment mining related to reviews on different purchased items. While assessing the obtained results, a few limitations were noticed. We cannot process Fake Reviews which can affect the overall reviews. Online reviews also include number of stars for reviews which are not processed in this thesis work. We can also improve the overall performance by using hybrid algorithms.
REFERENCES
1. Divya Bohra, Sanjay Deshmukh, a Survey on Sentiment Analysis in NLP, International Journal of Advanced Research in Computer and Communication Engineering (2015)
2. Shailesh Kumar Yadav, Sentiment Analysis and Classification: A Survey, International Journal of Advance Research in Computer Science and Management Studies (2015)
IJEDR1702208
International Journal of Engineering Development and Research (www.ijedr.org)1334
4. S. Vasantharaj, A. Martin, A. Meiappane, J. Madhusudnan, a Survey on Sentiment Analysis Applied inOpinion Mining, Journal of Network Communications and Emerging Technologies (JNCET)(2015)
5. Horakova, Marketa. "Sentiment Analysis Tool using Machine Learning." Global Journal on Technology
(2015).
6. Nikhil R, Nikhil Tikoo, SukritKurle; Hari SravanPisupati, Dr. Prasad G R, A Survey on Text Mining and Sentiment Analysis for Unstructured Web Data, Journal of Emerging Technologies and Innovative Research (JETIR)(2015)
7. Saurin Dave, Prof.HiteishiDiwanji, Trend Analysis in Social Networking using Opinion Mining a Survey, IJSRSET (2015)